Most Requested Symbols

Using a relative strength matrix can help determine points of long-term strength, but it can also play a part in finding moves before they occur...
Semiconductors surge higher while software names begin to dim.
NDW Morning Update Video - July 22, 2025
NDW Morning Update Video – July 22, 2025.
Click here to download MP3
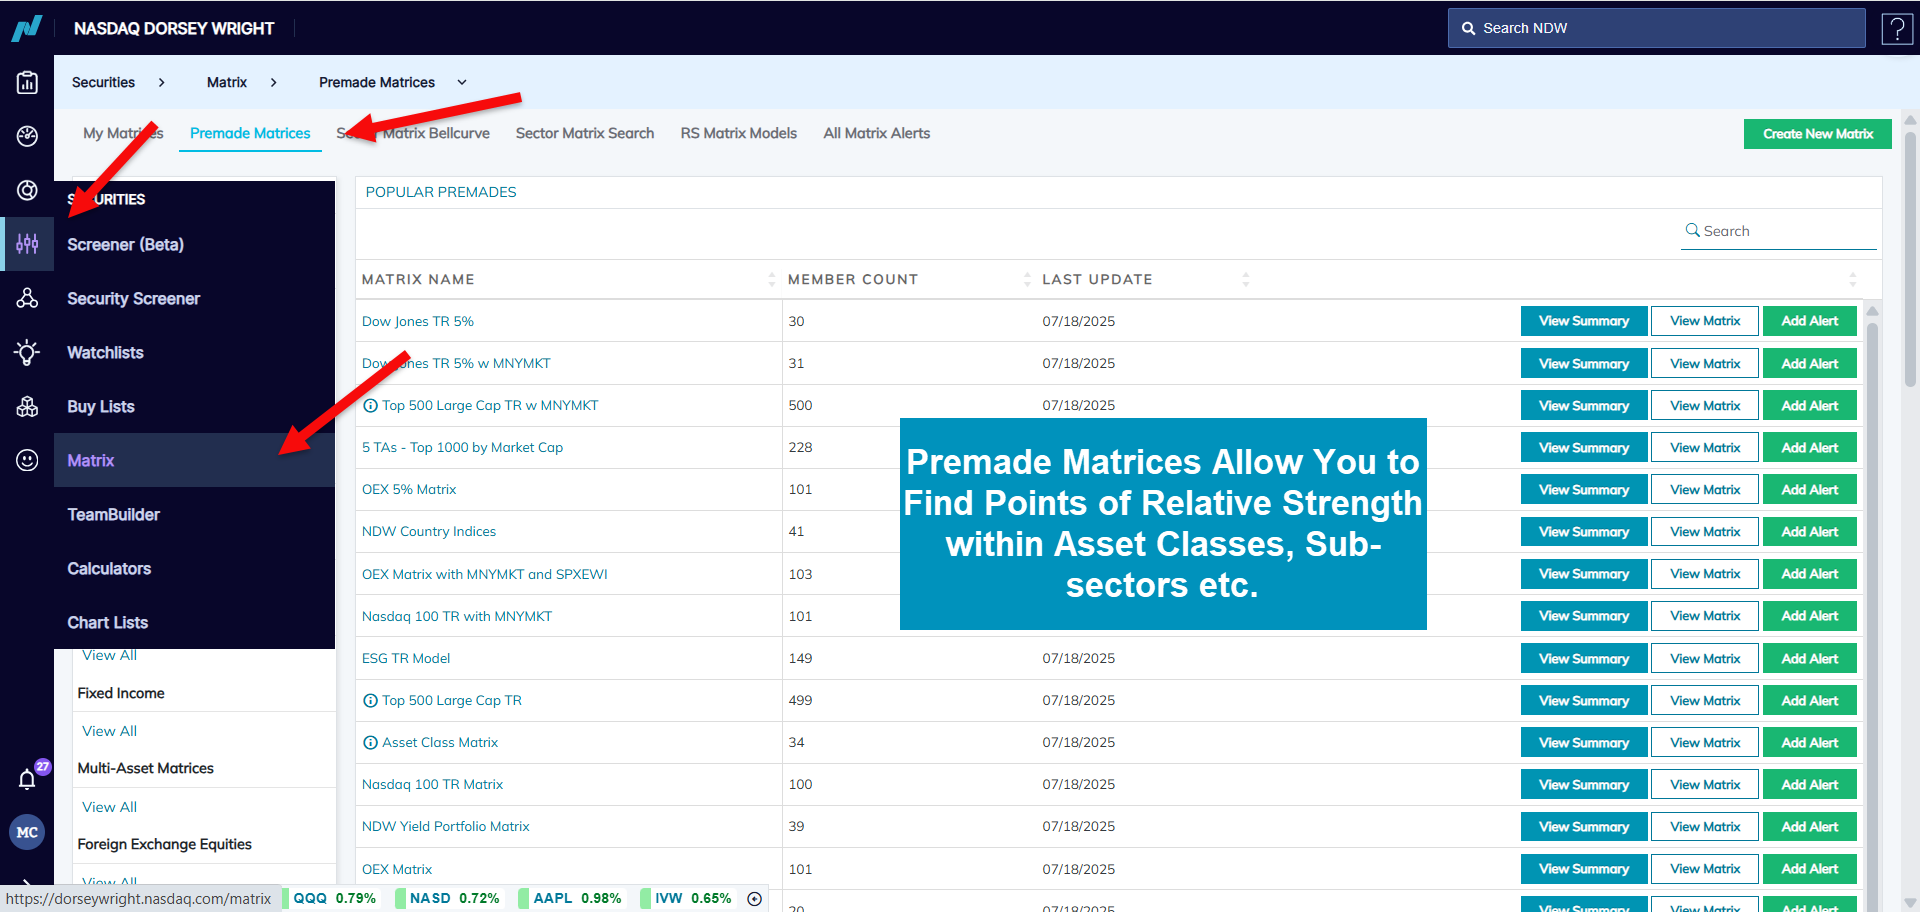
Absolute improvement is important. After all, understanding if assets could move up or down is the first step of any sound investment process. After that, understanding relative performance is key. Knowing a given stock will move up 5% would be nice, but if your benchmark is up 10% over the same timeframe, you have underperformed. The same is true towards the downside. All this to say, relative price is important, and lies at the heart of much of Dorsey Wright analysis.
To dive deeper into relative strength, Dorsey Wright utilizes the matrix tool. For those of you familiar with the matrix, feel free to skip ahead in the piece. For those that aren’t, the matrix system pins the constituents within a given universe against one another. From there, each member of the universe is then ranked on how many long-term buy signals each earns, with more buy signals suggesting an asset is a “relative leader” amongst its peers. The opposite is true with those members earning few signals a point of relative weakness. One can overlay this methodology onto any universe, spanning from major indices to matrices with representatives across asset classes. One final point to open the rest of the piece: rankings are built on buy signals but the matrix rankings also provide the total X count, which details a more near-term picture of an asset’s strength.
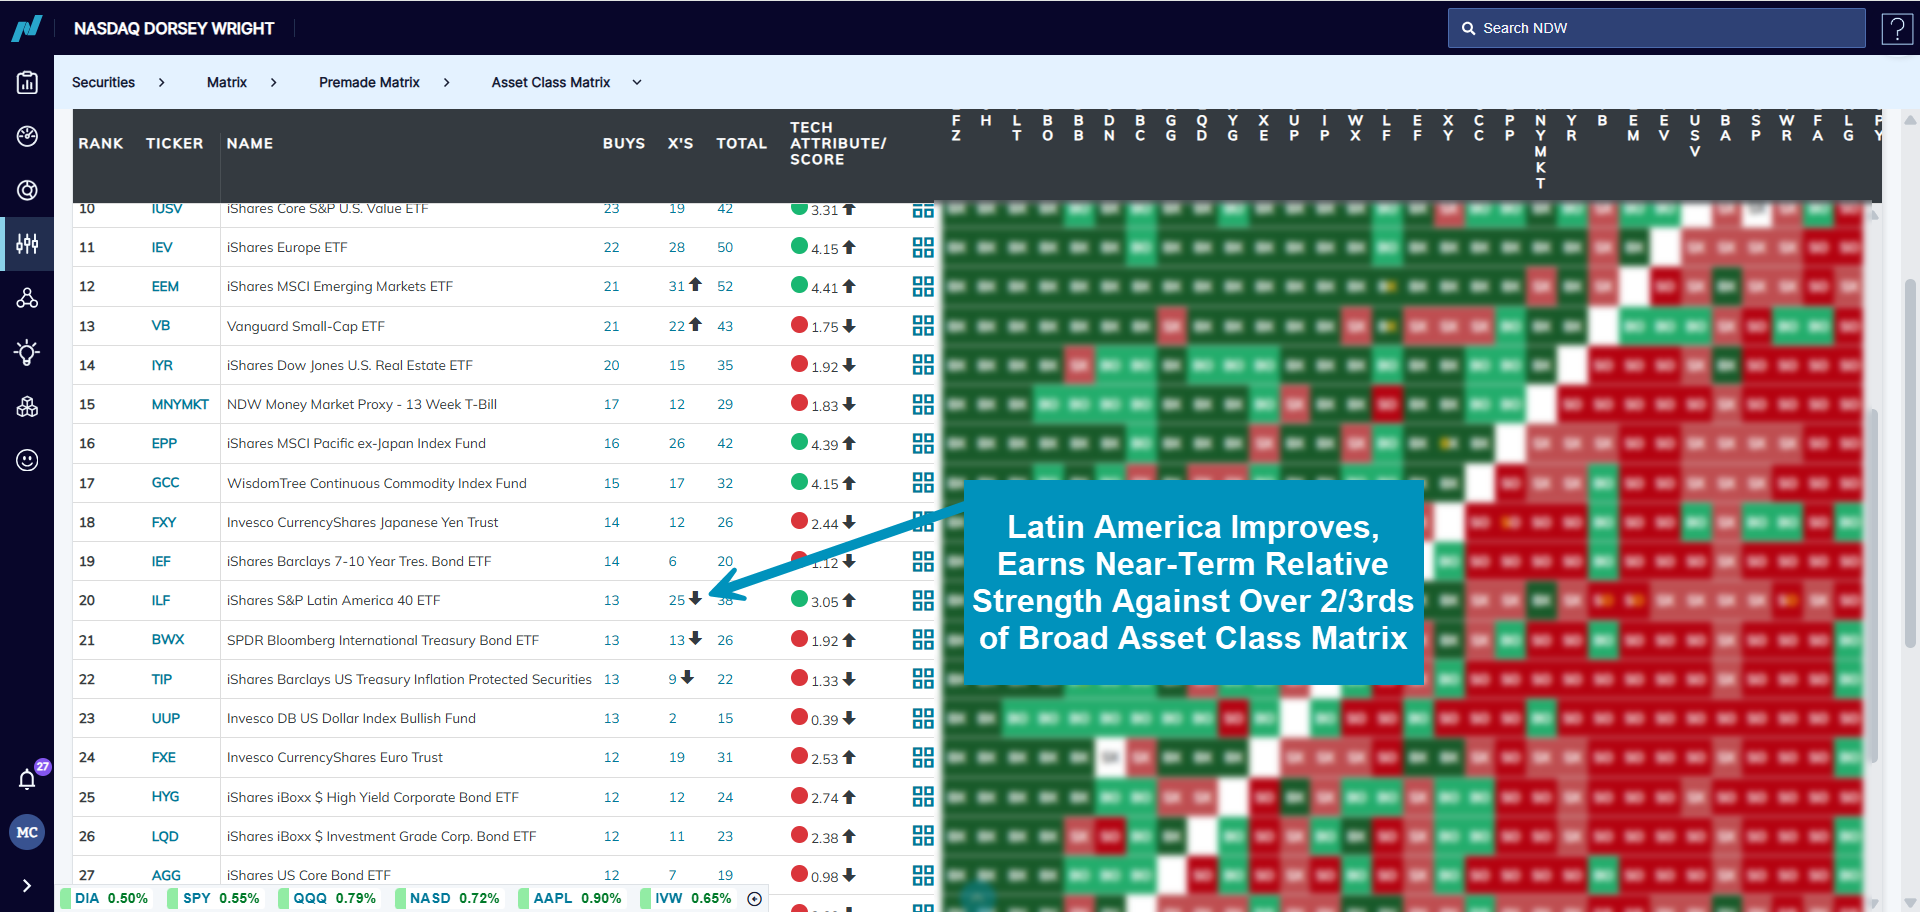
Today, we will focus on the asset class matrix, which uses a set of 34 different funds across each of the broad asset classes detailed in NDW’s DALI rankings. Strength remains largely focused on those areas recent research has focused heavily on. Precious metals, core domestic equities, broad internationals, all have their respective place in the top third (strongest) of the matrix. Drifting down the page, points of weakness remain largely consistent as well- seeing fixed income and currency groups earning the least amount of long-term strength as of 7/21. What is of interest for today’s report will be those areas in the “extremes” of the matrix based on long-term buy signals but with a differing view based on their near-term X count. For example, Latin America representative ILF ranks in the bottom half of the matrix based on a traditional buy signal count but sits in a column of X’s against 25 other members (9th highest.) The fund also holds a now technically acceptable 3.05 fund score. While those more defensive clients should tread lightly as the group is still far from a technical leader, those looking to broaden out their international exposure may keep some Latin America names on the back burner as it appears the space (and emerging markets in general) are catching up to their developed market counterparts.
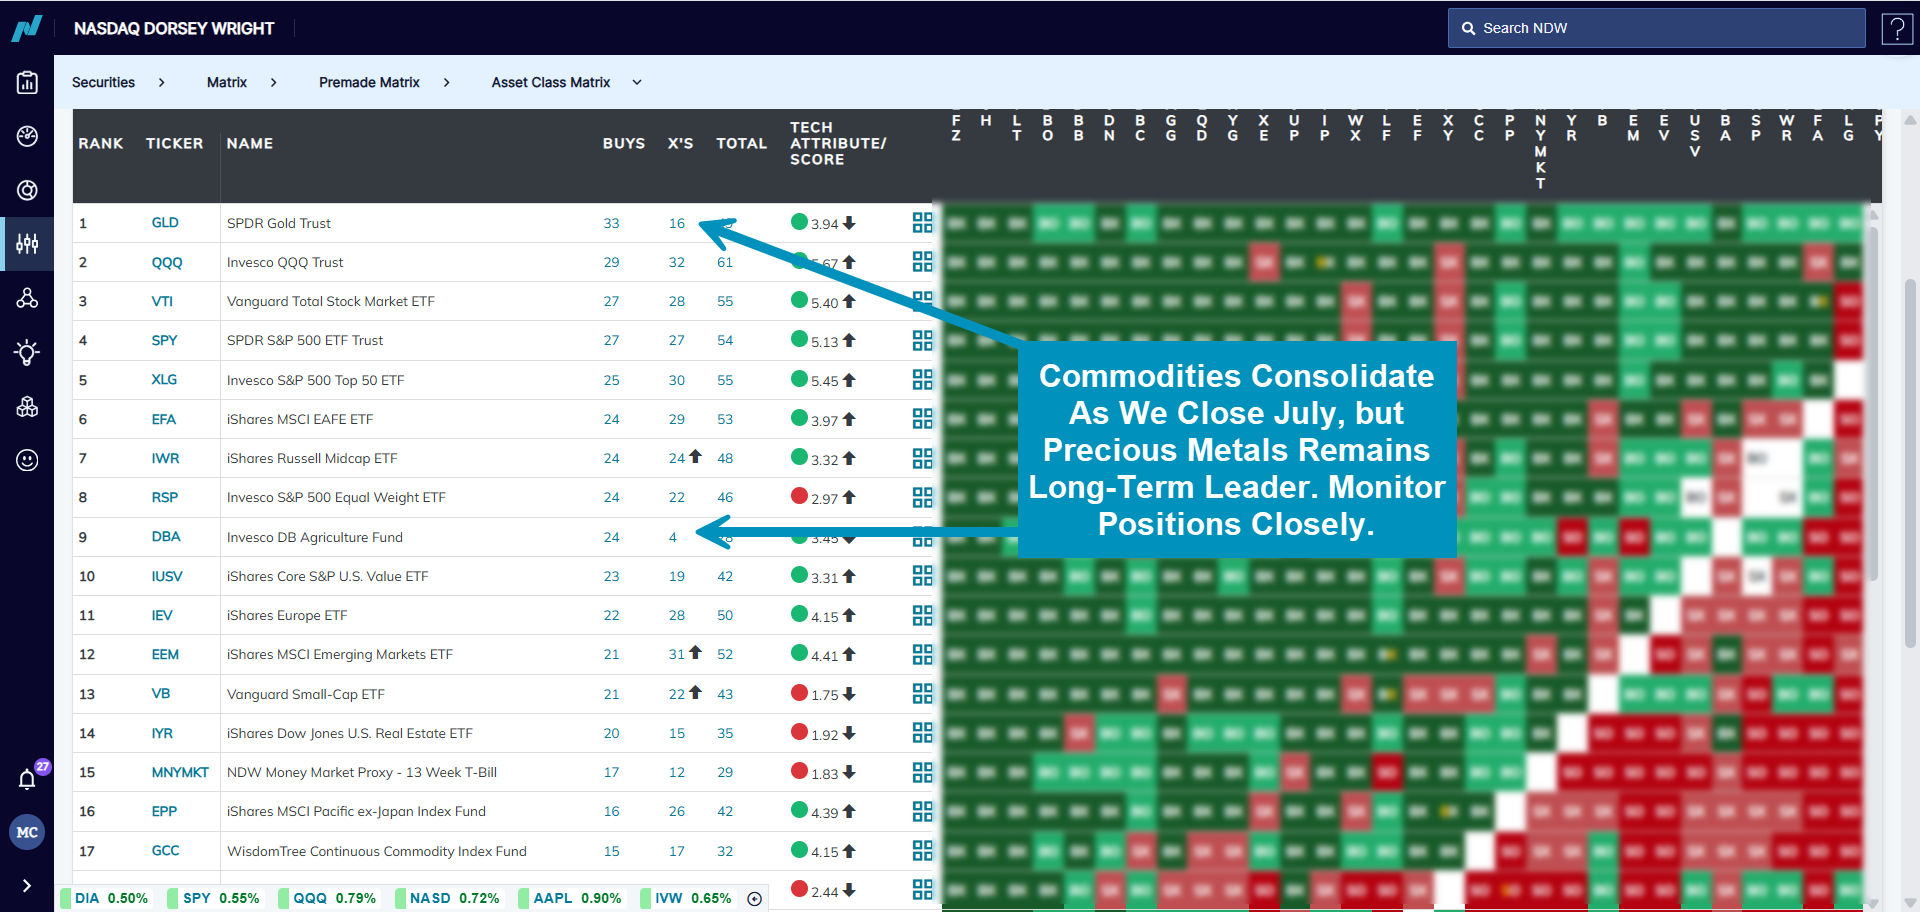
On the opposite side of things, we can journey back towards the top of the matrix again. While leadership trends remain largely consistent, there are some points within commodities that look to be shedding some relative strength as we move towards the end of July. Gold representative GLD remains on a buy signal against all other members of the matrix but in a column of X’s against half the universe. Agriculture fund DBA earns 24 buy signals but sits in a column of X’s against just four names within the matrix. This comes at a point where it looks as if commodities seem to be losing ground in the broad DALI rankings, falling now nine signals behind second-ranked International Equities. While still close in signal count, this recent consolidation from areas within precious metals remains a focal point for the group from a relative perspective. If you have exposure, continue to monitor as further consolidation could lead to negative relative strength and warrant a decrease in allocation in your portfolio.

The technology sector has seen increasing momentum over the last few months but is showing some notable technical divergences underneath the hood. The broad S&P technology sector has improved the most out of the 11 broad S&P sectors over just about any near-term timeframe, including the trailing week (+2.75%), trailing month (+10%), and trailing three months (+41%), through Monday. This improvement has largely been because of semiconductors. NVIDIA (NVDA) has famously gained more than 75% from its recent low on April 7, becoming the first company to cross over the $4 trillion market cap threshold. However, many other semiconductor companies have seen remarkable near-term improvement. This led the Ten Week for Semiconductors (^TWSEMI) to reach 96% at the beginning of the month, its highest reading since early 2021. That means that 96% of semiconductor stocks were trading above their 10-week, or 50-day, moving average. We use the 10-week indicators as a near-term participation reading. Extremely high levels like that point toward a thrust of positive momentum for the underlying universe, which is a positive sign in the intermediate term.
On the other hand, the software subsector has not shown the same level of improvement. The Ten Week for Software (^TWSOFT) topped out at 72% on May 12 and has been unable to push higher. It ultimately moved back below the 50% mark on July 11. That move led to a historic spread in near-term participation readings between the ^TWSEMI and ^TWSOFT indicators, moving north of 46% on July 11 to notch the second highest spread since our data began in 1996. Other high spread periods include the summer of 1999, September 2019, December 2021, and November 2022.

These participation readings move around a lot. This makes sense when considering their near-term focus; the quick-moving nature of 10-week charts is only going to make the spread change more frequently. This admittedly creates a very noisy graph. The only important thing to understand from the graph is that it is rare to see such a massive divergence in underlying participation from the two largest technology subsectors.
With that said, it is normal for software stocks to trail semiconductors. We have seen 40 other instances where ^TWSEMI pushed above 80% since 1996. Only one of those instances saw ^TWSOFT move above 80% before semiconductors (2/19/2019). Only 13 of the remaining 39 instances saw ^TWSOFT eventually move above 80% before it fell below 50%. So, when semiconductors show strong near-term breadth, software stocks only show similar follow-through just over one-third of the time. That number is even lower if we just look over the past 10 years, with only three out of 22 instances.
It makes sense conceptually for the performance of software stocks to trail semiconductors with the supply chain of technological innovation. Advancing technology generally carries the need for more computing power. Semiconductor companies then need to build more efficient chips. Software companies need to pay up to get the latest chips, pushing share prices of the semiconductors higher. Eventually, the implementation of the technological innovation should carry over to share price appreciation for software stocks. That inherently takes more time to come to fruition, if it ever does.
Software stocks have had an especially tough time catching up to semiconductor stocks over the past decade. The iShares North American Tech-Software ETF (IGV) is trailing the VanEck Semiconductor ETF (SMH) by over 8% a year over the past 10 years. Both funds have handily beat the S&P 500 Index (SPX) over that timeframe, but semi’s have been the clear winner, especially over the last few years.
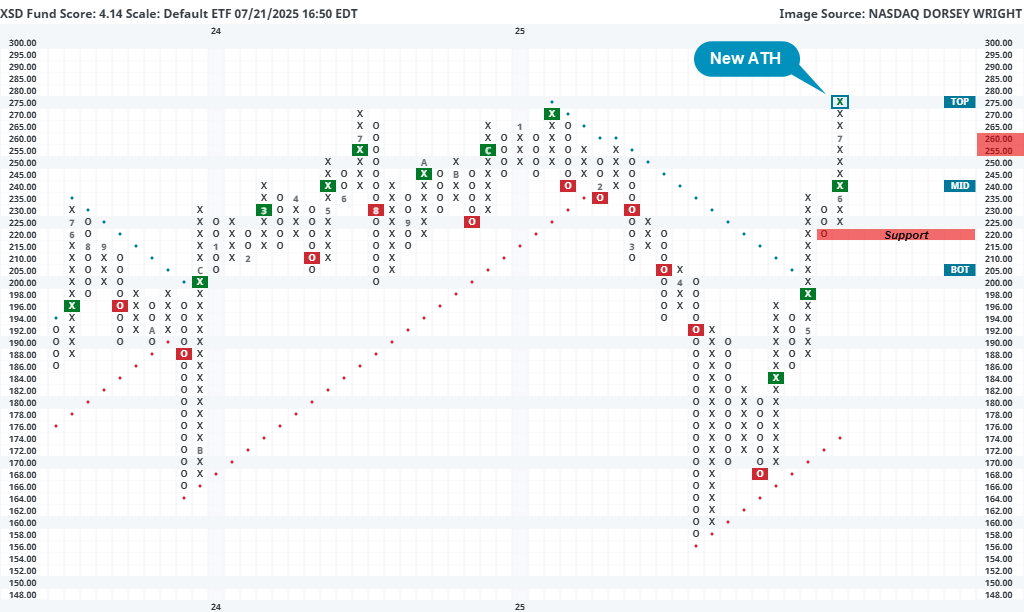
The magnitude of outperformance from semiconductors also shows no signs of stopping. Of course, that could change with one headline or social media post, but the elevated near-term breadth readings like ^TWSEMI means more names are showing technical improvement. This could open the door for sustained outperformance from a broader representative like the SPDR S&P Semiconductor ETF (XSD). This fund uses a modified equal-weight approach to provide more diverse exposure to the subsector, with no stocks showing more than a 4% weighting as of June 30.
XSD carries a robust 4.14 fund score, sitting on three consecutive buy signals after moving back to a positive trend in May. Monday’s market action led XSD to notch a new all-time high at $275, pushing through overhead resistance from January and last July. Monthly momentum also recently flipped positive, suggesting the potential for further upside from here. While the technical picture is strong, XSD is in an overbought position. Initial support can be seen on the default chart at $220 with potential near-term support seen on the more sensitive 2-pt chart around $258.
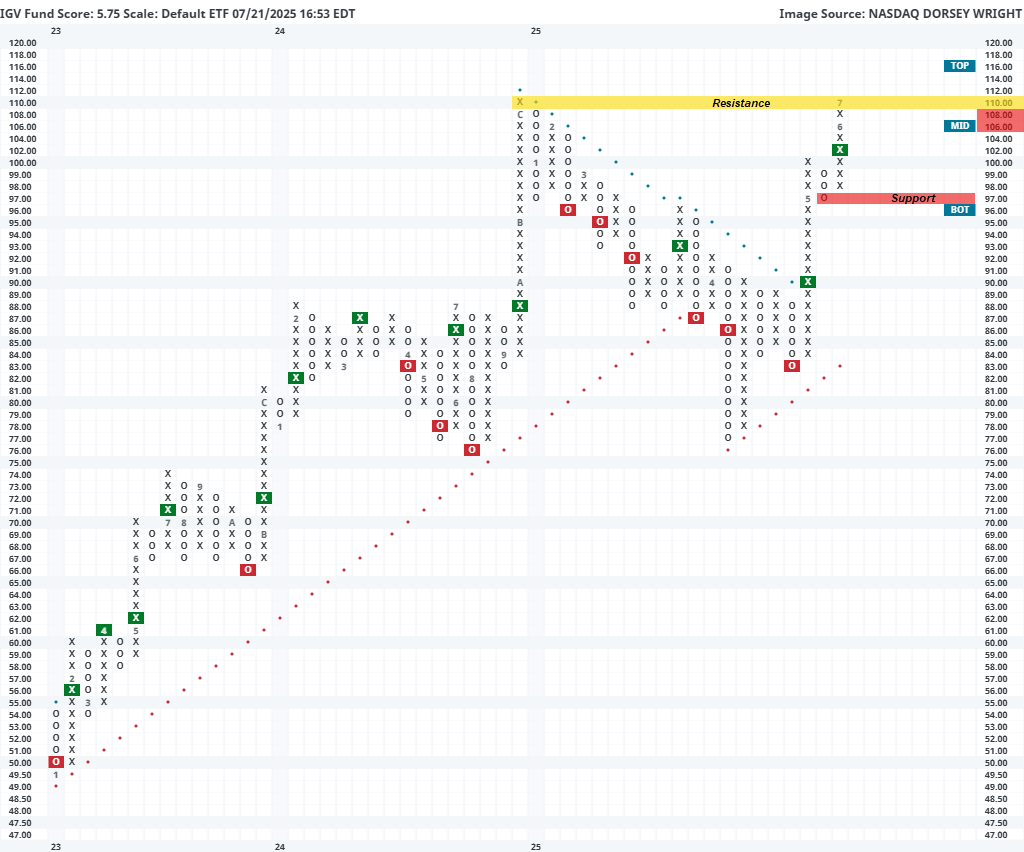
There are still some strong software names out there even though the broader space is showing declining breadth. Such a scenario makes it important to focus exposure on stocks that have demonstrated more resilience, which points toward the larger names. The iShares North American Tech-Software ETF (IGV) provides cap-weighted exposure to the broader software space and carries a near-perfect 5.75 fund score. The fund sits on two consecutive buy signals but is currently matching all-time highs from December at $110. Movement to $112 would produce a new all-time chart high. IGV is also more actionable at current levels. Initial support can be seen at $97 on the default chart or on the more sensitive 1-point chart at $108 and $102.
Average Level
35.42
| < - -100 | -100 - -80 | -80 - -60 | -60 - -40 | -40 - -20 | -20 - 0 | 0 - 20 | 20 - 40 | 40 - 60 | 60 - 80 | 80 - 100 | 100 - > |
|---|---|---|---|---|---|---|---|---|---|---|---|
|
Buy signalief
|
Buy signalIJH
|
||||||||||
|
Sell signalicf
|
Buy signalrsp
|
||||||||||
|
Buy signalagg
|
Buy signalhyg
|
||||||||||
|
Buy signalshy
|
Buy signalgsg
|
Buy signalgcc
|
|||||||||
|
Sell signaltlt
|
Sell signalGLD
|
Buy signalfxe
|
Buy signalVOOV
|
Buy signaleem
|
Buy signalVOOG
|
||||||
|
Sell signaldx/y
|
Sell signalUSO
|
Buy signalijr
|
Buy signaldia
|
Buy signalSPY
|
Buy signalONEQ
|
||||||
|
Buy signalefa
|
Buy signallqd
|
Sell signaldvy
|
Buy signaliwm
|
Buy signalQQQ
|
Buy signalXLG
|
||||||
| < - -100 | -100 - -80 | -80 - -60 | -60 - -40 | -40 - -20 | -20 - 0 | 0 - 20 | 20 - 40 | 40 - 60 | 60 - 80 | 80 - 100 | 100 - > |
| AGG | iShares US Core Bond ETF |
| USO | United States Oil Fund |
| DIA | SPDR Dow Jones Industrial Average ETF |
| DVY | iShares Dow Jones Select Dividend Index ETF |
| DX/Y | NYCE U.S.Dollar Index Spot |
| EFA | iShares MSCI EAFE ETF |
| FXE | Invesco CurrencyShares Euro Trust |
| GLD | SPDR Gold Trust |
| GSG | iShares S&P GSCI Commodity-Indexed Trust |
| HYG | iShares iBoxx $ High Yield Corporate Bond ETF |
| ICF | iShares Cohen & Steers Realty ETF |
| IEF | iShares Barclays 7-10 Yr. Tres. Bond ETF |
| LQD | iShares iBoxx $ Investment Grade Corp. Bond ETF |
| IJH | iShares S&P 400 MidCap Index Fund |
| ONEQ | Fidelity Nasdaq Composite Index Track |
| QQQ | Invesco QQQ Trust |
| RSP | Invesco S&P 500 Equal Weight ETF |
| IWM | iShares Russell 2000 Index ETF |
| SHY | iShares Barclays 1-3 Year Tres. Bond ETF |
| IJR | iShares S&P 600 SmallCap Index Fund |
| SPY | SPDR S&P 500 Index ETF Trust |
| TLT | iShares Barclays 20+ Year Treasury Bond ETF |
| GCC | WisdomTree Continuous Commodity Index Fund |
| VOOG | Vanguard S&P 500 Growth ETF |
| VOOV | Vanguard S&P 500 Value ETF |
| EEM | iShares MSCI Emerging Markets ETF |
| XLG | Invesco S&P 500 Top 50 ETF |

| Symbol | Company | Sector | Current Price | Action Price | Target | Stop | Notes |
|---|---|---|---|---|---|---|---|
| LAMR | Lamar Advertising Company | Media | $124.92 | mid 110s - low 120s | 144 | 99 | 5 for 5'er, LT pos peer & mkt RS, bullish catapult, good R-R, 5.2% yield, Earn. 8/8 |
| LDOS | Leidos Holdings Inc. | Aerospace Airline | $162.54 | 140s - low 150s | 174 | 128 | 5 for 5'er, favored AERO sector, LT pos mkt & peer RS, bullish catapult, Earn. 8/5 |
| CCEP | Coca-Cola Europacific Partners PLC | Food Beverages/Soap | $96.84 | hi 80s - low 90s | 111 | 80 | 5 for 5'er, top 20% of FOOD sector matrix, LT pos peer & mkt RS, quad top, 2.4% yield, Earn. 8/6 |
| COST | Costco Wholesale Corporation | Retailing | $950.95 | mid 900s - lo 1000s | 1296 | 792 | 4 TA rating, LT RS buy, LT pos trend, top 50% of RETA sector matrix, buy on pullback |
| GILD | Gilead Sciences, Inc. | Biomedics/Genetics | $108.22 | 100s to mid 110s | 141 | 88 | 4 TA rating, top 50% of BIOM sector matrix, LT pos trend, buy on pullback, Earn. 8/7 |
| APEI | American Public Education Inc. | Business Products | $30.34 | hi 20s - low 30s | 42 | 25 | 5 for 5'er, top 10% of BUSI sector matrix, shakeout to triple top breakout, Earn. 8/11 |
| OLLI | Ollies Bargain Outlet Holding Inc. | Retailing | $132.16 | 120s | 150 | 102 | 5 for 5'er, top 25% of favored RETA sector matrix, LT pos mkt RS, buy on pullback |
| MNST | Monster Beverage Corp. | Food Beverages/Soap | $59.00 | hi 50s - lo 60s | 80 | 50 | 5 TA rating, top 20% of FOOD sector matrix, LT RS buy, buy-on-pullback,Earn. 8/11 |
| ARES | Ares Management Corp | Finance | $183.12 | mid 160s - 170s | 200 | 154 | 5 for 5'er, top half of favored FINA sector matrix, LT pos peer & mkt RS, bullish triangle, Earn. 8/1 |
| DRI | Darden Restaurants, Inc. | Restaurants | $209.54 | hi 190s - mid 210s | 262 | 178 | 5 TA rating, top 50% of REST sector matrix, LT RS buy, consec buy signals, buy-on-pullback |
| ERJ | Embraer - Empresa Brasileira de Aeronau (Brazil) ADR | Aerospace Airline | $49.30 | hi 40s - low 50s | 92 | 43 | 4 for 5'er, top half of AERO sector matrix, LT pos peer & mkt RS, triple top, buy on pullback, Earn. 8/5 |
| HWC | Hancock Whitney Corp | Banks | $60.21 | hi 50s - lo 60s | 83 | 50 | 5 TA rating, top 50% of BANK sector matrix, LT RS buy, consec buy signals, buy-on-pullback |
| WPM | Wheaton Precious Metals Corp | Precious Metals | $88.32 | mid 80s - low 90s | 108 | 75 | 5 for 5'er, top half of PREC sector matrix, LT pos peer RS, spread triple top, buy on pullback, Earn. 8/7 |
| UAL | United Airlines Holdings Inc. | Aerospace Airline | $92.25 | hi 80s - low 90s | 116 | 79 | 4 for 5'er, top half of favored AERO sector matrix, multiple buy signals, buy on pullback |
| Symbol | Company | Sector | Current Price | Action Price | Target | Stop | Notes |
|---|---|---|---|---|---|---|---|
| TARS | Tarsus Pharmaceuticals, Inc. | Biomedics/Genetics | $43.25 | low 40s | 28 | 49 | 1 for 5'er, bottom 10% of BIOM sector matrix, RS sell signal, spread quad bottom, Earn. 8/7 |
| Symbol | Company | Sector | Current Price | Action Price | Target | Stop | Notes |
|---|---|---|---|---|---|---|---|
| SPG | Simon Property Group, Inc. | Real Estate | $162.86 | mid 150s - 160s | 184 | 138 | Removed for earnings. Earn. 8/4 |
| LNG | Cheniere Energy, Inc. | Oil Service | $244.28 | 210s - 230s | 320 | 188 | LNG has fallen to a sell signal. OK to hold here. Raise top to $204. Earn. 8/7 |
| MA | Mastercard Incorporated Class A | Finance | $552.66 | 490s - 550s | 808 | 424 | Removed for earnings. Raise stop to $464. Earn. 7/31 |
| WMB | Williams Companies Inc. | Gas Utilities | $59.35 | hi 50s - lo 60s | 77 | 49 | Removed for earnings. Earn. 8/4 |
| PRDO | Perdoceo Education Corporation | Business Products | $29.65 | hi 20s - lo 30s | 55 | 23 | Removed for earnings. Earn. 7/31 |
| Comment | |||||||
|---|---|---|---|---|---|---|---|
|
|
|||||||
UAL United Airlines Holdings Inc. R ($92.40) - Aerospace Airline - UAL is a 4 for 5'er that ranks in the top half of the favored aerospace airlines sector matrix. On its default chart, UAL has completed four consecutive buy signals, most recently breaking double top at $94 and has subsequently pulled back to $90. Long exposure may be added in the upper $80s to low $90s and we will set our initial stop at $79, which would take out two levels of support on UAL's chart and violate its trend line. We will use the stock's high from January of this year, $116, as our target price.
| 94.00 | X | 94.00 | |||||||||||||||||||||||||||
| 93.00 | X | X | O | 93.00 | |||||||||||||||||||||||||
| 92.00 | X | O | X | O | 92.00 | ||||||||||||||||||||||||
| 91.00 | X | O | X | O | 91.00 | ||||||||||||||||||||||||
| 90.00 | X | O | X | O | 90.00 | ||||||||||||||||||||||||
| 89.00 | X | O | X | 89.00 | |||||||||||||||||||||||||
| 88.00 | X | O | X | 88.00 | |||||||||||||||||||||||||
| 87.00 | X | O | X | 87.00 | |||||||||||||||||||||||||
| 86.00 | • | X | O | 86.00 | |||||||||||||||||||||||||
| 85.00 | • | X | • | X | 85.00 | ||||||||||||||||||||||||
| 84.00 | • | X | X | X | O | • | X | 84.00 | |||||||||||||||||||||
| 83.00 | • | X | O | X | O | X | O | • | X | X | 83.00 | ||||||||||||||||||
| 82.00 | • | X | O | X | O | X | O | • | X | O | X | 82.00 | |||||||||||||||||
| 81.00 | • | X | O | X | O | 6 | O | • | 7 | O | X | Mid | 81.00 | ||||||||||||||||
| 80.00 | • | X | X | O | X | O | X | O | X | X | O | 80.00 | |||||||||||||||||
| 79.00 | X | O | X | O | O | X | X | O | X | O | X | • | 79.00 | ||||||||||||||||
| 78.00 | X | O | X | O | X | O | X | O | X | X | O | X | • | 78.00 | |||||||||||||||
| 77.00 | X | X | O | O | X | O | X | O | X | O | X | O | • | 77.00 | |||||||||||||||
| 76.00 | X | O | X | O | O | X | O | X | O | X | • | 76.00 | |||||||||||||||||
| 75.00 | X | O | X | O | X | O | X | O | X | • | 75.00 | ||||||||||||||||||
| 74.00 | X | O | X | O | X | O | X | O | X | • | 74.00 | ||||||||||||||||||
| 73.00 | X | X | O | O | O | • | O | X | • | 73.00 | |||||||||||||||||||
| 72.00 | X | O | X | • | • | O | • | 72.00 | |||||||||||||||||||||
| 71.00 | X | O | X | • | • | 71.00 | |||||||||||||||||||||||
| 70.00 | X | O | X | X | • | 70.00 | |||||||||||||||||||||||
| 69.00 | X | O | X | O | 5 | • | 69.00 | ||||||||||||||||||||||
| 68.00 | X | O | X | O | X | • | 68.00 | ||||||||||||||||||||||
| 67.00 | X | O | X | O | X | • | 67.00 | ||||||||||||||||||||||
| 66.00 | X | O | O | • | 66.00 | ||||||||||||||||||||||||
| 65.00 | X | • | 65.00 |
| AU AngloGold Ashanti Limited (South Africa) ADR ($50.62) - Precious Metals - AU returned to a buy signal Monday with a double top break at $49. Monday's move adds to an already positive technical for AU as the stock is a 5 for 5'er and ranks second out of 23 names in the precious metals sector matrix. From here, overhead resistance sits at $51, AU's all-time high. Meanwhile, support can be found at $44. Earnings are expected on 8/1. |
| EXE Expand Energy Corp ($99.41) - Oil - EXPE fell more than 8% on Monday, giving a second consecutive sell signal and violating the trend line on its default chart. The negative trend change will drop EXPE to a still favorable 4 for 5'er. The stock now sits at $99, with the next level of support afforded at $96. EXPE is expected to report earnings on 7/29. |
| LNG Cheniere Energy, Inc. ($226.44) - Oil Service - LNG fell more than 7% on Monday and gave an initial sell signal when it broke a double bottom at $228, where it now sits against support. The weight of the evidence remains positive as LNG is a 5 for 5'er that ranks in the top half of the oil service sector matrix. LNG is expected to report earnings on 8/7. |
| URBN Urban Outfitters, Inc. ($75.20) - Retailing - URBN broke a double top at $74 for a second buy signal as shares rallied to $75, matching the all-time chart high. The stock is a 5 for 5'er that ranks 8th (out of 90) in the Retailing sector matrix. Okay to consider here on the breakout or on a pullback to the lower $70s. Initial support lies at $69, while additional can be found at $66 and $61, the bullish support line. |

| Name | Option Symbol | Action | Stop Loss |
|---|---|---|---|
| Dell Technologies Inc Class C - $129.41 | O: 25I130.00D19 | Buy the September 130.00 calls at 9.05 | 120.00 |
| Name | Option | Action |
|---|---|---|
| Tapestry Inc. ( TPR) | Aug. 82.50 Calls | Raise the option stop loss to 22.60 (CP: 24.60) |
| eBay Inc. ( EBAY) | Sep. 72.50 Calls | Raise the option stop loss to 6.00 (CP: 8.00) |
| Apple Inc. ( AAPL) | Oct. 210.00 Calls | Initiate an option stop loss of 11.25 (CP: 13.25) |
| Howmet Aerospace Inc. ( HWM) | Sep. 185.00 Calls | Stopped at 13.30 (CP: 13.30) |
| Name | Option Symbol | Action | Stop Loss |
|---|---|---|---|
| Novo Nordisk A/S (Denmark) ADR - $64.92 | O: 25U65.00D19 | Buy the September 65.00 puts at 4.55 | 72.00 |
| Name | Option | Action |
|---|---|---|
| BHP Group Ltd. ( BHP) | Aug. 47.50 Puts | Stopped at 53.00 (CP: 53.29) |
| NextEra Energy, Inc. ( NEE) | Aug. 72.50 Puts | Stopped at 77.00 (CP: 76.22) |
| DocuSign, Inc. ( DOCU) | Sep. 75.00 Puts | Stopped at 80.00 (CP: 79.12) |
| Carmax Group ( KMX) | Sep. 65.00 Puts | Initiate an option stop loss of 2.90 (CP: 4.90) |
| Name | Option Sym. | Call to Sell | Call Price | Investment for 500 Shares | Annual Called Rtn. | Annual Static Rtn. | Downside Protection |
|---|---|---|---|---|---|---|---|
| United Airlines Holdings Inc. $ 92.25 | O: 25I95.00D19 | Sep. 95.00 | 5.30 | $ 44,139.50 | 39.93% | 29.78% | 4.67% |
| Name | Action |
|---|---|
| Hims & Hers Health Inc. ( HIMS) - 50.38 | Sell the September 55.00 Calls. |
| Fortinet Inc. ( FTNT) - 105.42 | Sell the September 105.00 Calls. |
| IonQ Inc. ( IONQ) - 46.51 | Sell the October 42.00 Calls. |
| MARA Holdings Inc. ( MARA) - 19.51 | Sell the December 18.00 Calls. |
| Norwegian Cruise Line Holdings Ltd. ( NCLH) - 23.59 | Sell the December 22.00 Calls. |
| Palantir Technologies Inc. Class A ( PLTR) - 153.52 | Sell the August 145.00 Calls. |
| Airbnb, Inc. Class A ( ABNB) - 139.34 | Sell the September 140.00 Calls. |
| Arista Networks Inc ( ANET) - 111.78 | Sell the September 110.00 Calls. |
| Expedia Group Inc. ( EXPE) - 184.93 | Sell the August 185.00 Calls. |
| Dollar General Corp. ( DG) - 110.09 | Sell the September 110.00 Calls. |
| Name | Covered Write |
|---|---|
|
|
|
Daily Equity & Market Analysis
Loading, Please Wait...
