Semiconductors surge higher while software names begin to dim.
The technology sector has seen increasing momentum over the last few months but is showing some notable technical divergences underneath the hood. The broad S&P technology sector has improved the most out of the 11 broad S&P sectors over just about any near-term timeframe, including the trailing week (+2.75%), trailing month (+10%), and trailing three months (+41%), through Monday. This improvement has largely been because of semiconductors. NVIDIA (NVDA) has famously gained more than 75% from its recent low on April 7, becoming the first company to cross over the $4 trillion market cap threshold. However, many other semiconductor companies have seen remarkable near-term improvement. This led the Ten Week for Semiconductors (^TWSEMI) to reach 96% at the beginning of the month, its highest reading since early 2021. That means that 96% of semiconductor stocks were trading above their 10-week, or 50-day, moving average. We use the 10-week indicators as a near-term participation reading. Extremely high levels like that point toward a thrust of positive momentum for the underlying universe, which is a positive sign in the intermediate term.
On the other hand, the software subsector has not shown the same level of improvement. The Ten Week for Software (^TWSOFT) topped out at 72% on May 12 and has been unable to push higher. It ultimately moved back below the 50% mark on July 11. That move led to a historic spread in near-term participation readings between the ^TWSEMI and ^TWSOFT indicators, moving north of 46% on July 11 to notch the second highest spread since our data began in 1996. Other high spread periods include the summer of 1999, September 2019, December 2021, and November 2022.

These participation readings move around a lot. This makes sense when considering their near-term focus; the quick-moving nature of 10-week charts is only going to make the spread change more frequently. This admittedly creates a very noisy graph. The only important thing to understand from the graph is that it is rare to see such a massive divergence in underlying participation from the two largest technology subsectors.
With that said, it is normal for software stocks to trail semiconductors. We have seen 40 other instances where ^TWSEMI pushed above 80% since 1996. Only one of those instances saw ^TWSOFT move above 80% before semiconductors (2/19/2019). Only 13 of the remaining 39 instances saw ^TWSOFT eventually move above 80% before it fell below 50%. So, when semiconductors show strong near-term breadth, software stocks only show similar follow-through just over one-third of the time. That number is even lower if we just look over the past 10 years, with only three out of 22 instances.
It makes sense conceptually for the performance of software stocks to trail semiconductors with the supply chain of technological innovation. Advancing technology generally carries the need for more computing power. Semiconductor companies then need to build more efficient chips. Software companies need to pay up to get the latest chips, pushing share prices of the semiconductors higher. Eventually, the implementation of the technological innovation should carry over to share price appreciation for software stocks. That inherently takes more time to come to fruition, if it ever does.
Software stocks have had an especially tough time catching up to semiconductor stocks over the past decade. The iShares North American Tech-Software ETF (IGV) is trailing the VanEck Semiconductor ETF (SMH) by over 8% a year over the past 10 years. Both funds have handily beat the S&P 500 Index (SPX) over that timeframe, but semi’s have been the clear winner, especially over the last few years.
The magnitude of outperformance from semiconductors also shows no signs of stopping. Of course, that could change with one headline or social media post, but the elevated near-term breadth readings like ^TWSEMI means more names are showing technical improvement. This could open the door for sustained outperformance from a broader representative like the SPDR S&P Semiconductor ETF (XSD). This fund uses a modified equal-weight approach to provide more diverse exposure to the subsector, with no stocks showing more than a 4% weighting as of June 30.
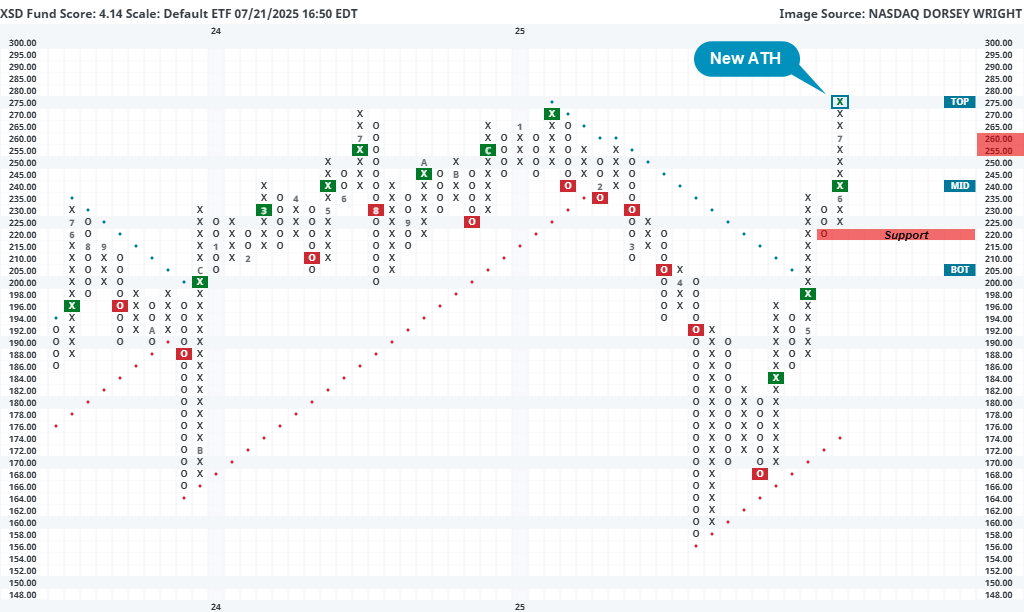
XSD carries a robust 4.14 fund score, sitting on three consecutive buy signals after moving back to a positive trend in May. Monday’s market action led XSD to notch a new all-time high at $275, pushing through overhead resistance from January and last July. Monthly momentum also recently flipped positive, suggesting the potential for further upside from here. While the technical picture is strong, XSD is in an overbought position. Initial support can be seen on the default chart at $220 with potential near-term support seen on the more sensitive 2-pt chart around $258.
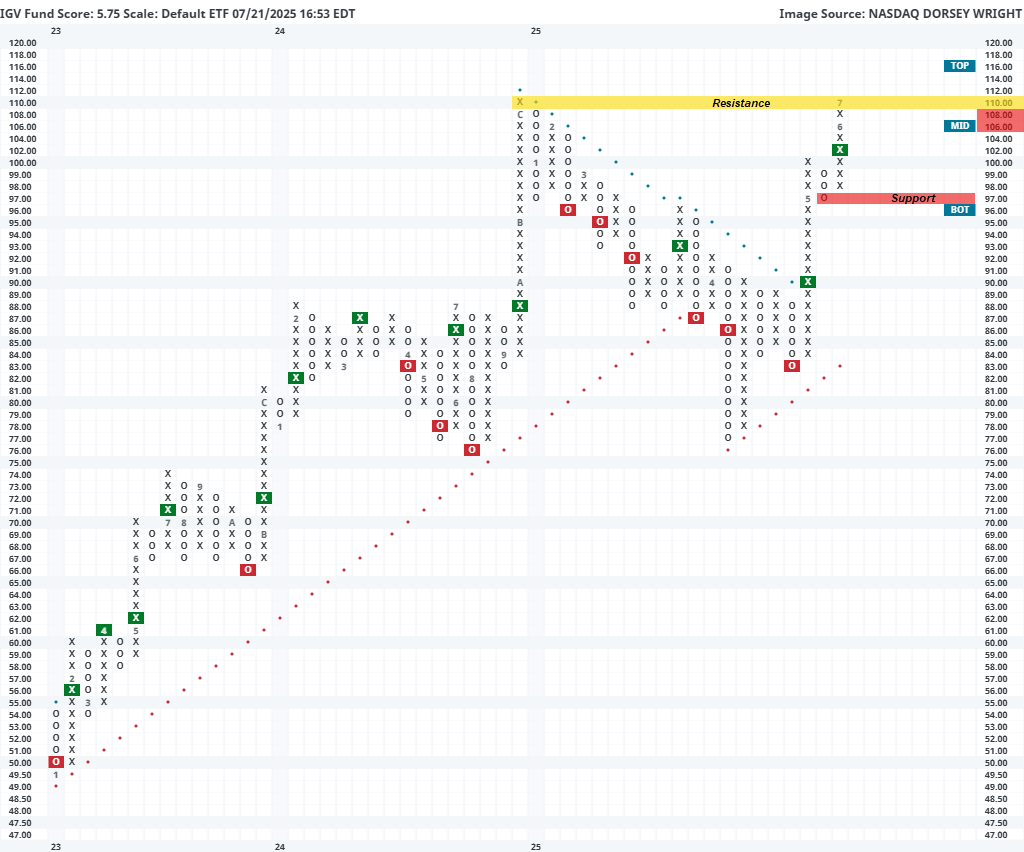
There are still some strong software names out there even though the broader space is showing declining breadth. Such a scenario makes it important to focus exposure on stocks that have demonstrated more resilience, which points toward the larger names. The iShares North American Tech-Software ETF (IGV) provides cap-weighted exposure to the broader software space and carries a near-perfect 5.75 fund score. The fund sits on two consecutive buy signals but is currently matching all-time highs from December at $110. Movement to $112 would produce a new all-time chart high. IGV is also more actionable at current levels. Initial support can be seen at $97 on the default chart or on the more sensitive 1-point chart at $108 and $102.