Using a relative strength matrix can help determine points of long-term strength, but it can also play a part in finding moves before they occur...
Absolute improvement is important. After all, understanding if assets could move up or down is the first step of any sound investment process. After that, understanding relative performance is key. Knowing a given stock will move up 5% would be nice, but if your benchmark is up 10% over the same timeframe, you have underperformed. The same is true towards the downside. All this to say, relative price is important, and lies at the heart of much of Dorsey Wright analysis.
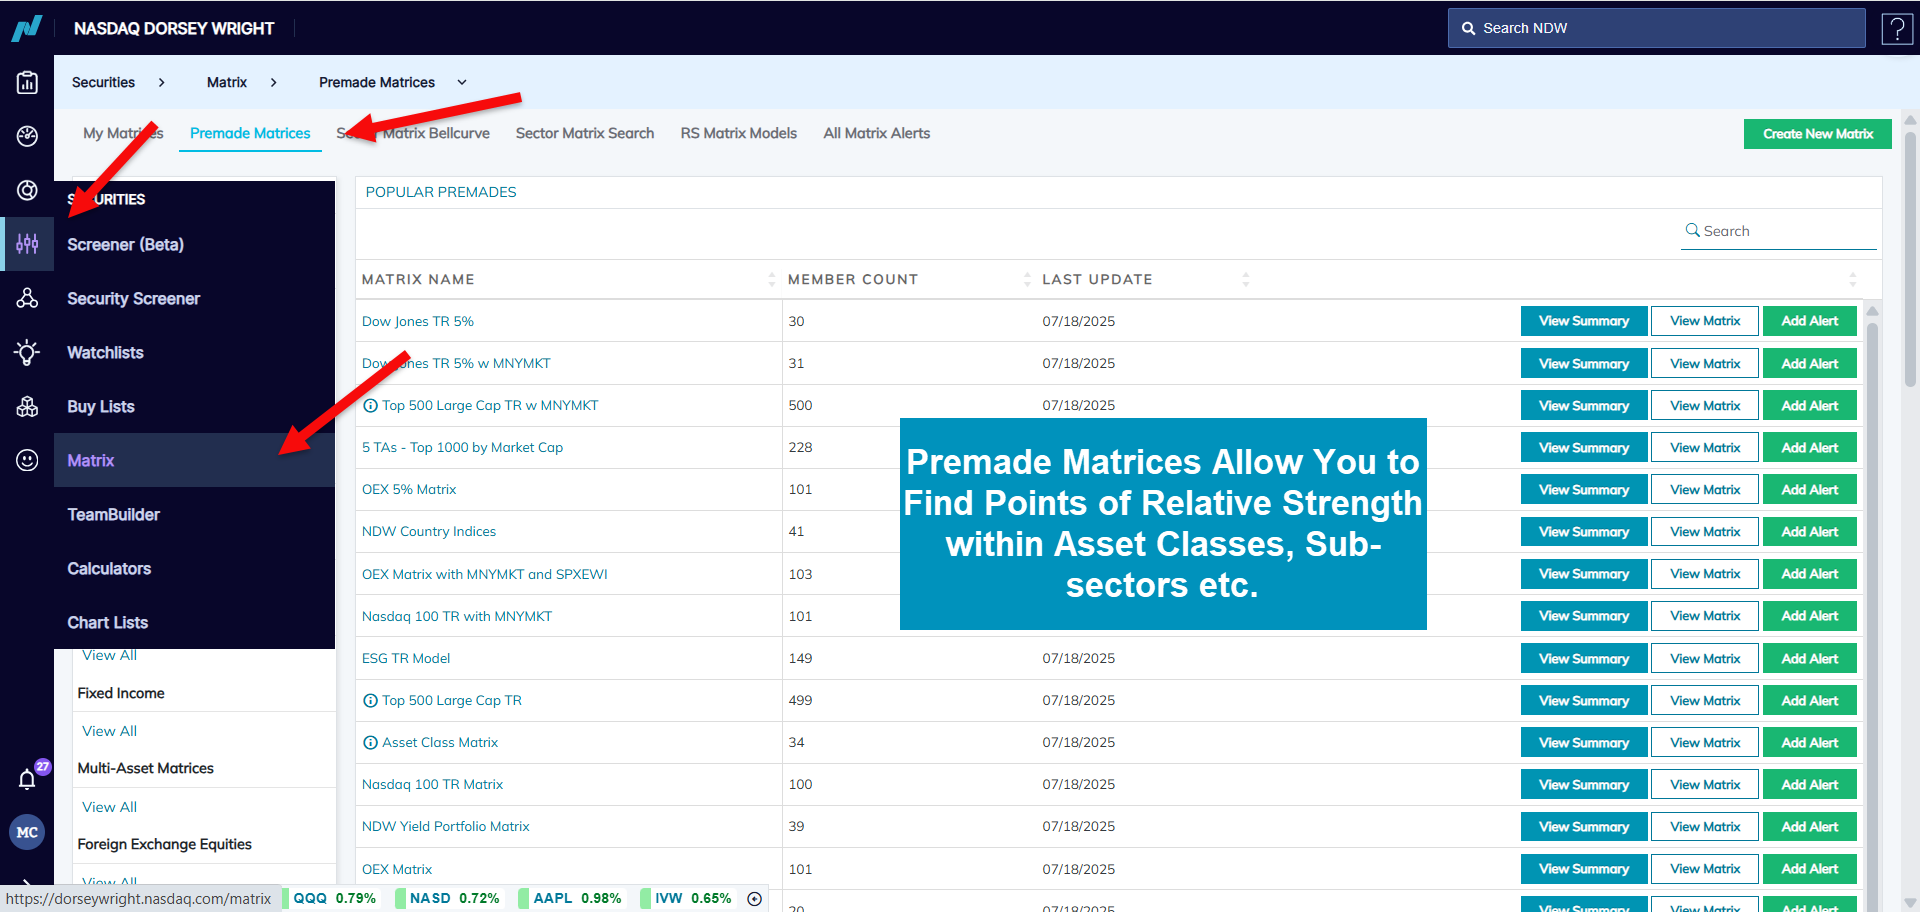
To dive deeper into relative strength, Dorsey Wright utilizes the matrix tool. For those of you familiar with the matrix, feel free to skip ahead in the piece. For those that aren’t, the matrix system pins the constituents within a given universe against one another. From there, each member of the universe is then ranked on how many long-term buy signals each earns, with more buy signals suggesting an asset is a “relative leader” amongst its peers. The opposite is true with those members earning few signals a point of relative weakness. One can overlay this methodology onto any universe, spanning from major indices to matrices with representatives across asset classes. One final point to open the rest of the piece: rankings are built on buy signals but the matrix rankings also provide the total X count, which details a more near-term picture of an asset’s strength.
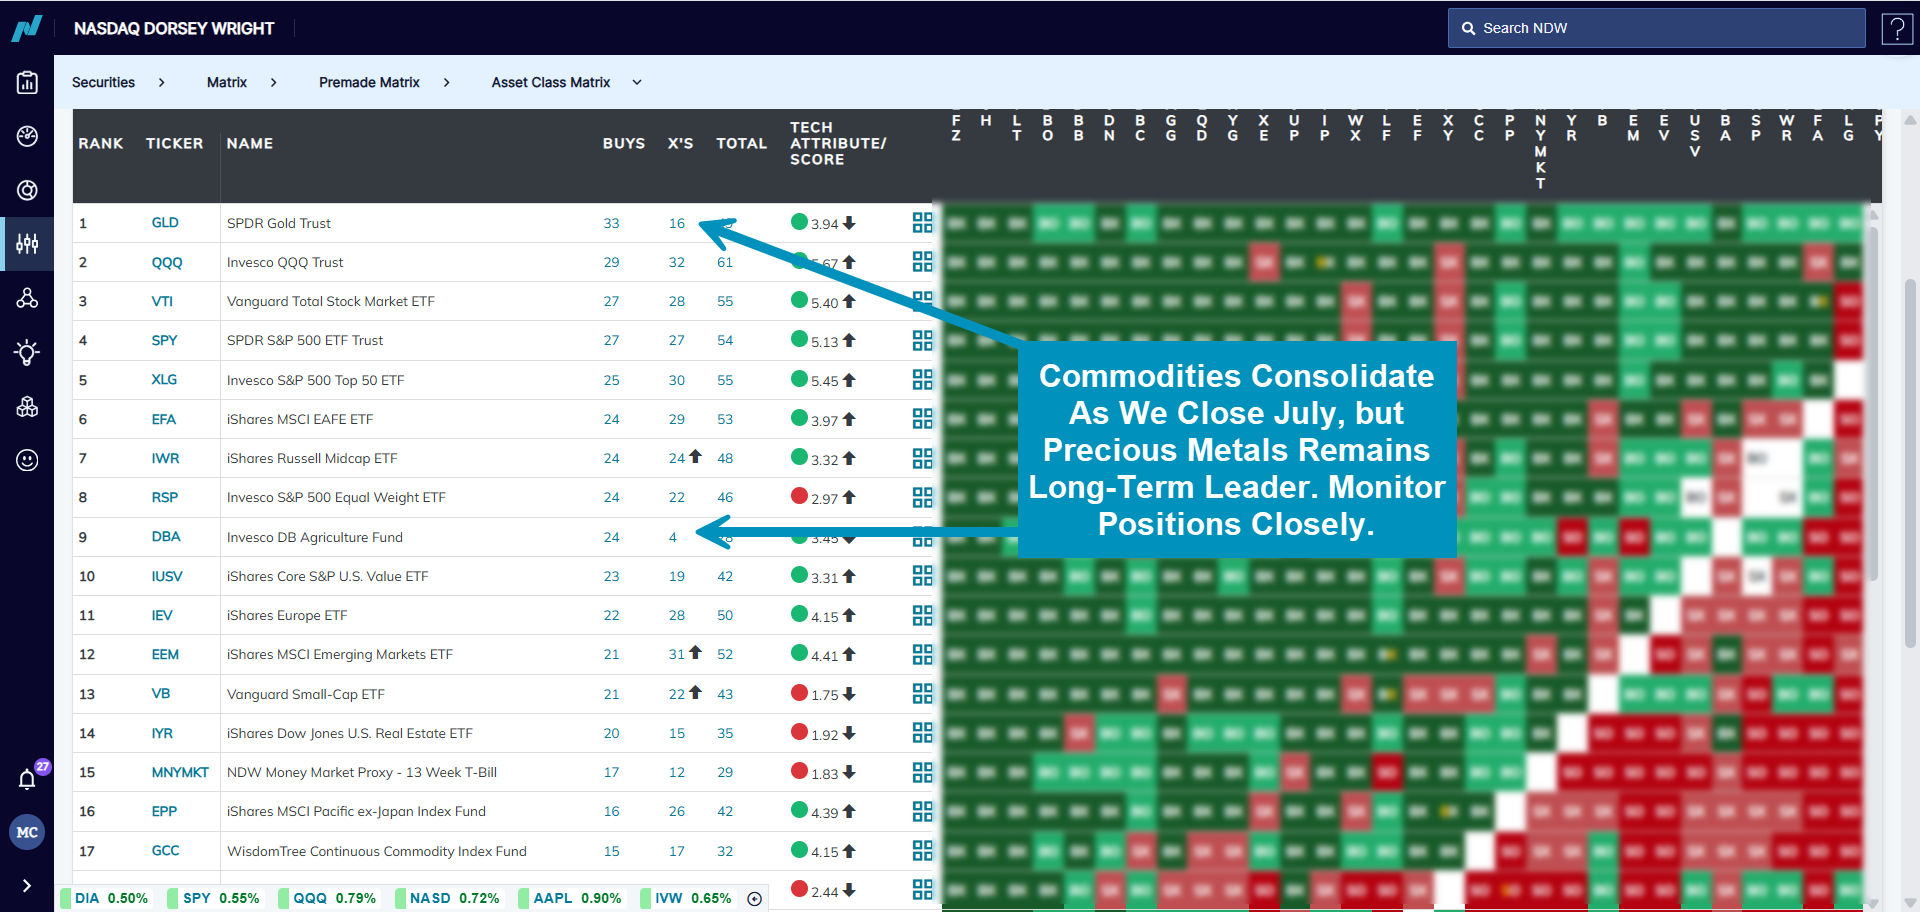
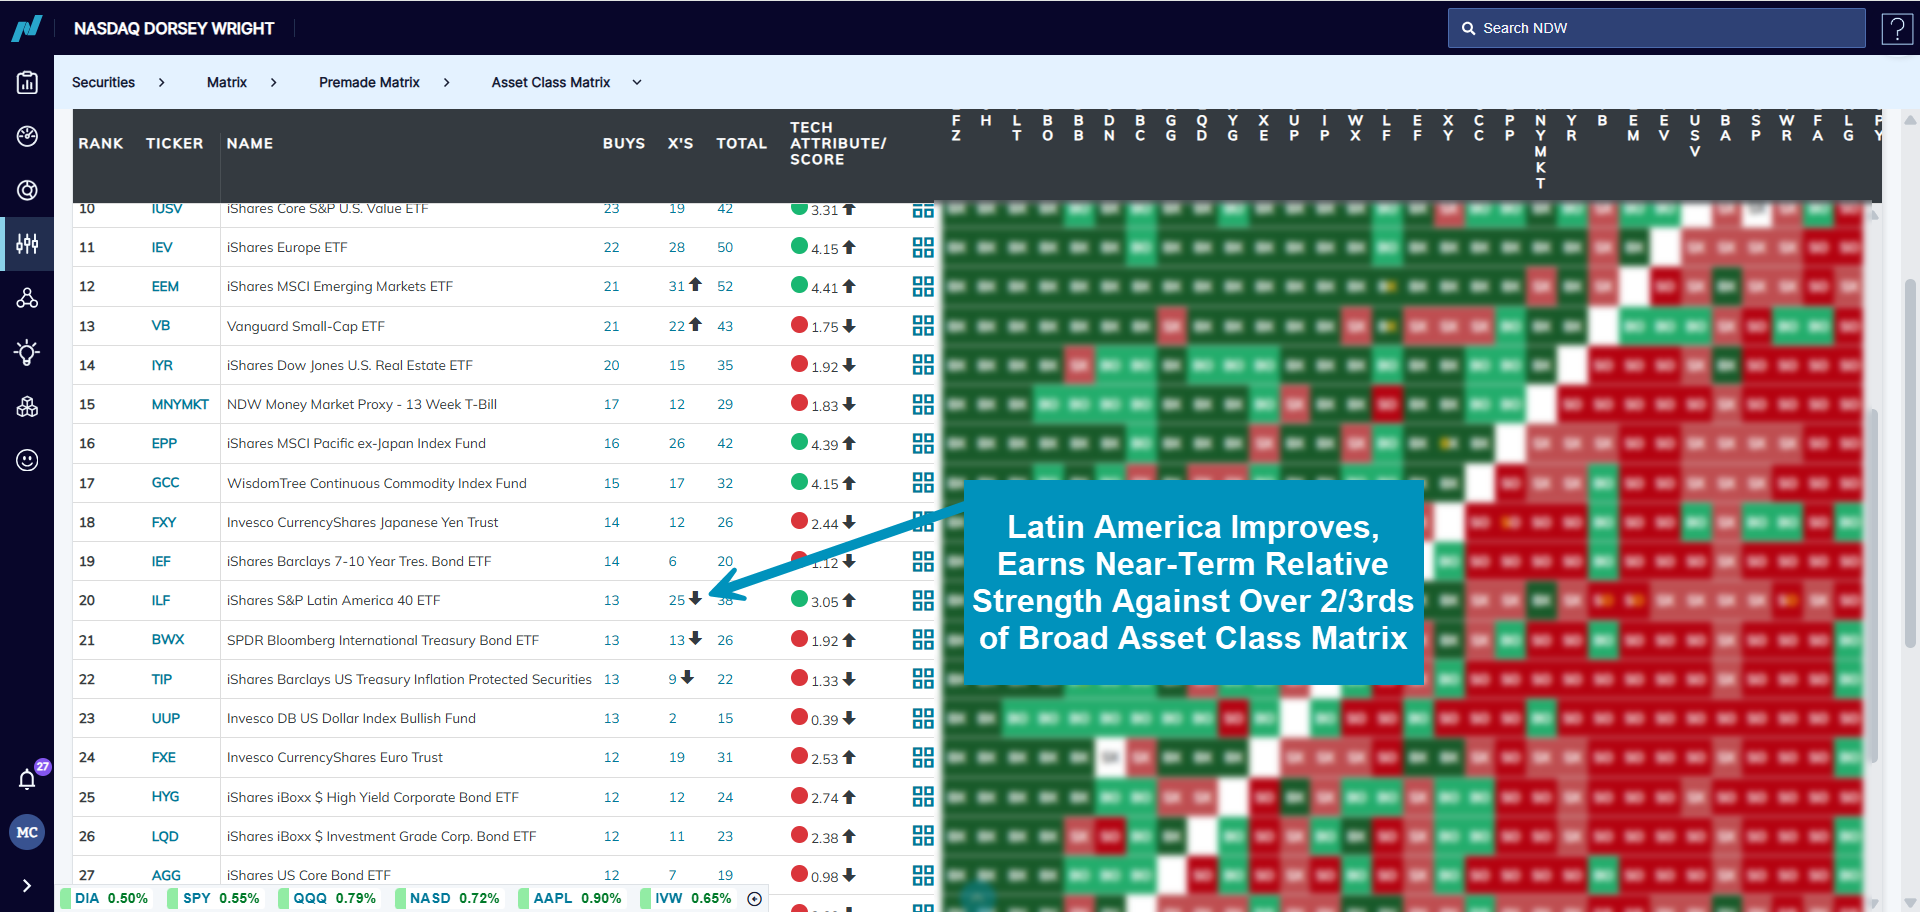
Today, we will focus on the asset class matrix, which uses a set of 34 different funds across each of the broad asset classes detailed in NDW’s DALI rankings. Strength remains largely focused on those areas recent research has focused heavily on. Precious metals, core domestic equities, broad internationals, all have their respective place in the top third (strongest) of the matrix. Drifting down the page, points of weakness remain largely consistent as well- seeing fixed income and currency groups earning the least amount of long-term strength as of 7/21. What is of interest for today’s report will be those areas in the “extremes” of the matrix based on long-term buy signals but with a differing view based on their near-term X count. For example, Latin America representative ILF ranks in the bottom half of the matrix based on a traditional buy signal count but sits in a column of X’s against 25 other members (9th highest.) The fund also holds a now technically acceptable 3.05 fund score. While those more defensive clients should tread lightly as the group is still far from a technical leader, those looking to broaden out their international exposure may keep some Latin America names on the back burner as it appears the space (and emerging markets in general) are catching up to their developed market counterparts.
On the opposite side of things, we can journey back towards the top of the matrix again. While leadership trends remain largely consistent, there are some points within commodities that look to be shedding some relative strength as we move towards the end of July. Gold representative GLD remains on a buy signal against all other members of the matrix but in a column of X’s against half the universe. Agriculture fund DBA earns 24 buy signals but sits in a column of X’s against just four names within the matrix. This comes at a point where it looks as if commodities seem to be losing ground in the broad DALI rankings, falling now nine signals behind second-ranked International Equities. While still close in signal count, this recent consolidation from areas within precious metals remains a focal point for the group from a relative perspective. If you have exposure, continue to monitor as further consolidation could lead to negative relative strength and warrant a decrease in allocation in your portfolio.