Most Requested Symbols

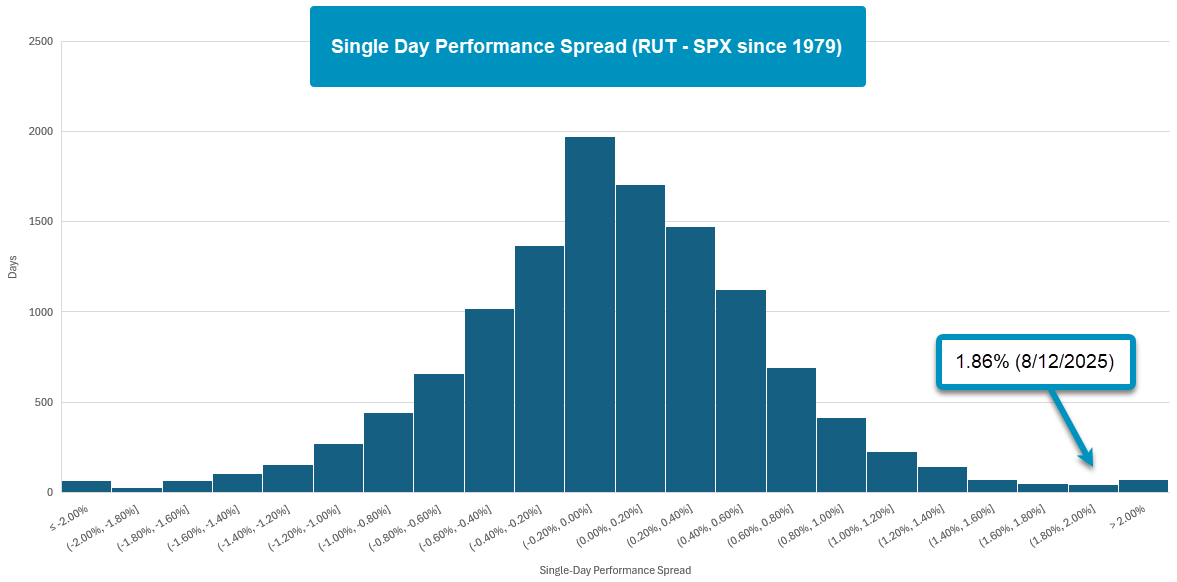
The Russell 2000 Index (RUT) outperformed the S&P 500 Index (SPX) by almost 2% Tuesday (8/12).
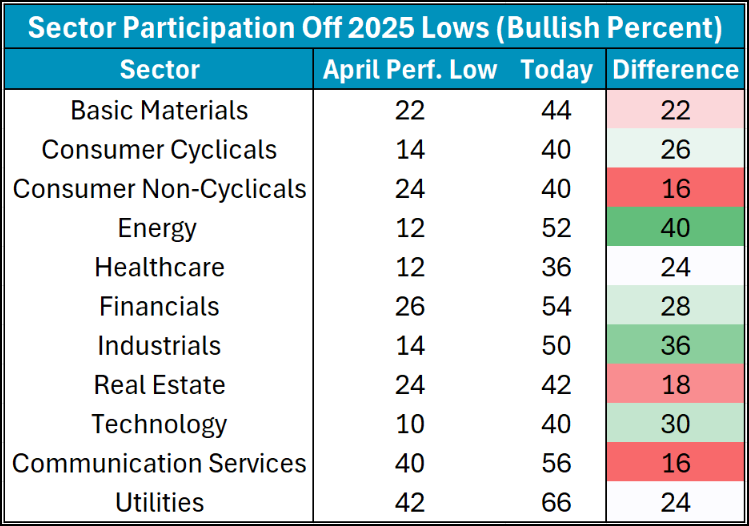
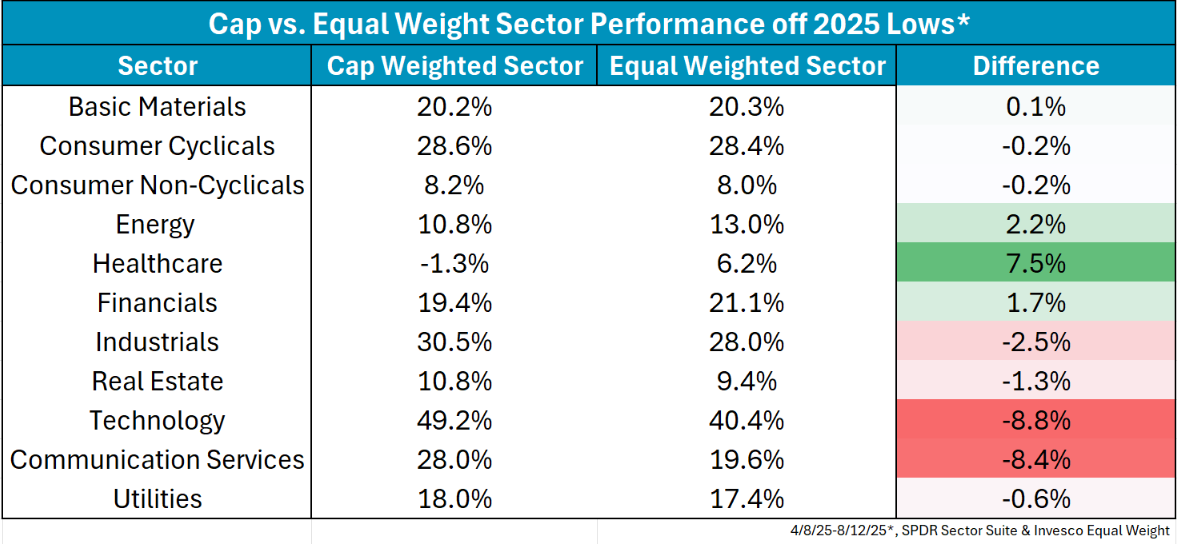
Now over four months away from 2025 lows, we judge how different sectors have moved off 2025 lows and where leadership could be emerging
NDW Morning Update Video - August 14, 2025
NDW Morning Update Video – August 14, 2025.
Click here to download MP3
Small caps shot higher yesterday as the Russell 2000 Index (IWM) gained almost 3% outpacing the S&P 500 Index (SPX) on the day by 1.86%. The single day outperformance by RUT over SPX ranks in the 99th percentile with data going back to 1979. Another way to frame it is that less than 1% of trading days saw RUT outperform SPX by at least 1.86%. Despite the notable single-day performance by RUT, its proxy the iShares Russell 2000 ETF (IWM) maintains a fund score below the acceptable 3.0 threshold which has been the case since February of this year. IWM also shows little sign of improving against large caps as it’s been on a sell signal versus the S&P 500 Equal Weight Index (SPXEWI) since January 2022 and a column of Os since April 2021. However, IWM is 4.16% away from reversing into a column of Xs against SPXEWI which is something to watch out for through the rest of the year following such a strong single-day performance from small caps.
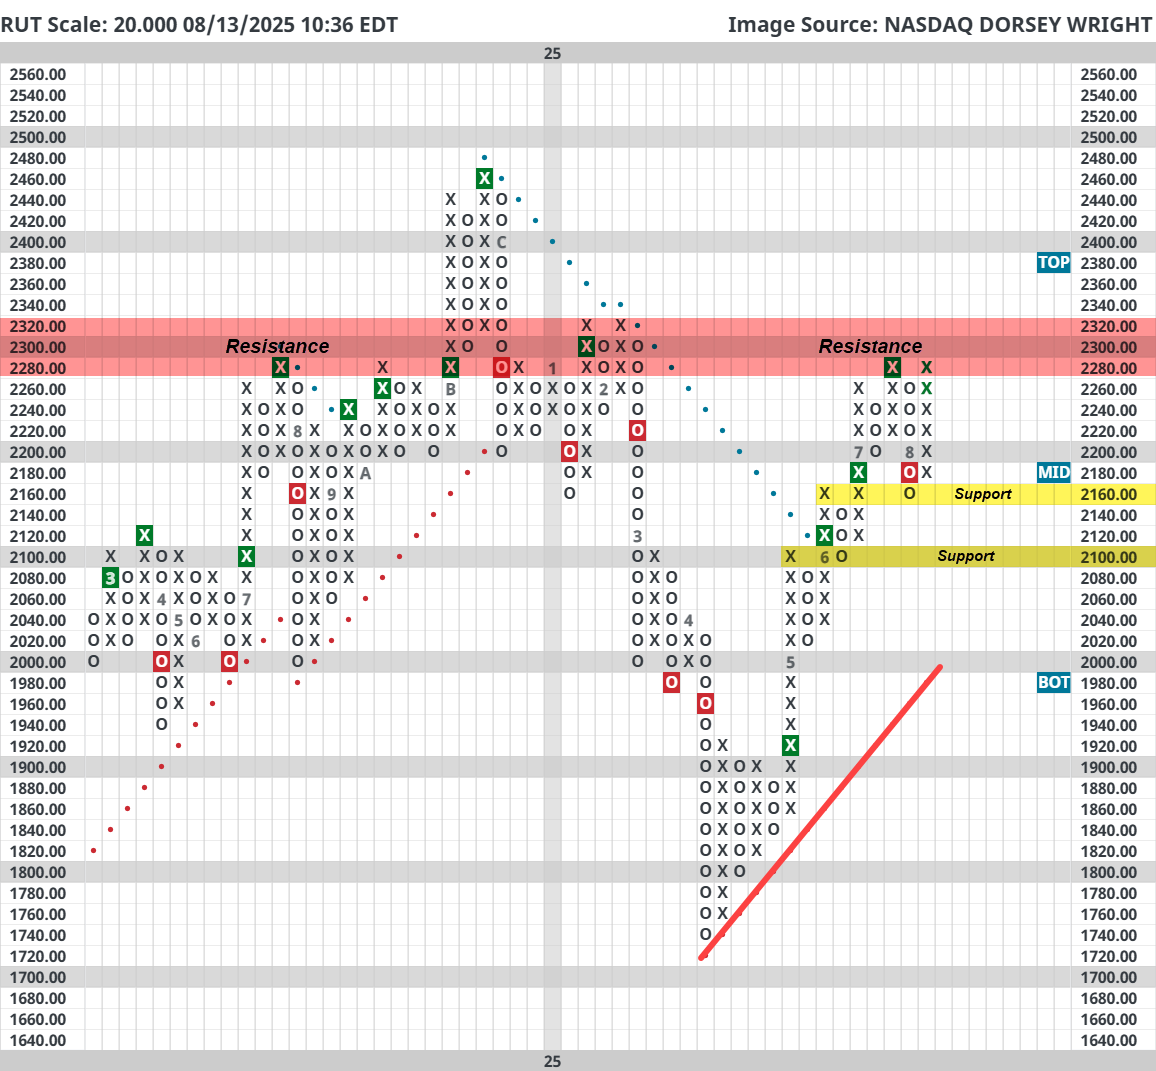
Getting back to the index itself, RUT is one box away from returning to a buy signal on its 20-point chart after giving a sell signal earlier in August. The small cap index trades in a positive trend but is near an area of heavy resistance around 2300. If 2320 can be taken out, there is little in the way of RUT returning to 2024 highs around 2450. It’s still unclear if overcoming nearby resistance will lead to RUT gaining near-term relative strength with a reversal into Xs on its relative strength chart vs SPXEWI. The weight of the evidence still strongly suggests staying away from small caps generally in favor of large cap exposure. Despite multiple years of lackluster relative strength, it’s important to monitor the possibility of changes in the future and to have a game plan if those changes do take place. For now, there is nothing actionable until small caps can prove their worth through consistent outperformance against other major market benchmarks.

While it is true that sector leadership has remained largely consistent in 2025, it can be important to keep an eye on the health of said leadership from time to time. After all, price will guide us to sectors that are moving in and out of favor, just like your tastebuds draw you to bright red strawberries in the summer and crisp apples in the winter. Recent research has touched quite notably on the “pulse” of market participation as larger names within the market look to have tightened their grip around upside action, so we will take today’s featured article to further that conversation; diving underneath the hood to judge sector participation as we move through August.
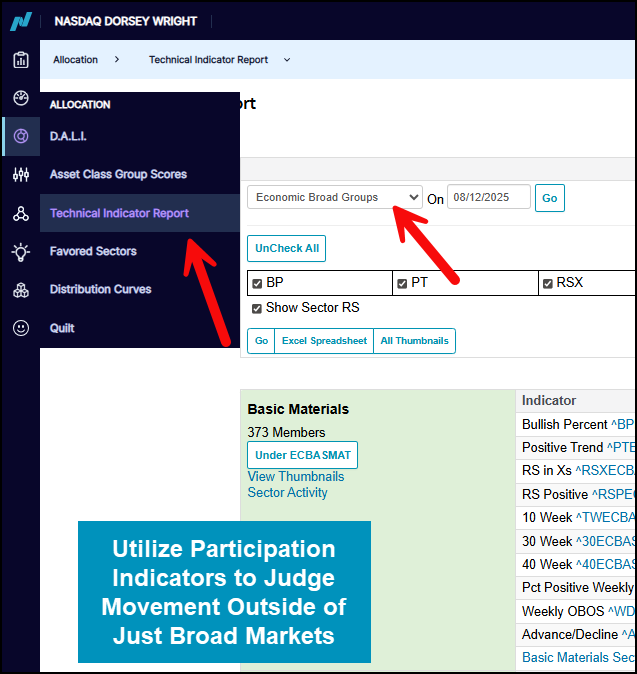
As discussed here, lower participation doesn’t always equal lower performance…. But it can be used as a guiding hand when it comes to where you want to be invested. A strong sector with strong participation suggests an advisor may be able to “throw a dart” at a list of actionable names. On the other hand, a strong sector with weak participation warrants further analysis into a more narrow environment, just like how you might inspect your berry container a bit more thoroughly in December than you would in June or July. The Technical Indicator Report page is the home base for participation studies across different universes.
The chart below details the overall change in bullish percent readings (percentage of the universe trading on a PnF buy signal) since the 2025 performance lows on 4/8. Do note that this date won’t necessarily line up exactly with each respective sector's participation low, but does offer an equal starting point for comparison sake. A few interesting points of note:
Continuing on, we can then look at overall relative performance between each sector’s respective cap weighted fund vs. that of their equal weighted fund over the same timeframe (4/8/25-8/12/25). Themes here are largely as you would expect (cap weighted options are outperforming their equal-weighted counterparts) but there are a few points of note.
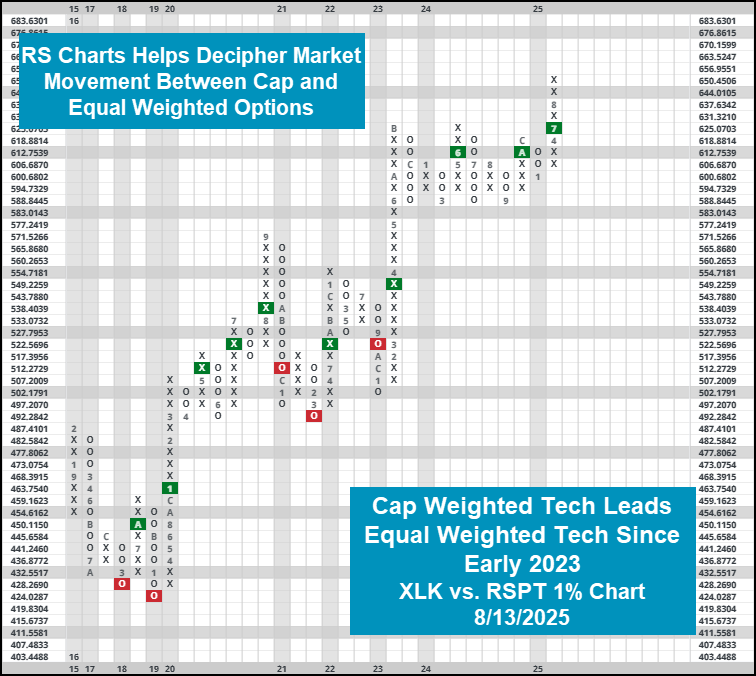
Remember, you can also use individual relative strength charts to judge the representatives against each other. While the exact ideal scale will differ from sector to sector, the chart below details a 1% chart between tech representatives XLK & RSPT. After a largely unproductive sell signal in late 2022, this chart has favored XLK since 3/17/2023. Since that point, XLK has bested RSPT by just under 30%. While this is admittedly a cherrypicked example, keeping tabs on who is leading the charge forwards within a given sector can help fill out the overall picture within your portfolio.
Each week the analysts at NDW review and comment on all major asset classes in the global markets. Shown below is the summary or snapshot of the primary technical indicators we follow for multiple areas. Should there be changes mid-week we will certainly bring these to your attention via the report.
| Universe | BP Col & Level (actual) | BP Rev Level | PT Col & Level (actual) | PT Rev Level | HiLo Col & Level (actual) | HiLo Rev Level | 10 Week Col & Level (actual) | 10 Week Rev Level | 30 Week Col & Level (actual) | 30 Week Rev Level |
|---|---|---|---|---|---|---|---|---|---|---|
| ALL |
|
42% |
|
34% |
|
62% |
|
46% |
|
46% |
| NYSE |
|
58% |
|
48% |
|
68% |
|
52% |
|
52% |
| OTC |
|
46% |
|
30% |
|
58% |
|
44% |
|
44% |
| World |
|
44% |
|
38% |
|
|
|
54% |
|
54% |

Remember, these are technical comments only. Just as you must be aware of fundamental data for the stocks we recommend based on technical criteria in the report, so too must you be aware of important data regarding delivery, market moving government releases, and other factors that may influence commodity pricing. We try to limit our technical comments to the most actively traded contracts in advance of delivery, but some contracts trade actively right up to delivery while others taper off well in advance. Be sure you check your dates before trading these contracts. For questions regarding this section or additional coverage of commodities email james.west@nasdaq.com.
Data represented in the table below is through 08/12/2025:
Broad Market Commodities Report
| Symbol | Name | Price | PnF Trend | RS Signal | RS Col. | 200 Day MA | Weekly Mom |
|---|---|---|---|---|---|---|---|
| CL/ | Crude Oil Continuous | 63.17 | Negative | Sell | O | 67.81 | - 5W |
| DBLCIX | Deutsche Bank Liquid Commodities Index | 468.52 | Positive | Sell | O | 460.74 | - 5W |
| DWACOMMOD | NDW Continuous Commodity Index | 977.15 | Positive | Buy | O | 951.10 | - 5W |
| GC/ | Gold Continuous | 3348.90 | Positive | Buy | X | 3020.03 | - 1W |
| HG/ | Copper Continuous | 4.51 | Negative | Buy | O | 4.61 | - 3W |
| ZG/ | Corn (Electronic Day Session) Continuous | 371.50 | Negative | Sell | O | 445.51 | - 15W |
Average Level
33.73
| < - -100 | -100 - -80 | -80 - -60 | -60 - -40 | -40 - -20 | -20 - 0 | 0 - 20 | 20 - 40 | 40 - 60 | 60 - 80 | 80 - 100 | 100 - > |
|---|---|---|---|---|---|---|---|---|---|---|---|
|
Buy signalrsp
|
|||||||||||
|
Buy signalief
|
Buy signalefa
|
||||||||||
|
Buy signalshy
|
Buy signalijr
|
||||||||||
|
Buy signaldia
|
Sell signaldvy
|
Buy signalQQQ
|
|||||||||
|
Sell signaltlt
|
Buy signalIJH
|
Buy signallqd
|
Buy signalVOOG
|
||||||||
|
Sell signalUSO
|
Sell signalGLD
|
Buy signalgcc
|
Buy signalhyg
|
Buy signaliwm
|
Buy signaleem
|
Buy signalONEQ
|
|||||
|
Sell signalicf
|
Buy signalgsg
|
Sell signaldx/y
|
Buy signalfxe
|
Buy signalagg
|
Buy signalVOOV
|
Buy signalSPY
|
Buy signalXLG
|
||||
| < - -100 | -100 - -80 | -80 - -60 | -60 - -40 | -40 - -20 | -20 - 0 | 0 - 20 | 20 - 40 | 40 - 60 | 60 - 80 | 80 - 100 | 100 - > |
| AGG | iShares US Core Bond ETF |
| USO | United States Oil Fund |
| DIA | SPDR Dow Jones Industrial Average ETF |
| DVY | iShares Dow Jones Select Dividend Index ETF |
| DX/Y | NYCE U.S.Dollar Index Spot |
| EFA | iShares MSCI EAFE ETF |
| FXE | Invesco CurrencyShares Euro Trust |
| GLD | SPDR Gold Trust |
| GSG | iShares S&P GSCI Commodity-Indexed Trust |
| HYG | iShares iBoxx $ High Yield Corporate Bond ETF |
| ICF | iShares Cohen & Steers Realty ETF |
| IEF | iShares Barclays 7-10 Yr. Tres. Bond ETF |
| LQD | iShares iBoxx $ Investment Grade Corp. Bond ETF |
| IJH | iShares S&P 400 MidCap Index Fund |
| ONEQ | Fidelity Nasdaq Composite Index Track |
| QQQ | Invesco QQQ Trust |
| RSP | Invesco S&P 500 Equal Weight ETF |
| IWM | iShares Russell 2000 Index ETF |
| SHY | iShares Barclays 1-3 Year Tres. Bond ETF |
| IJR | iShares S&P 600 SmallCap Index Fund |
| SPY | SPDR S&P 500 Index ETF Trust |
| TLT | iShares Barclays 20+ Year Treasury Bond ETF |
| GCC | WisdomTree Continuous Commodity Index Fund |
| VOOG | Vanguard S&P 500 Growth ETF |
| VOOV | Vanguard S&P 500 Value ETF |
| EEM | iShares MSCI Emerging Markets ETF |
| XLG | Invesco S&P 500 Top 50 ETF |

| Symbol | Company | Sector | Current Price | Action Price | Target | Stop | Notes |
|---|---|---|---|---|---|---|---|
| OLLI | Ollies Bargain Outlet Holding Inc. | Retailing | $132.91 | 120s | 150 | 102 | 5 for 5'er, top 25% of favored RETA sector matrix, LT pos mkt RS, buy on pullback, Earn. 8/28 |
| DRI | Darden Restaurants, Inc. | Restaurants | $205.13 | hi 190s - mid 210s | 262 | 178 | 5 TA rating, top 50% of REST sector matrix, LT RS buy, consec buy signals, buy-on-pullback |
| DG | Dollar General Corp. | Retailing | $115.19 | 100s to mid 110s | 133 | 86 | 4 TA rating, top 33% of RETA sector matrix, LT peer RS buy, consec buy signals, buy-on-pullback, Earn. 8/28 |
| BSX | Boston Scientific Corporation | Healthcare | $102.64 | 99 - 108 | 133 | 91 | 5 for 5'er, top 25% of HEAL sector matrix, LT pos mkt RS, spread triple top |
| TSCO | Tractor Supply Company | Retailing | $59.30 | upper 50s | 66 | 50 | 3 for 5'er, top half of favored RETA sector matrix, LT pos mkt RS, buy on pullback |
| HLT | Hilton Worldwide Holdings Inc | Leisure | $268.77 | 260s - low 280s | 364 | 216 | 5 TA rating, top 50% of LEIS sector matrix, LT RS buy, LT pos trend, consec buy signals, buy on pullback. |
| RPM | RPM, Inc. | Chemicals | $121.83 | 110 - 120 | 150 | 99 | 5 for 5'er, top half of favored CHEM sector matrix, LT pos mkt RS, bullish catapult, pos trend flip, 1.7% yield |
| VEEV | Veeva Systems Inc. | Healthcare | $275.43 | 274-lo 300s | 348 | 232 | 5 TA rating, top 10% of HEAL sector matrix, recent shakeout, buy-on-pullback, Earn. 8/27 |
| AMZN | Amazon.com Inc. | Retailing | $221.47 | 200s - low 210s | 240 | 178 | 4 for 5'er, top half of favored RETA sector matrix, LT pos peer & mkt RS, buy on pullback |
| SCHW | The Charles Schwab Corporation | Wall Street | $98.69 | lo-hi 90s | 120 | 76 | 5 TA rating, top 20% of WALL sector matrix, LT peer RS buy, consec buy signals, buy-on-pullback |
| WING | Wingstop Inc. | Restaurants | $342.16 | 320s - 340s | 432 | 280 | 5 for 5'er, #3 of 28 in REST sector matrix, LT pos mkt RS, buy on pullback |
| AXP | American Express Company | Finance | $303.21 | 288-lo 310s | 424 | 236 | 5 TA rating, top 20% of FINA sector matrix, LT RS buy, LT pos trend, consec buy signals, buy on pullback |
| PEG | Public Service Enterprise Group Inc. | Utilities/Electricity | $87.83 | mid 80s | 95 | 74 | 3 for 5'er, favored EUTI sector, spread quintuple top, buy on pullback, 2.9% yield |
| ABBV | AbbVie Inc. | Drugs | $198.64 | 190s - low 200s | 226 | 164 | 5 for 5'er, top third of DRUG sector matrix, LT pos peer & mkt RS, spread triple top, 3.3% yield |
| MS | Morgan Stanley | Wall Street | $147.29 | 140s - lo 150s | 186 | 122 | 5 TA rating, top 33% of WALL sector matrix, LT pos mkt RS, consec buy signals, recent breakout |
| PEGA | Pegasystems Inc | Software | $50.96 | low-to-mid 50s | 79 | 42 | 5 for 5'er, top 20% of favored SOFT sector matrix, buy on pullback, R-R>2.0 |
| Symbol | Company | Sector | Current Price | Action Price | Target | Stop | Notes |
|---|
| Comment | |||||||
|---|---|---|---|---|---|---|---|
|
|
|||||||
PEGA Pegasystems Inc R ($52.47) - Software - PEGA is a 5 for 5'er that ranks in the top quintile of the favored software sector matrix. On its default chart, PEGA has completed four consecutive buy signals and reached a new multi-year high last month. The stock has subsequently pulled back to support below the middle of its trading band, offering an entry point for long exposure. Positions may be added in the low-to-mid $50s and we will set our initial stop at $42, which would take out multiple levels of support on PEGA's default chart. We will use the bullish price objective, $79, as our target price, giving us a reward-to-risk ratio north of 2.0.
| 23 | 24 | 25 | |||||||||||||||||||||||||||
| 60.00 | X | 60.00 | |||||||||||||||||||||||||||
| 59.00 | X | O | 59.00 | ||||||||||||||||||||||||||
| 58.00 | X | O | 58.00 | ||||||||||||||||||||||||||
| 57.00 | X | 8 | 57.00 | ||||||||||||||||||||||||||
| 56.00 | X | X | O | 56.00 | |||||||||||||||||||||||||
| 55.00 | X | O | 7 | X | O | 55.00 | |||||||||||||||||||||||
| 54.00 | X | O | X | O | X | O | 54.00 | ||||||||||||||||||||||
| 53.00 | X | O | X | O | X | O | Mid | 53.00 | |||||||||||||||||||||
| 52.00 | X | 2 | X | X | O | X | O | 52.00 | |||||||||||||||||||||
| 51.00 | X | O | X | O | 6 | O | X | O | 51.00 | ||||||||||||||||||||
| 50.00 | X | O | X | O | X | O | O | 50.00 | |||||||||||||||||||||
| 49.00 | 1 | O | X | O | X | 49.00 | |||||||||||||||||||||||
| 48.00 | X | O | X | O | 48.00 | ||||||||||||||||||||||||
| 47.00 | X | O | 5 | 47.00 | |||||||||||||||||||||||||
| 46.00 | X | O | X | X | 46.00 | ||||||||||||||||||||||||
| 45.00 | X | O | X | O | X | 45.00 | |||||||||||||||||||||||
| 44.00 | X | O | X | O | X | 44.00 | |||||||||||||||||||||||
| 43.00 | X | O | X | O | 43.00 | ||||||||||||||||||||||||
| 42.00 | B | O | X | 42.00 | |||||||||||||||||||||||||
| 41.00 | X | O | X | Bot | 41.00 | ||||||||||||||||||||||||
| 40.00 | X | O | X | 40.00 | |||||||||||||||||||||||||
| 39.00 | X | O | X | 39.00 | |||||||||||||||||||||||||
| 38.00 | A | O | X | X | 38.00 | ||||||||||||||||||||||||
| 37.00 | X | 3 | X | O | X | • | 37.00 | ||||||||||||||||||||||
| 36.00 | X | 9 | O | X | O | X | • | 36.00 | |||||||||||||||||||||
| 35.00 | X | O | X | O | X | O | X | • | 35.00 | ||||||||||||||||||||
| 34.00 | X | X | O | X | O | O | X | • | 34.00 | ||||||||||||||||||||
| 33.00 | X | O | X | 8 | X | 4 | X | • | 33.00 | ||||||||||||||||||||
| 32.00 | X | O | 5 | X | O | O | X | • | 32.00 | ||||||||||||||||||||
| 31.00 | X | 3 | X | O | 7 | O | X | • | 31.00 | ||||||||||||||||||||
| 30.00 | • | X | 4 | X | O | X | O | • | 30.00 | ||||||||||||||||||||
| 29.00 | • | X | X | O | X | O | X | • | 29.00 | ||||||||||||||||||||
| 28.00 | • | X | O | X | O | O | • | 28.00 | |||||||||||||||||||||
| 27.00 | • | X | O | X | X | • | 27.00 | ||||||||||||||||||||||
| 26.00 | 7 | O | X | O | 2 | • | 26.00 | ||||||||||||||||||||||
| 25.00 | X | 6 | O | X | O | X | • | 25.00 | |||||||||||||||||||||
| 24.00 | X | O | X | 8 | X | 1 | X | • | 24.00 | ||||||||||||||||||||
| 23.00 | X | O | X | O | X | O | • | 23.00 | |||||||||||||||||||||
| 22.00 | X | 3 | X | 9 | B | • | 22.00 | ||||||||||||||||||||||
| 21.00 | X | X | 5 | O | X | • | 21.00 | ||||||||||||||||||||||
| 20.00 | 2 | O | X | A | X | • | 20.00 | ||||||||||||||||||||||
| 19.50 | X | O | X | O | X | • | 19.50 | ||||||||||||||||||||||
| 19.00 | X | O | O | • | 19.00 | ||||||||||||||||||||||||
| 18.50 | X | • | • | 18.50 | |||||||||||||||||||||||||
| 18.00 | 1 | • | 18.00 | ||||||||||||||||||||||||||
| 17.50 | X | • | 17.50 | ||||||||||||||||||||||||||
| 17.00 | X | • | 17.00 | ||||||||||||||||||||||||||
| 23 | 24 | 25 |
| AMD Advanced Micro Devices, Inc. ($184.35) - Semiconductors - AMD moved higher on Wednesday to break a spread triple top at $184 before reaching $186 intraday. This 3 for 5'er moved to a positive trend in May and sits in the top decile of the favored semiconductors sector RS matrix. The weight of the technical evidence is favorable here and continues to improve. However, AMD is in extended territory and at resistance from July 2024. Initial support can be seen at $170 and $158. |
| CNR Core Natural Resources Inc. ($74.72) - Oil - CNR fell to a sell signal Wednesday when it broke a double bottom at $74 after unsuccessfully testing its bearish resistance line. The outlook for the stock remains marginally positive as it is an acceptable 3 for 5'er and ranks in the top half of the oil sector matrix. CNR now sits against support at $74. |
| DAL Delta Air Lines Inc. ($58.98) - Aerospace Airline - DAL broke a double top at $59 for a second buy signal. The stock is a 3 for 5'er that ranks within the top half of the Aerospace Airline sector matrix and is accompanied by a yield of 1.4%. Okay to consider here on the breakout or on a pullback to the mid $50s. Initial support lies at $51, while the bullish support line resides at $48. |
| EAT Brinker International Inc ($159.27) - Restaurants - EAT broke a double top at $162 to return to a buy signal as shares rallied to $166. The stock is a 5 for 5'er that ranks within the top half of the Restaurants sector matrix. Okay to consider here on the breakout. Note resistance lies at $184. Initial support lies at $150, while additional can be found at $144. |
| GEV GE Vernova Inc. ($633.33) - Utilities/Electricity - GEV broke a double bottom at $632 to initiate a shakeout pattern as shares fell to $616. The stock has been a 5 for 5'er since early June, and this action pulls the stock back from recent chart highs. The action point for the shakeout pattern would be upon a reversal into Xs at $640, while the pattern would be complete upon a triple top break at $680. Current support lies at $544 and $520. |
| GM General Motors ($55.62) - Autos and Parts - GM broke a double top at $55 for a third buy signal and to match 2025 chart highs. The stock is a 3 for 5'er that ranks within the top half of the Autos and Parts sector matrix and is accompanied by a yield north of 1%. Okay to consider here on the breakout or on a pullback to the lower $50s. Note resistance lies at current levels, while additional resides at $61. Initial support lies at $49, while the bullish support line sits at $47. |
| HAS Hasbro, Inc. ($80.04) - Leisure - HAS broke a triple top at $79 to complete a shakeout pattern as shares rallied to $80, marking a multi-year high. The stock is a 3 for 5'er that ranks within the top third of the Leisure sector matrix and is accompanied by a yield of 3.6%. Okay to consider here on the breakout or on a pullback to the mid $70s. Initial support lies at $74, while additional may be found at prior resistance in the $69 to $70 range. |
| HCA HCA Healthcare Inc. ($391.02) - Healthcare - HCA inched higher to break a spread quadruple top at $392. The 5 for 5'er shifted up from a 4 with its latest move, after moving back into a positive trend. Additionally, HCA ranks in the top third of the healthcare sector matrix. Long exposure can be made here. Initial support is between $332-$328, with additional support at $316. |
| PEP PepsiCo, Inc. ($149.26) - Food Beverages/Soap - Shares of PEP broke a triple top at $148, ending its streak of three consecutive sell signals. However, the 1 for 5’er continues to lack relative strength versus the market and its peers, making it a name to still avoid for the time being. From here, initial resistance lies at $154, $160, and $164. |
| SFM Sprouts Farmers Market, LLC ($147.08) - Retailing - Shares of SFM completed a bearish catapult at $144 for its second consecutive sell signal. The stock has lost near-term relative strength in recent months, dropping it down into hold territory as a 3 for 5’er. However, it continues to trade in a positive trend and hold long-term relative strength. From here, initial support lies at $140 and continues into the high $120s. |
| TRP TransCanada Corporation ($50.99) - Oil Service - TRP returned to a buy signal Wednesday when it broke a double top at $51, where it now sits against resistance. The return to a buy signal adds to modestly positive technical picture as TRP has an acceptable 3 for 5 technical attribute rating. From here, support can be found at $47, where TRP's bullish support line also currently sits. |
| Name | Option Symbol | Action | Stop Loss |
|---|---|---|---|
| RTX Corp. - $154.81 | O: 25K155.00D21 | Buy the November 155.00 calls at 7.45 | 140.00 |
| Name | Option | Action |
|---|---|---|
| The TJX Companies, Inc. ( TJX) | Sep. 125.00 Calls | Raise the option stop loss to 8.10 (CP: 10.10) |
| 3M Company ( MMM) | Oct. 150.00 Calls | Raise the option stop loss to 10.90 (CP: 12.90) |
| Philip Morris International Inc. ( PM) | Nov. 160.00 Calls | Stopped at 14.10 (CP: 12.70) |
| Apple Inc. ( AAPL) | Oct. 200.00 Calls | Raise the option stop loss to 34.60 (CP: 36.65) |
| Amazon.com Inc. ( AMZN) | Oct. 210.00 Calls | Raise the option stop loss to 17.75 (CP: 19.75) |
| Etsy Inc ( ETSY) | Nov. 60.00 Calls | Raise the option stop loss to 11.30 (CP: 13.30) |
| Name | Option Symbol | Action | Stop Loss |
|---|---|---|---|
| McDonald's Corporation - $305.15 | O: 25W300.00D21 | Buy the November 300.00 puts at 8.95 | 328.00 |
| Name | Option | Action |
|---|---|---|
| Bristol-Myers Squibb Company ( BMY) | Sep. 48.00 Puts | Stopped at 2.20 (CP: 1.58) |
| Enphase Energy Inc ( ENPH) | Sep. 40.00 Puts | Stopped at 6.95 (CP: 6.80) |
| PepsiCo, Inc. ( PEP) | Oct. 135.00 Puts | Stopped at 148.00 (CP: 149.20) |
| H&R Block, Inc. ( HRB) | Oct. 60.00 Puts | Raise the option stop loss to 8.80 (CP: 10.80) |
| Carmax Group ( KMX) | Sep. 65.00 Puts | Stopped at 8.40 (CP: 7.00) |
| Robert Half Inc. ( RHI) | Sep. 40.00 Puts | Stopped at 4.90 (CP: 4.20) |
| Salesforce Inc. ( CRM) | Nov. 260.00 Puts | Stopped at 32.05 (CP: 30.60) |
| FedEx Corporation ( FDX) | Dec. 230.00 Puts | Initiate an option stop loss of 15.65 (CP: 17.65) |
| Name | Option Sym. | Call to Sell | Call Price | Investment for 500 Shares | Annual Called Rtn. | Annual Static Rtn. | Downside Protection |
|---|---|---|---|---|---|---|---|
| Advanced Micro Devices, Inc. $ 174.95 | O: 25J185.00D17 | Oct. 185.00 | 13.60 | $ 86,016.30 | 36.33% | 37.95% | 6.33% |
| Name | Action |
|---|---|
| Hims & Hers Health Inc. ( HIMS) - 47.96 | Sell the September 55.00 Calls. |
| IonQ Inc. ( IONQ) - 43.00 | Sell the October 42.00 Calls. |
| MARA Holdings Inc. ( MARA) - 15.72 | Sell the December 18.00 Calls. |
| NetApp, Inc. ( NTAP) - 107.78 | Sell the December 110.00 Calls. |
| Apollo Global Management Inc. ( APO) - 144.60 | Sell the December 150.00 Calls. |
| Vertiv Holdings LLC ( VRT) - 143.72 | Sell the October 140.00 Calls. |
| Robinhood Markets, Inc. Class A ( HOOD) - 114.09 | Sell the November 110.00 Calls. |
| Warner Bros. Discovery, Inc. Series A ( WBD) - 11.22 | Sell the November 12.00 Calls. |
| Norwegian Cruise Line Holdings Ltd. ( NCLH) - 24.24 | Sell the December 24.00 Calls. |
| Seagate Technology ( STX) - 155.59 | Sell the November 160.00 Calls. |
| Name | Covered Write |
|---|---|
|
|
|
Daily Equity & Market Analysis
Loading, Please Wait...
