Most Requested Symbols

While there are numerous talking points for the renewed optimism for Japan’s economy, markets have interpreted the results positively, sending Japanese and Pacific basin related stocks and funds higher.
The Focus 5 strategy gains steam as new leadership trends emerge
Weekly Rundown Video – Feb 4, 2026
Weekly rundown with NDW analyst team covering all major asset classes.
Weekly rundown with NDW analyst team covering all major asset classes.
The NDW DALI Asset Class Rankings have witnessed jockeying by international and domestic equities for the top ranked asset class. While there are a number of themes contributing to the hot race for first place, among them is the recent uptick in technical strength from the Pacific region, primarily from Japan. After holding a snap election over the weekend, Japan’s Prime Minister Takaichi was able to pioneer a landslide win for her party, leading to the largest majority by any single party in the post-World War II era. While there are numerous talking points for the renewed optimism for Japan’s economy, markets have interpreted the results positively, sending Japanese and Pacific basin related stocks and funds higher.
An example of the recent positive run can be seen through the chart and technical picture of the Vanguard FTSE Pacific Fund (VPL), which marked a new all-time chart high at $104 during Tuesday’s (2/10) trading. On the default point and figure trend chart, VPL has maintained a buy signal and positive trend since April 2025. The new year kicked off with a third buy signal as shares have pushed to highs and an extended position, above the top of the 10-week trading band. The notable improvement during the past 10 months has led to superior relative strength against the market as defined by the S&P 500 Equal Weight Index (SPXEWI) and its peer group, defined by the iShares MSCI ACWI Ex-US ETF (ACWX). Encompassing all this has pushed VPL to match its highest fund score in roughly 20 years at 5.81 (out of 6).
As noted, the impressive run has pushed the fund (and other Pacific funds) into overbought territory, above the top of the 10-week trading band. For VPL, the current intraday during Tuesday’s (2/10) is the highest overbought level for the ETF in 29 years with data beginning in 1995. Given the historically overbought level at all-time highs, those bullish on the region will look for the fund to develop support in the upper $90s along with a normalization of the 10-week trading band before considering initial or additional exposure. A similar approach may be taken with other regions or international stocks that have witnessed a recent rally to an extended position. Support for VPL on its default trend chart can be found in the mid to upper $80s, while the bullish support line currently resides at $73.


The Focus 5 Model is a sector rotation strategy that invests in five sector/industry ETFs based on the relative strength ranking of roughly 20 sectors. Since its inception in 2009, the model has looked to buy the sectors that are showing the best relative strength. The five positions are held as long as they sit in the top half of our ranking. Positions are only sold when they fall out of the top half of the relative strength rankings. This simple, straightforward, rules-based strategy that has been in existence for more than 16 years is also the basis for the Dorsey Wright Focus 5 Index, which is tracked by the First Trust Dorsey Wright Focus 5 ETF (FV).
Relative strength is just another phrase for momentum. Funds at the top of the Focus 5 inventory relative strength ranking demonstrate more momentum than the funds ranked at the bottom. Over time, relative strength (momentum) has been a robust investment factor with the potential to provide investors with excess return. However, that does not mean a relative strength-based strategy will outperform all the time. There are two types of market environments where relative strength-based strategies tend to underperform: during changes in leadership, and periods with low dispersion of leadership trends.
The first environment is straightforward. If the market is going from a growth-led market to a value-led market, it will take some time for a relative strength strategy to adjust to that new leadership. As the old leadership rotates out, by definition, it will have to endure a period of underperformance before being sold. Subsequently, for the new leadership to move into the models we need to see a period of outperformance before those new areas of strength can be added to the models. The second market environment, narrow leadership, can take on different forms, but this is exactly the type of market environment we have seen over the past few years.
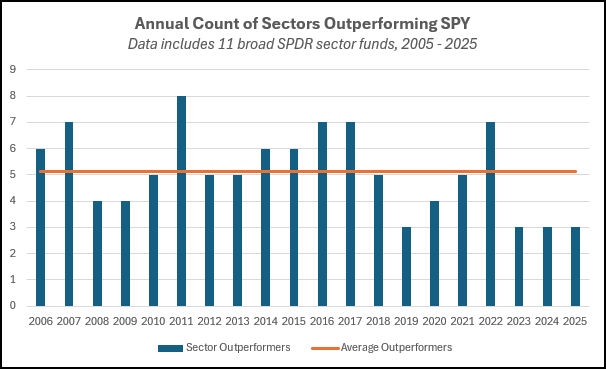
The last three years (2023 – 2025) has been the longest stretch of very narrow leadership that we have seen in more than 20 years. On average, out of the 11 broad sectors, five sectors outperform the S&P 500 each year. When the number of sectors outperforming the market is higher than five, it means there is more opportunity to find excess return in the market through a sector rotation strategy. When the number is lower than five, it means it is harder to find excess returns above the market benchmark. For three consecutive years (2023, 2024, and 2025) there have only been three sectors that have been able to outperform the S&P 500 (SPY). One is Communication Services (XLC), which is basically Meta and Alphabet. Another is Technology (XLK), which has been the best performing in the two of the past three years thanks to NVIDIA, Apple, and Microsoft. Strategies that diversified away from these mega cap growth names have had a tough time keeping up with the S&P 500.
While no two markets are the same, we have seen periods of underperformance for the Focus 5 strategy in the past. Below is a chart with rolling 6-month excess return periods for the Focus 5 strategy versus the S&P 500. The bars above zero (blue bars) represent periods of positive excess return (outperformance) for the Focus 5 while the bars below the zero line (orange bars) represent periods of negative excess return (underperformance) for Focus 5. A couple of points to be made here:
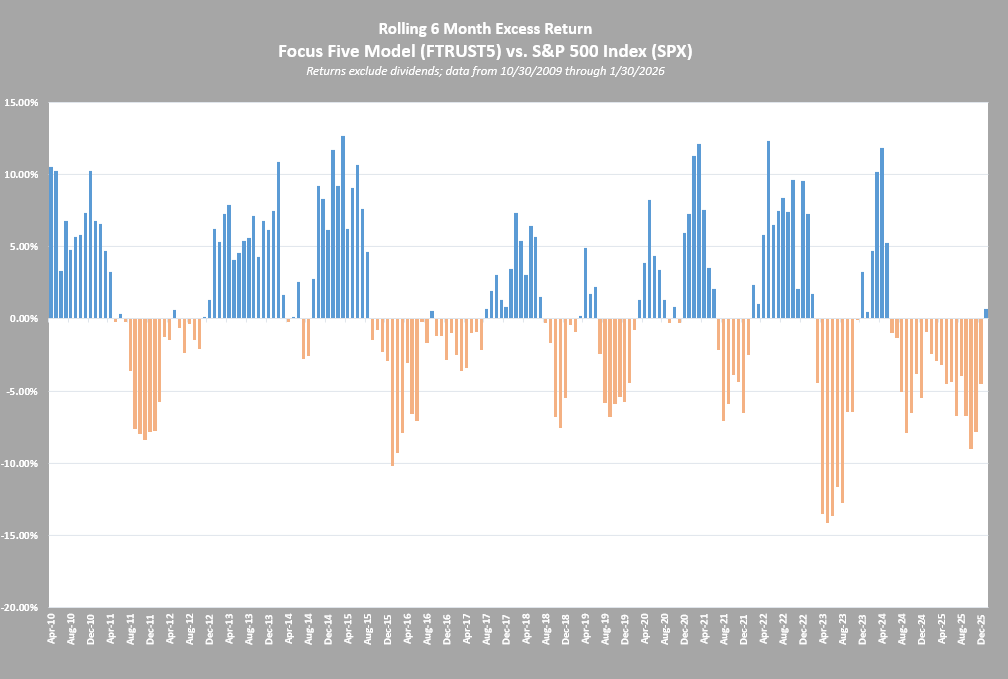
As a result of the performance of Focus 5 over the past few months, the rolling six-month excess return has turned back to being positive for the first time in 19 periods. The last three months (November, December, and January) saw three sector changes within the Focus 5 Model. As a result, FTXL (Semi’s), MISL (Aerospace & Defense), and FBT (Biotech) were all added to the model. The other two positions in the Focus 5 are FDN (Internet) and FXO (Financials), which have maintained consistent leadership.
While it may seem counterintuitive, the best time to invest in a relative strength-based strategy is when it is going through periods of underperformance. Every investment strategy has a pain point or market environment in which it will struggle. The changing of the guard within the leadership trend of the market has been just that for relative strength. These periods of underperformance are never comfortable, but they are a necessary part of the process. The lagging names within the model are culled to make room for the next emerging trends in the market. Investing in the strategy as it refocuses can provide exposure to the new leadership as it picks up steam.
Disclosures:
The performance numbers on this page are price returns unless otherwise indicated, not inclusive of all transaction costs. Neither the returns for the models nor the model benchmarks reflect the reinvestment of dividends.
This article is intended only for financial professional use only. Not Intended for retail investors.
Click here for more information from Invesco on the First Trust Dorsey Wright Focus 5 ETF (FV): https://www.ftportfolios.com/retail/etf/etfsummary.aspx?Ticker=FV
Dorsey, Wright & Associates, LLC is owned by Nasdaq, Inc. and we have affiliates who also provide financial services, research, information, and act as Broker/Dealers to a wide variety of clients. Our affiliates use information we create to create indexes, which are then used to create Exchange Traded Funds. These things create a potential conflict of interest in that we may have an incentive to promote or use the products and services of our affiliates and business partners. A number of Dorsey Wright representatives are registered with and hold securities licenses with the affiliate broker dealers. In this capacity, they assist with marketing and distribution of Exchange Traded Products.
While we make every effort to be free of errors in this report, it contains data obtained from other sources. We believe these sources to be reliable, but we cannot guarantee their accuracy. Officers or employees of this firm may now or in the future have a position in the stocks mentioned in this report. Dorsey, Wright is a Registered Investment Advisor with the U.S. Securities & Exchange Commission. Copies of Form ADV Part II are available upon request.
Average Level
39.08
| < - -100 | -100 - -80 | -80 - -60 | -60 - -40 | -40 - -20 | -20 - 0 | 0 - 20 | 20 - 40 | 40 - 60 | 60 - 80 | 80 - 100 | 100 - > |
|---|---|---|---|---|---|---|---|---|---|---|---|
|
Sell signalicf
|
|||||||||||
|
Buy signalfxe
|
|||||||||||
|
Buy signalQQQ
|
Buy signaluso
|
||||||||||
|
Sell signalONEQ
|
Buy signalijr
|
||||||||||
|
Sell signalVOOG
|
Sell signallqd
|
Buy signalrsp
|
|||||||||
|
Buy signalXLG
|
Buy signalagg
|
Buy signalgsg
|
Buy signalEEM
|
||||||||
|
Sell signalief
|
Buy signalshy
|
Buy signalSPY
|
Buy signaliwm
|
Buy signalIJH
|
Buy signaldvy
|
||||||
|
Sell signaldx/y
|
Sell signaltlt
|
Buy signalhyg
|
Buy signalgcc
|
Buy signaldia
|
Buy signalVOOV
|
Buy signalGLD
|
Buy signalefa
|
||||
| < - -100 | -100 - -80 | -80 - -60 | -60 - -40 | -40 - -20 | -20 - 0 | 0 - 20 | 20 - 40 | 40 - 60 | 60 - 80 | 80 - 100 | 100 - > |
| AGG | iShares US Core Bond ETF |
| USO | United States Oil Fund |
| DIA | SPDR Dow Jones Industrial Average ETF |
| DVY | iShares Dow Jones Select Dividend Index ETF |
| DX/Y | NYCE U.S.Dollar Index Spot |
| EFA | iShares MSCI EAFE ETF |
| FXE | Invesco CurrencyShares Euro Trust |
| GLD | SPDR Gold Trust |
| GSG | iShares S&P GSCI Commodity-Indexed Trust |
| HYG | iShares iBoxx $ High Yield Corporate Bond ETF |
| ICF | iShares Cohen & Steers Realty ETF |
| IEF | iShares Barclays 7-10 Yr. Tres. Bond ETF |
| LQD | iShares iBoxx $ Investment Grade Corp. Bond ETF |
| IJH | iShares S&P 400 MidCap Index Fund |
| ONEQ | Fidelity Nasdaq Composite Index Track |
| QQQ | Invesco QQQ Trust |
| RSP | Invesco S&P 500 Equal Weight ETF |
| IWM | iShares Russell 2000 Index ETF |
| SHY | iShares Barclays 1-3 Year Tres. Bond ETF |
| IJR | iShares S&P 600 SmallCap Index Fund |
| SPY | SPDR S&P 500 Index ETF Trust |
| TLT | iShares Barclays 20+ Year Treasury Bond ETF |
| GCC | WisdomTree Continuous Commodity Index Fund |
| VOOG | Vanguard S&P 500 Growth ETF |
| VOOV | Vanguard S&P 500 Value ETF |
| EEM | iShares MSCI Emerging Markets ETF |
| XLG | Invesco S&P 500 Top 50 ETF |

| Symbol | Company | Sector | Current Price | Action Price | Target | Stop | Notes |
|---|---|---|---|---|---|---|---|
| BCO | The Brink's Company | Protection Safety Equipment | $130.37 | mid 110s - low 120s | 152 | 104 | 5 for 5'er, top half of PROT sector matrix, LT pos peer & mkt RS, spread triple top, R-R>2.0, Earn. 2/25 |
| JPM | J.P. Morgan Chase & Co. | Banks | $322.10 | lo 300s - mid 320s | 380 | 256 | 5 TA rating, top 25% of favored BANK sector matrix, LT RS buy, LT pos trend, buy-on-pullback |
| ENVA | Enova International Inc | Finance | $158.74 | hi 150s - 160s | 190 | 142 | 5 for 5'er, 2 of 78 in FINA sector matrix, LT pos peer & mkt RS |
| EWBC | East West Bancorp, Inc. | Banks | $122.49 | mid 100s - mid 110s | 157 | 92 | 4 for 5'er, top third of favored BANK sector matrix, LT pos peer RS, one box from mkt RS buy, spread quad top |
| ULTA | Ulta Beauty, Inc. | Retailing | $696.25 | 632 - hi 600s | 840 | 568 | 4 TA rating, top 10% of RETA sector matrix, LT RS buy, consec buy signals |
| APTV | Aptiv PLC | Autos and Parts | $83.37 | hi 70s - low 80s | 100 | 69 | 5 for 5'er, top half of AUTO sector matrix, successful trend line test |
| GS | Goldman Sachs Group, Inc. | Wall Street | $943.62 | mid-800s - mid-900s | 1416 | 736 | 5 TA rating, top 10% of WALL sector matrix, LT RS buy, LT pos trend, buy-on-pullback |
| PHM | PulteGroup, Inc. | Building | $132.37 | hi 120s - mid 130s | 168 | 110 | 4 for 5'er, top half of BUIL sector matrix, LT pos peer & mkt RS, bullish catapult |
| META | Meta Platform Inc. | Internet | $677.22 | 650s - 690s | 1040 | 552 | 4 for 5'er, top 20% of INET sector matrix, LT pos peer & mkt RS, triple top, buy on pullback |
| BFH | Bread Financial Holdings Inc. | Business Products | $77.90 | 74-lo 80s | 94 | 64 | 5 TA rating, top 20% of BUSI sector matrix, LT RS buy, buy-on-pullback |
| Symbol | Company | Sector | Current Price | Action Price | Target | Stop | Notes |
|---|
| Comment | |||||||
|---|---|---|---|---|---|---|---|
|
|
|||||||
BFH Bread Financial Holdings Inc. ($76.96) R - Business Products - BFH has a 5 for 5 TA rating and sits in the top quintile of the business products sector RS matrix. The stock has maintained and RS buy signal against the market since mid-2024 and been in a positive trend since last May. The near-term technical picture has also seen steady improvement in recent weeks, as the stock gave two consecutive buy signals before retracting back toward the middle of its trading band. Exposure may be considered from $74 to the low $80s. Our initial stop will be positioned at $64, which would violate multiple support levels and move the stock to a negative trend. The bullish price objective of $94 will serve as our price target.
| 26 | |||||||||||||||||||||||||||||
| 82.00 | X | 82.00 | |||||||||||||||||||||||||||
| 81.00 | X | O | 81.00 | ||||||||||||||||||||||||||
| 80.00 | X | O | 80.00 | ||||||||||||||||||||||||||
| 79.00 | X | O | X | 79.00 | |||||||||||||||||||||||||
| 78.00 | X | X | O | X | 78.00 | ||||||||||||||||||||||||
| 77.00 | X | O | 1 | O | X | X | 77.00 | ||||||||||||||||||||||
| 76.00 | X | O | X | O | X | O | X | 76.00 | |||||||||||||||||||||
| 75.00 | X | O | X | O | 2 | O | X | 75.00 | |||||||||||||||||||||
| 74.00 | X | O | O | X | X | O | Mid | 74.00 | |||||||||||||||||||||
| 73.00 | X | O | X | O | X | 73.00 | |||||||||||||||||||||||
| 72.00 | X | O | X | O | X | 72.00 | |||||||||||||||||||||||
| 71.00 | X | O | X | O | X | 71.00 | |||||||||||||||||||||||
| 70.00 | X | O | X | O | X | 70.00 | |||||||||||||||||||||||
| 69.00 | C | O | X | O | 69.00 | ||||||||||||||||||||||||
| 68.00 | X | X | O | 68.00 | |||||||||||||||||||||||||
| 67.00 | X | X | O | X | X | 67.00 | |||||||||||||||||||||||
| 66.00 | X | O | X | O | X | O | X | 66.00 | |||||||||||||||||||||
| 65.00 | X | X | O | X | O | X | O | X | 65.00 | ||||||||||||||||||||
| 64.00 | X | X | O | X | 9 | O | X | O | X | • | 64.00 | ||||||||||||||||||
| 63.00 | X | O | X | O | X | O | X | O | X | • | 63.00 | ||||||||||||||||||
| 62.00 | X | O | X | O | X | O | X | O | X | • | 62.00 | ||||||||||||||||||
| 61.00 | X | O | 8 | X | O | X | B | X | • | 61.00 | |||||||||||||||||||
| 60.00 | X | O | X | O | X | O | • | Bot | 60.00 | ||||||||||||||||||||
| 59.00 | X | O | X | O | X | • | 59.00 | ||||||||||||||||||||||
| 58.00 | 7 | O | O | X | • | 58.00 | |||||||||||||||||||||||
| 57.00 | • | X | O | X | • | 57.00 | |||||||||||||||||||||||
| 56.00 | • | X | O | X | • | 56.00 | |||||||||||||||||||||||
| 55.00 | • | X | X | X | A | X | • | 55.00 | |||||||||||||||||||||
| 54.00 | X | O | X | O | X | O | • | 54.00 | |||||||||||||||||||||
| 53.00 | X | O | 6 | O | X | • | • | 53.00 | |||||||||||||||||||||
| 52.00 | X | O | X | O | X | • | 52.00 | ||||||||||||||||||||||
| 51.00 | X | X | O | X | O | • | 51.00 | ||||||||||||||||||||||
| 50.00 | X | O | 5 | O | • | 50.00 | |||||||||||||||||||||||
| 49.00 | X | O | X | • | 49.00 | ||||||||||||||||||||||||
| 48.00 | O | X | O | X | • | 48.00 | |||||||||||||||||||||||
| 47.00 | O | X | O | • | 47.00 | ||||||||||||||||||||||||
| 46.00 | O | X | • | 46.00 | |||||||||||||||||||||||||
| 45.00 | O | X | • | 45.00 | |||||||||||||||||||||||||
| 44.00 | O | X | • | 44.00 | |||||||||||||||||||||||||
| 43.00 | O | • | 43.00 | ||||||||||||||||||||||||||
| 26 |
| AA Alcoa Inc. ($62.15) - Metals Non Ferrous - After giving two consecutive sell signals, AA returned to a buy signal Tuesday with a double top break at $63, where it now sits against resistance. Tuesday's move adds to an already positive technical picture as AA is a 4 for 5'er that ranks in the top quartile of the metals non ferrous sector matrix. From here, the first level of support sits at $56. |
| AMR Alpha Metallurgical Resources Inc. ($189.45) - Oil - AMR gave third consecutive sell signal Tuesday when it broke a double bottom at $198 and continued lower violating its trend line with a move to $190. The negative trend change will drop AMR to an unfavorable 2 for 5'er. From here, the next level of support sits at $186. |
| H Hyatt Hotels Corp. ($166.91) - Leisure - H reversed into Xs and broke a double top at $166 to return to a buy signal as shares rallied to $170. The move penetrates the bearish resistance line, which will increase the stock up to a 5 for 5'er. Okay to consider here on the breakout or on a pullback to the lower $160s. Note the stock's all-time chart high resides at $174. Initial support can be found at $158, the bullish support line, while additional lies in the lower $150s. |
| HAS Hasbro, Inc. ($103.82) - Leisure - HAS reversed into Xs and broke a double top at $98 for a fifth buy signal as shares rallied to $104. The breakout brings HAS up to its highest chart level since early 2022 and overbought territory. HAS has been a 5 for 5'er since November 2025 and currently ranks within the top quartile of the Leisure sector matrix. Those seeking exposure to the stock are best to look for price consolidation in the upper $90 range along with a normalization of the 10-week trading band before considering. Initial support can be found at $94, while additional lies at $85. |
| LOW Lowe's Companies Inc. ($285.05) - Building - LOW broke a double top at $284 for a fourth buy signal and to match the all-time chart high from October 2024. The stock has been a 3 for 5'er for more than 12 months and ranks within the top half of the Building sector matrix. Okay to consider here on the breakout or on a pullback to the mid $260 to $270 range. Initial support can be found at $264, while additional resides at $244, the bullish support line. |
| MKC McCormick & Company, Incorporated ($69.04) - Food Beverages/Soap - Shares of MKC broke a double top at $69 to move back to a buy signal, in addition to flipping its trend back to positive for the first time since July. However, the now 1 for 5'er continues to lack relative strength versus the market and its peers, keeping it in sell territory for the time being. From here, resistance lies at $69 then $72. |
| ON On Semiconductor Corp. ($67.31) - Semiconductors - ON pushed higher Tuesday to break a double top at $67 before reaching $68 intraday. This also marks a new 52-week high for the 3 for 5 TA stock. The technical picture remains mixed but is showing near-term improvement again. Initial support is seen at $58. Note that ON is nearing overbought territory, with initial resistance potentially seen at $70. |
| SPOT Spotify Technology S.A. ($475.80) - Media - As our last comment on SPOT mentioned, the name did see continued downside after returning to a negative trend on its default chart to close out 2025. Even after gaining nearly 15% today on the back of positive earnings, the poor TA name is still down over 10% this year alone and remains a name we will look to avoid. The bounce does bring the name out of heavily oversold territory, so those looking to exit positions should trim here. SPOT maintains its string of sell signals with overhead resistance at $520. |
| TOL Toll Brothers, Inc. ($161.01) - Building - TOL broke a double top at $156 to complete a bullish catapult as shares rallied to $160. The stock has been a 4 for 5'er since August 2025 and currently ranks within the top third of the Retailing sector matrix. Okay to consider here on the breakout or on a pullback to the lower $150s. Initial support lies at $148, while additional can be found at $142, the bullish support line. |

| Name | Option Symbol | Action | Stop Loss |
|---|---|---|---|
| Huntington Bancshares Incorporated - $18.54 | O: 26D18.00D17 | Buy the April 18.00 calls at 1.30 | 16.00 |
| Name | Option | Action |
|---|---|---|
| Gilead Sciences, Inc. ( GILD) | Mar. 125.00 Calls | Stopped at 25.00 (CP: 24.40) |
| Wells Fargo & Company ( WFC) | Apr. 87.50 Calls | Stopped at 7.70 (CP: 7.55) |
| Hilton Worldwide Holdings Inc ( HLT) | Mar. 300.00 Calls | Raise the option stop loss to 24.80 (CP: 26.80) |
| The Charles Schwab Corporation ( SCHW) | May. 105.00 Calls | Stopped at 5.00 (CP: 3.50) |
| Name | Option Symbol | Action | Stop Loss |
|---|---|---|---|
| MetLife, Inc. - $77.81 | O: 26P77.50D17 | Buy the April 77.50 puts at 2.90 | 84.00 |
| Name | Option | Action |
|---|---|---|
| Toast, Inc. Class A ( TOST) | Feb. 35.00 Puts | Stopped at 5.60 (CP: 5.25) |
| Uber Technologies, Inc. ( UBER) | Apr. 80.00 Puts | Stopped at 5.80 (CP: 4.70) |
| Uber Technologies, Inc. ( UBER) | Apr. 75.00 Puts | Stopped at 0.00 (CP: 4.70) |
| Name | Option Sym. | Call to Sell | Call Price | Investment for 500 Shares | Annual Called Rtn. | Annual Static Rtn. | Downside Protection |
|---|---|---|---|---|---|---|---|
| Fortinet Inc. $ 85.93 | O: 26E90.00D15 | May. 90.00 | 5.15 | $ 40,658.55 | 37.38% | 20.26% | 4.96% |
| Name | Action |
|---|---|
| Alcoa Inc. ( AA) - 62.36 | Sell the March 60.00 Calls. |
| Intel Corporation ( INTC) - 50.24 | Sell the May 49.00 Calls. |
| The Gap, Inc. ( GAP) - 27.67 | Sell the March 29.00 Calls. |
| Dollar General Corp. ( DG) - 147.37 | Sell the May 150.00 Calls. |
| Freeport-McMoRan Inc. ( FCX) - 63.61 | Sell the March 65.00 Calls. |
| Name | Covered Write |
|---|---|
| Intel Corporation ( INTC - 50.24 ) | March 52.50 covered write. |
Daily Equity & Market Analysis
LISTEN TO PODCAST
Apr 02, 2026
Loading, Please Wait...
