
Last week, the US Dollar notched a 10% rally from its July 2023 low, placing us in a rising dollar environment. We examine how different assets perform in different dollar environments.
The US Dollar has risen over the several months, advancing to a new multi-year high of 109.97 last Friday (1/10). That was intraday high was enough to notch a 10% rally from the recent low of 99.578 seen on July 14, 2023, placing us in a rising dollar environment based on our historical US Dollar Study. Therefore, we will take the opportunity to show how various assets and segments of the market are affected by the rise and fall of the greenback.
What is the US Dollar Index (DX/Y)?
To begin we should first explain that the US Dollar Index (DX/Y) is priced in terms of a weighted basket of major foreign currencies. When we hear about movements in "the dollar," it is typically this index that is being referenced. Today, the US Dollar Index contains six component currencies, which are "trade-weighted": the Euro, Japanese Yen, British Pound, Canadian Dollar, Swedish Krona, and Swiss Franc. The currency weights contributing to the pricing of this Index are as follows:

As mentioned above, DX/Y rose back to 109.50 on its default chart on January 10, and the actual intraday high ticked above our 10% rally threshold for the first time in the current ascent. The 10% demarcation between rising/falling dollar environments is just a useful guideline, not a technical indicator that a trend will continue. Therefore, investors should not necessarily make big shifts in their allocations based on just the 10% rally. However, the technical strength of the dollar has been improving consistently since last October. We do show near-term support offered at 108, while further confirmation would be given with a potential third consecutive buy signal that would be seen at 110.

Our data on the ICE U.S. Dollar Spot Index goes back to the inception of futures contracts on the U.S. Dollar Index (in 1985). Since that time, we have seen many significant moves for the dollar, allowing us to see how different assets perform in different dollar environments.
Study Parameters:
Rising Dollar Market: Any move of at least 10% from a low constitutes a new "rising dollar market." The beginning of this trend is established at the low watermark and the trend remains in force until a correction of at least 10% occurs, at which point the peak of that rally then marks the end of the rising trend in the dollar. This represents a "trough to peak" move in the dollar, and that period is what we use to qualify a rising dollar market.
Falling Dollar Market: Any decline of at least 10% in the dollar index from a peak begins a "falling dollar market." The beginning of this trend is established at the high watermark and the trend remains in force until a rally of at least 10% occurs off a low, at which point the trough of that decline marks the end of the falling trend in the dollar. This represents a "peak to trough" move in the dollar, and the period within is what we use to qualify a falling dollar market.
By this measure, there have been a total of 14 falling dollar markets and 14 rising dollar markets since 1985 (including the current environment). The average duration of a cycle (rising or falling) is 510 days, which results in moves of around 20% in either direction for the dollar (keep in mind that the manner in which these trends were calculated means that no trend could have resulted in a move materially less than 10% in either direction).
On average, rising dollar periods have lasted longer than falling dollar periods, at respective averages of 598 and 421 days. The previous rising dollar environment was slightly longer than average at 632 days, ending in September 2022, which saw DX/Y gain 25%. Below we have a summary of the prior rising and falling environments, paired with the returns of major asset benchmarks during each period.
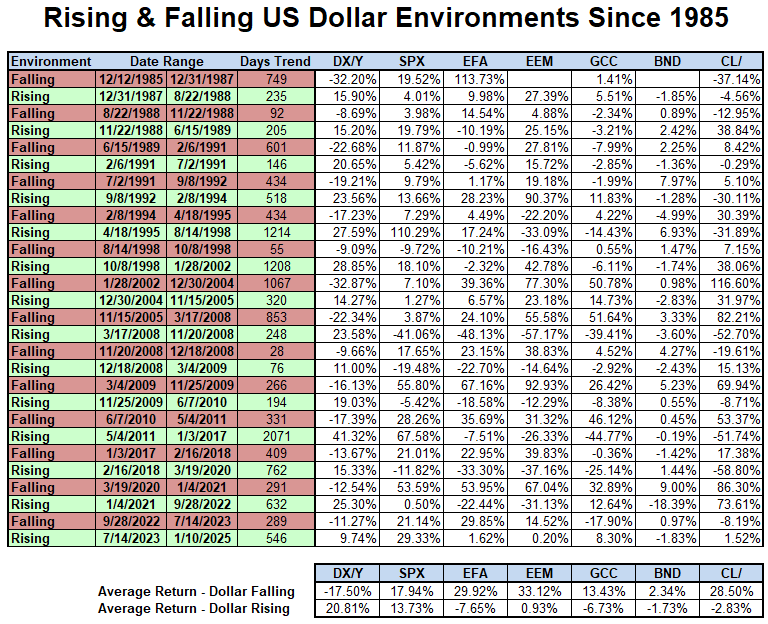
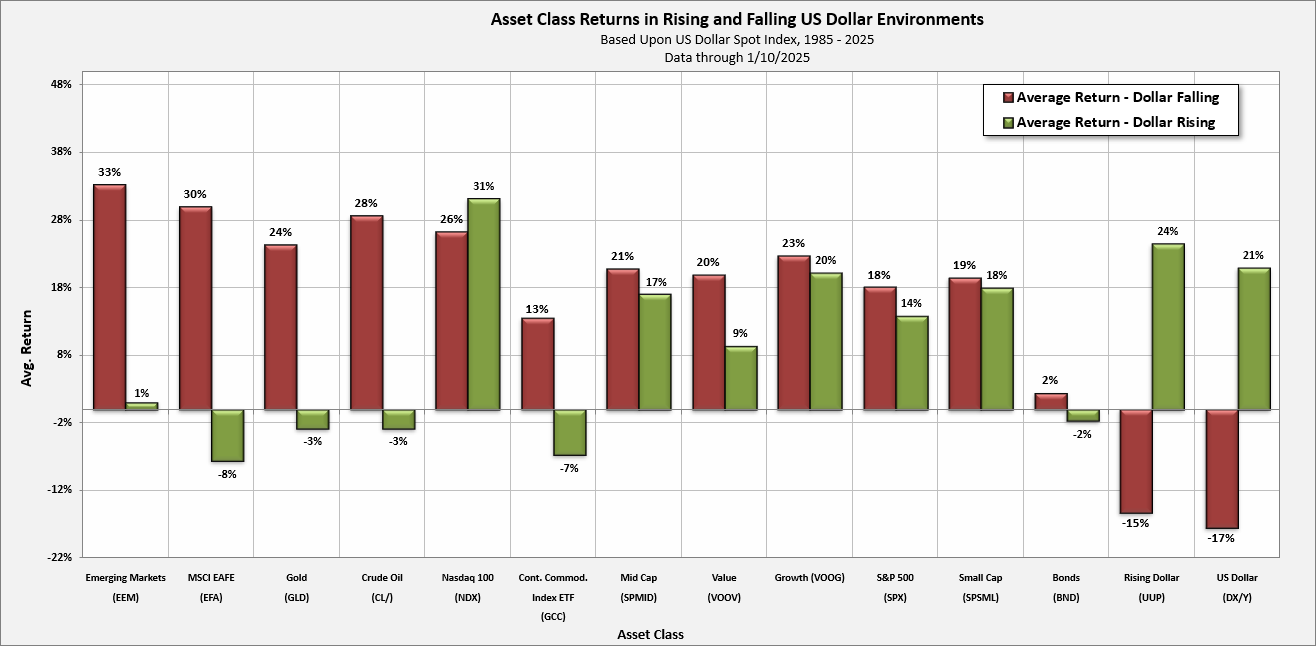
The graphic below delves further into the average returns of various asset class representatives in different dollar environments. The results were interesting as many assets did show meaningful performance biases during either rising or falling dollar markets. The red bars in the graphics below represent the average performance during all falling dollar markets, while the green bars represent the average performance by that same asset class during all rising dollar markets. For some assets, we did not have data going back to 1985, so returns reflect the average since the time at which we had data, with all assets having data going back to at least 1995.
Observations:
- The S&P 500 Index SPX has performed well in rising and falling dollar environments, although we see the average performance in rising environments underperform falling periods by roughly 4%.
- The spread between rising and falling environments is more negative (favoring falling) for value (VOOV) relative to growth (VOOG).
- The Nasdaq-100 Index is the only equity representative to show higher average returns in rising vs. falling environments.
- Mid caps and small caps show more muted differences in rising vs. falling environments.
- Both developed and emerging markets are significantly weaker in rising dollar environments, but the underperformance is worse for emerging markets.
- Rising dollar environments are also notably worse for commodities, but not to the same magnitude as international equities.
Of course, there is a significant amount of variation among the companies that make up the broad US equity market and, being big believers in sector rotation, we would be remiss if we didn’t take a closer look to see how the various segments were impacted by the dollar. Although we had to adjust the time frame of the study a bit based on data availability; the sector portion of our study includes data beginning in 1992. Our study includes the 11 broad sectors (basic materials, consumer cyclicals, consumer non-cyclicals, energy, financials, healthcare, industrials, technology, telecommunications/comm services, real estate, and utilities). The results of the study are shown below, following the same structure as the broader study.

Observations:
- Healthcare, financials, and consumer cyclicals are the only sectors that outperform in rising vs. falling dollar environments.
- Basic materials, energy, and industrials show the largest spread of underperformance in rising vs. falling environments.
- Technology shows the highest average return in rising environments, although that slightly underperforms the sector’s average in falling environments.
Even though commodities just moved into the second position in our DALI asset class rankings, it is a generally accepted principle that commodities tend to do worse in a rising dollar environment. A myriad of variables from weather to OPEC impact the supply and demand for and price of commodities. Because commodities are denominated in US dollars, currency movements can also have a material impact on price and performance. Said more directly, with a rising dollar, commodities become more expensive for overseas buyers, theoretically hurting demand. Commodities also do not show the same magnitude of underperformance in rising environments as international equities, which makes sense with commodities moving ahead of international equities in DALI. The graph below shows the average performance of four ETFs representing different areas of the commodities complex, copper (industrial metals), energy, gold (precious metals), and agriculture.

Observations:
- Energy is the only commodity representative in our examination that still shows a positive average return in rising dollar environments. Although, it still underperforms the falling dollar average.
- The last rising dollar environment from early 2021 to September 2022 showed extreme appreciation for energy commodities, bucking the historical trends. Agriculture also rose during that period.
- Copper shows the largest spread of underperformance during rising dollar environments and shows the lowest absolute average in those timeframes.
Overall, the data clearly illustrates that there are assets whose performance tends to materially change in rising vs. falling dollar environments. However, the last few periods also showed that while the dollar can be an important factor, it is not the only variable affecting the price movement of these assets. With that said, keep these historical tendencies in mind as we look toward 2025.
