Most Requested Symbols

Last week, the US Dollar notched a 10% rally from its July 2023 low, placing us in a rising dollar environment. We examine how different assets perform in different dollar environments.
The curve has an average reading of -32.97%,
Today's featured stock is Arista Networks Inc (ANET).
Comments include: ANF, BOOT, CAVA, CEIX, CF, CW, DEO, DJT, MNDY, & X.
Call: Apple Inc (AAPL); Put: PDD Holdings Inc (PDD); Covered Write: Tapestry Inc (TPR).
NDW Morning Update Video - January 14, 2025
NDW Morning Update Video – January 14, 2025.
Click here to download MP3
The start of 2025 has certainly been eventful. From markets taking a step back, to rate expectations changing, to broader changes in longer-term relative strength, there has certainly been plenty to talk about over the last few weeks. Today, we will look at the NDW’s broad Dynamic Asset Level Investing (DALI) tool, which utilizes relative strength matrices to pinpoint areas of strength or weakness across six different asset classes. Evaluated daily, the DALI tool can help us look behind the curtain as to what areas of investable assets are earning relative strength and are fit for investment. At its core, DALI aims to have a long-term view of an asset class and its respective technical positioning.
As of today (1/13/2025), commodities have moved above international equities to earn the second spot within the broad asset class rankings, its highest ranking last July. The group picked up signals from most of the broad groups (sans domestic equities), now having convincingly overtaken international equities which have struggled post-election.

Of course, knowing that commodities have moved up is only half (or less than half!) the battle. Knowing where the strength has come from can help us fill in the missing puzzle pieces. To do so, we can look at the asset class matrix. While the exact underlying matrix behind the DALI framework is proprietary, the premade asset class matrix can offer a good look into a similar kind of universe as to what the Dorsey team uses in DALI. Taking a look at that matrix, there are a few things that stick out.
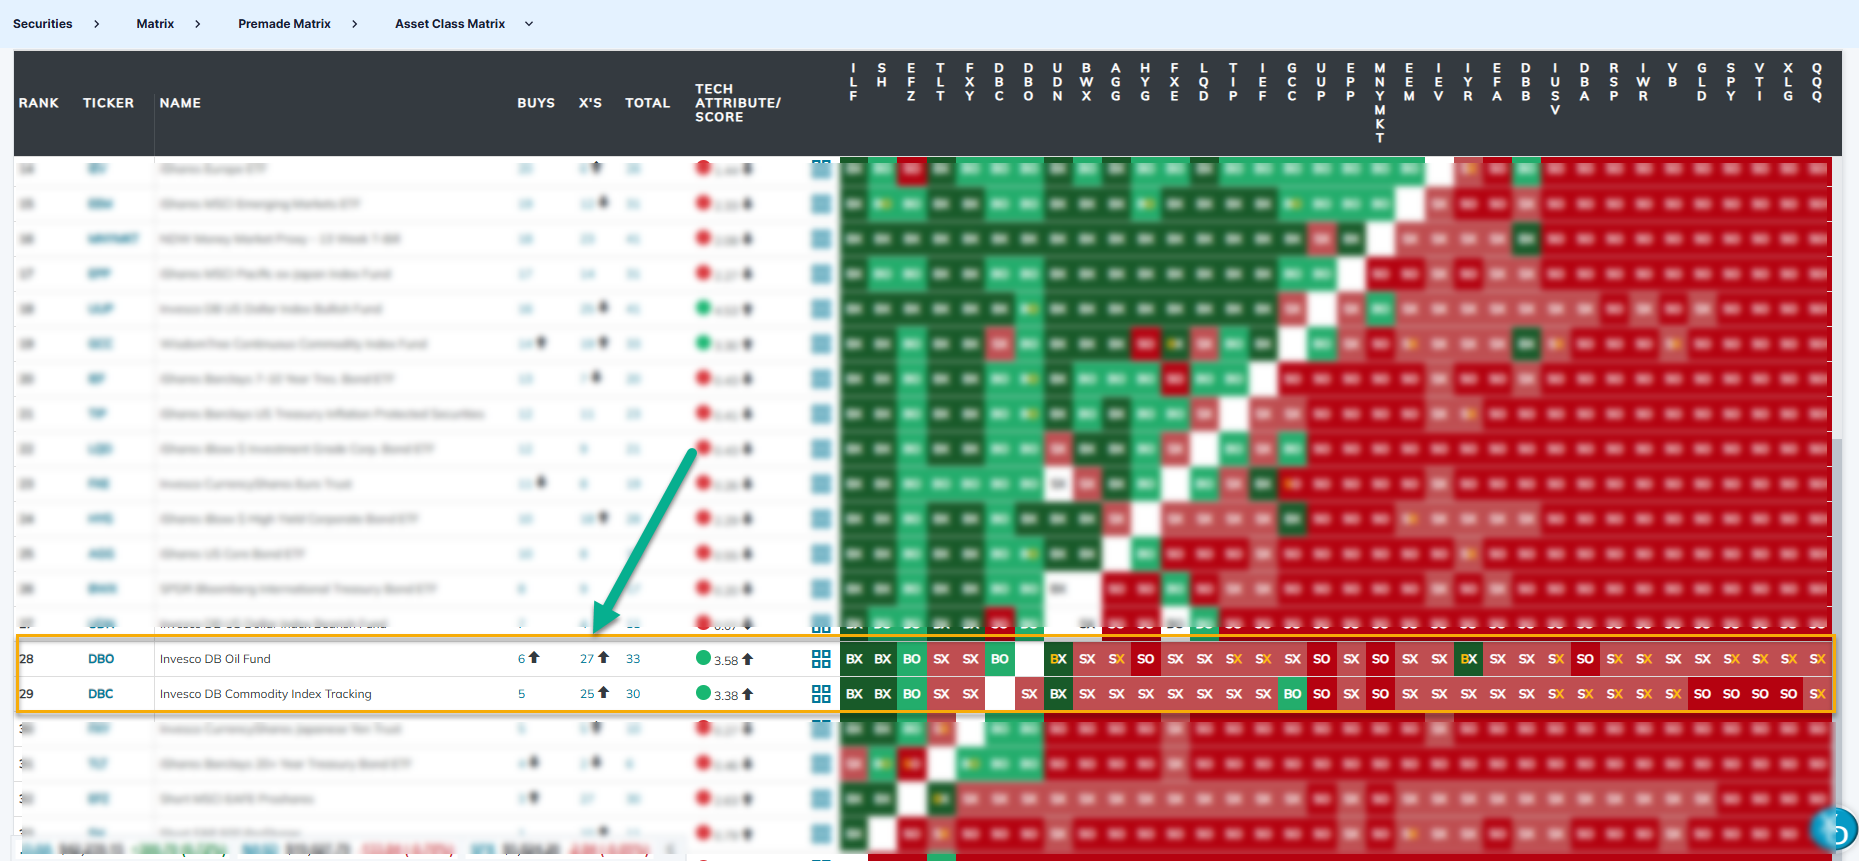
The first bullet point could be an entire pulse on its own as markets teeter on the cusp of the recent pullback being a bit more concerning than a standard 5% exhale…. We won’t visit that today. On the contrary, we will focus a bit more on where commodities picked up relative strength by focusing on two names with rank towards the bottom of the matrix at the time of this writing. DBO & DBC saw relative strength gains against nearly 20 representatives between the two of them this week. While most of them were just returns to X’s (not long-term buy signals like the underlying DALI matrix prioritizes) the trend is clear: near-term strength within energy-focused areas has led to vast improvements for the broader group.

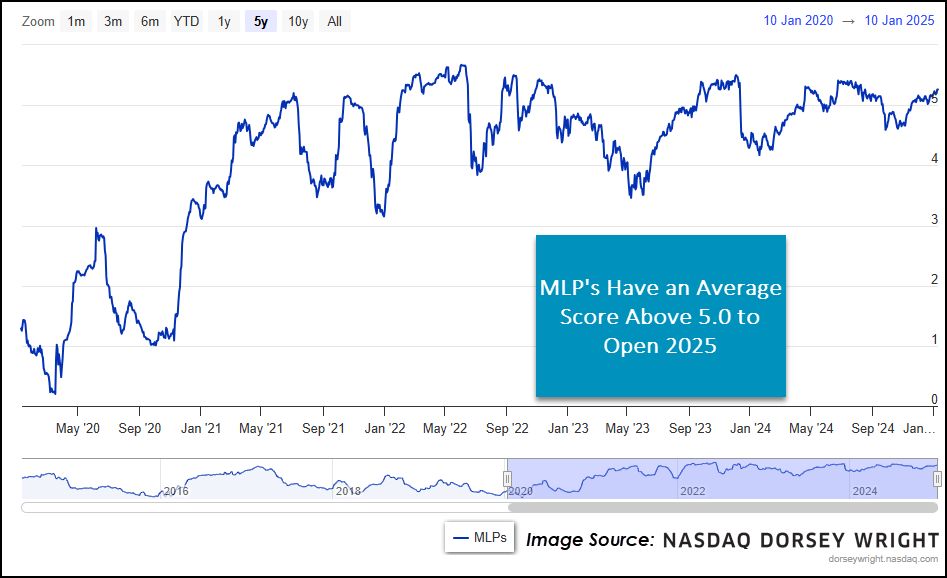
So what? What is the astute investment manager to do? Well, looking at the overall intra-asset rankings, energy-focused areas have moved into second place… falling just behind agriculture in first. From DALI’s perspective, things have improved enough to keep energy names on the radar. But that long-term relative strength for energy-focused commodities has yet to spill over into energy-based equities, ones that many of your clients may be familiar with. Keep this in mind when looking to add exposure, there are still signs that things could be rocky for energy in the near-term as things sort themselves out. One area that has shown some resilience has been the Master Limited Partnership (MLP) group, which ranks highly on the asset class group scores page. It is the top-ranked group with an average score of 5.26 across 38 representatives. A handful of representatives have strong technical pictures. MLPX sits on a string of buy signals, but keep in mind the fund does issue a K-1 tax form for next tax season many advisors are unwilling to entertain. If that isn’t an issue, the list of available options broadens out quite substantially.

The US Dollar has risen over the several months, advancing to a new multi-year high of 109.97 last Friday (1/10). That was intraday high was enough to notch a 10% rally from the recent low of 99.578 seen on July 14, 2023, placing us in a rising dollar environment based on our historical US Dollar Study. Therefore, we will take the opportunity to show how various assets and segments of the market are affected by the rise and fall of the greenback.
What is the US Dollar Index (DX/Y)?
To begin we should first explain that the US Dollar Index (DX/Y) is priced in terms of a weighted basket of major foreign currencies. When we hear about movements in "the dollar," it is typically this index that is being referenced. Today, the US Dollar Index contains six component currencies, which are "trade-weighted": the Euro, Japanese Yen, British Pound, Canadian Dollar, Swedish Krona, and Swiss Franc. The currency weights contributing to the pricing of this Index are as follows:

As mentioned above, DX/Y rose back to 109.50 on its default chart on January 10, and the actual intraday high ticked above our 10% rally threshold for the first time in the current ascent. The 10% demarcation between rising/falling dollar environments is just a useful guideline, not a technical indicator that a trend will continue. Therefore, investors should not necessarily make big shifts in their allocations based on just the 10% rally. However, the technical strength of the dollar has been improving consistently since last October. We do show near-term support offered at 108, while further confirmation would be given with a potential third consecutive buy signal that would be seen at 110.

Our data on the ICE U.S. Dollar Spot Index goes back to the inception of futures contracts on the U.S. Dollar Index (in 1985). Since that time, we have seen many significant moves for the dollar, allowing us to see how different assets perform in different dollar environments.
Study Parameters:
Rising Dollar Market: Any move of at least 10% from a low constitutes a new "rising dollar market." The beginning of this trend is established at the low watermark and the trend remains in force until a correction of at least 10% occurs, at which point the peak of that rally then marks the end of the rising trend in the dollar. This represents a "trough to peak" move in the dollar, and that period is what we use to qualify a rising dollar market.
Falling Dollar Market: Any decline of at least 10% in the dollar index from a peak begins a "falling dollar market." The beginning of this trend is established at the high watermark and the trend remains in force until a rally of at least 10% occurs off a low, at which point the trough of that decline marks the end of the falling trend in the dollar. This represents a "peak to trough" move in the dollar, and the period within is what we use to qualify a falling dollar market.
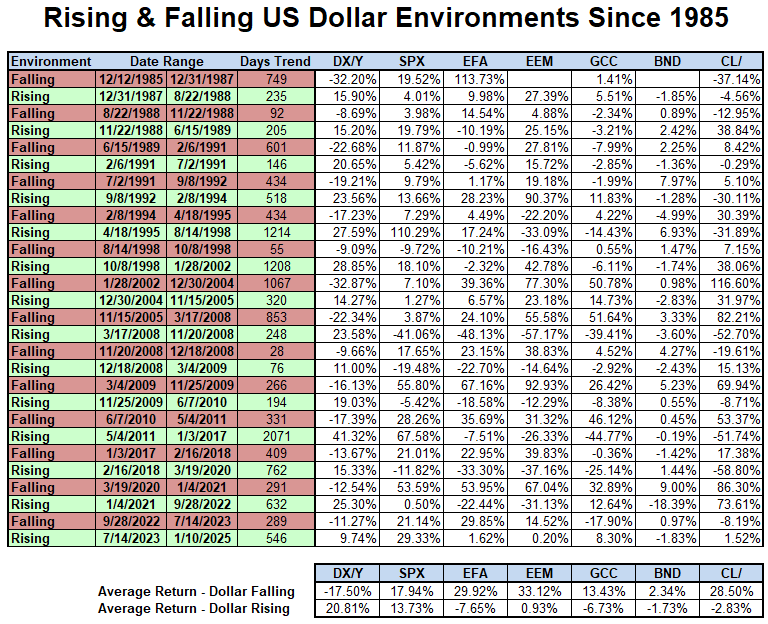
By this measure, there have been a total of 14 falling dollar markets and 14 rising dollar markets since 1985 (including the current environment). The average duration of a cycle (rising or falling) is 510 days, which results in moves of around 20% in either direction for the dollar (keep in mind that the manner in which these trends were calculated means that no trend could have resulted in a move materially less than 10% in either direction).
On average, rising dollar periods have lasted longer than falling dollar periods, at respective averages of 598 and 421 days. The previous rising dollar environment was slightly longer than average at 632 days, ending in September 2022, which saw DX/Y gain 25%. Below we have a summary of the prior rising and falling environments, paired with the returns of major asset benchmarks during each period.
The graphic below delves further into the average returns of various asset class representatives in different dollar environments. The results were interesting as many assets did show meaningful performance biases during either rising or falling dollar markets. The red bars in the graphics below represent the average performance during all falling dollar markets, while the green bars represent the average performance by that same asset class during all rising dollar markets. For some assets, we did not have data going back to 1985, so returns reflect the average since the time at which we had data, with all assets having data going back to at least 1995.
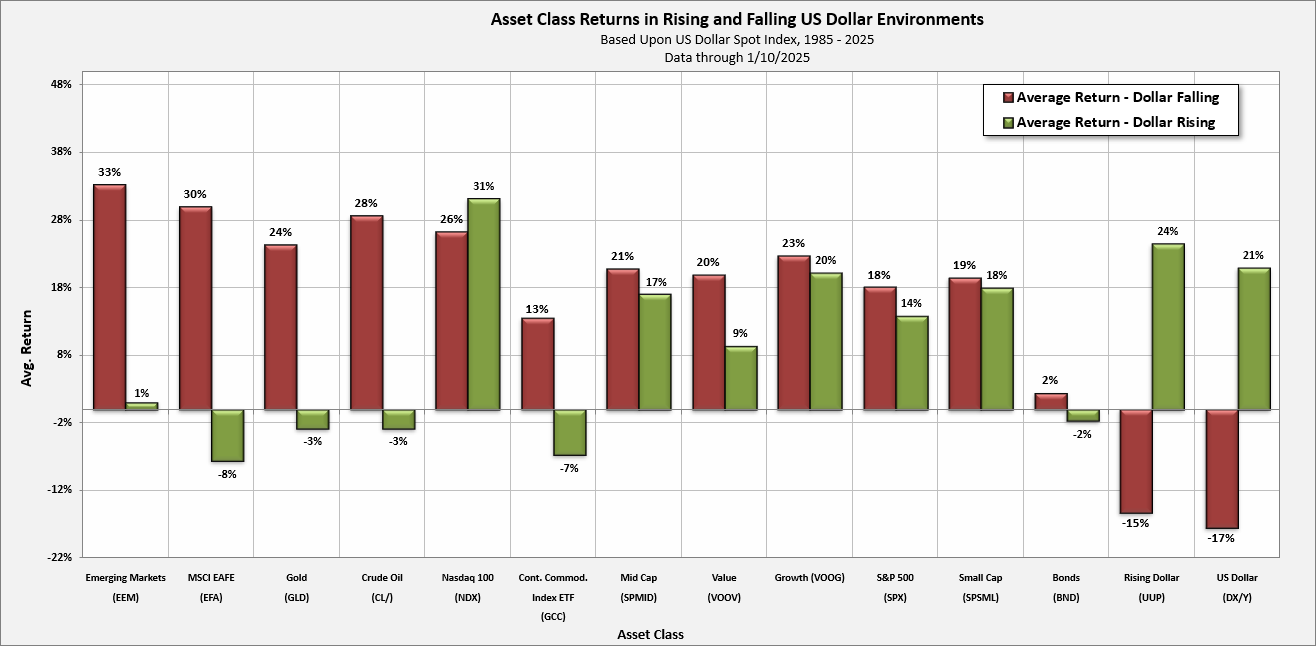
Observations:
Of course, there is a significant amount of variation among the companies that make up the broad US equity market and, being big believers in sector rotation, we would be remiss if we didn’t take a closer look to see how the various segments were impacted by the dollar. Although we had to adjust the time frame of the study a bit based on data availability; the sector portion of our study includes data beginning in 1992. Our study includes the 11 broad sectors (basic materials, consumer cyclicals, consumer non-cyclicals, energy, financials, healthcare, industrials, technology, telecommunications/comm services, real estate, and utilities). The results of the study are shown below, following the same structure as the broader study.

Observations:
Even though commodities just moved into the second position in our DALI asset class rankings, it is a generally accepted principle that commodities tend to do worse in a rising dollar environment. A myriad of variables from weather to OPEC impact the supply and demand for and price of commodities. Because commodities are denominated in US dollars, currency movements can also have a material impact on price and performance. Said more directly, with a rising dollar, commodities become more expensive for overseas buyers, theoretically hurting demand. Commodities also do not show the same magnitude of underperformance in rising environments as international equities, which makes sense with commodities moving ahead of international equities in DALI. The graph below shows the average performance of four ETFs representing different areas of the commodities complex, copper (industrial metals), energy, gold (precious metals), and agriculture.

Observations:
Overall, the data clearly illustrates that there are assets whose performance tends to materially change in rising vs. falling dollar environments. However, the last few periods also showed that while the dollar can be an important factor, it is not the only variable affecting the price movement of these assets. With that said, keep these historical tendencies in mind as we look toward 2025.
Average Level
-32.97
| < - -100 | -100 - -80 | -80 - -60 | -60 - -40 | -40 - -20 | -20 - 0 | 0 - 20 | 20 - 40 | 40 - 60 | 60 - 80 | 80 - 100 | 100 - > |
|---|---|---|---|---|---|---|---|---|---|---|---|
|
Sell signaltlt
|
|||||||||||
|
Sell signalVOOV
|
|||||||||||
|
Sell signalief
|
Sell signalijr
|
||||||||||
|
Sell signaleem
|
Buy signaldia
|
||||||||||
|
Sell signallqd
|
Buy signaliwm
|
Buy signalQQQ
|
|||||||||
|
Sell signalagg
|
Sell signalefa
|
Buy signalXLG
|
|||||||||
|
Sell signalicf
|
Sell signalfxe
|
Buy signalIJH
|
Buy signalSPY
|
Buy signalONEQ
|
Buy signalgcc
|
||||||
|
Buy signaldvy
|
Buy signalrsp
|
Buy signalhyg
|
Buy signalshy
|
Buy signalVOOG
|
Buy signalGLD
|
Buy signaldx/y
|
Buy signalUSO
|
Buy signalgsg
|
|||
| < - -100 | -100 - -80 | -80 - -60 | -60 - -40 | -40 - -20 | -20 - 0 | 0 - 20 | 20 - 40 | 40 - 60 | 60 - 80 | 80 - 100 | 100 - > |
| AGG | iShares US Core Bond ETF |
| USO | United States Oil Fund |
| DIA | SPDR Dow Jones Industrial Average ETF |
| DVY | iShares Dow Jones Select Dividend Index ETF |
| DX/Y | NYCE U.S.Dollar Index Spot |
| EFA | iShares MSCI EAFE ETF |
| FXE | Invesco CurrencyShares Euro Trust |
| GLD | SPDR Gold Trust |
| GSG | iShares S&P GSCI Commodity-Indexed Trust |
| HYG | iShares iBoxx $ High Yield Corporate Bond ETF |
| ICF | iShares Cohen & Steers Realty ETF |
| IEF | iShares Barclays 7-10 Yr. Tres. Bond ETF |
| LQD | iShares iBoxx $ Investment Grade Corp. Bond ETF |
| IJH | iShares S&P 400 MidCap Index Fund |
| ONEQ | Fidelity Nasdaq Composite Index Track |
| QQQ | Invesco QQQ Trust |
| RSP | Invesco S&P 500 Equal Weight ETF |
| IWM | iShares Russell 2000 Index ETF |
| SHY | iShares Barclays 1-3 Year Tres. Bond ETF |
| IJR | iShares S&P 600 SmallCap Index Fund |
| SPY | SPDR S&P 500 Index ETF Trust |
| TLT | iShares Barclays 20+ Year Treasury Bond ETF |
| GCC | WisdomTree Continuous Commodity Index Fund |
| VOOG | Vanguard S&P 500 Growth ETF |
| VOOV | Vanguard S&P 500 Value ETF |
| EEM | iShares MSCI Emerging Markets ETF |
| XLG | Invesco S&P 500 Top 50 ETF |

| Symbol | Company | Sector | Current Price | Action Price | Target | Stop | Notes |
|---|---|---|---|---|---|---|---|
| TT | Trane Technologies PLC | Building | $377.12 | 368-lo 400s | 468 | 336 | 5 TA rating, top 20% of BUIL sector matrix, consec buy signals, LT RS buy, LT pos trend |
| COR | Cencora Inc. | Drugs | $236.19 | hi 220s - low 240s | 300 | 212 | 5 for 5'er, top third of DRUG sector matrix, LT pos mkt RS, spread triple top, Earn. 1/29 |
| CWST | Casella Waste Systems, Inc. | Waste Management | $106.93 | 100 - 110 | 135 | 91 | 4 for 5'er, LT pos mkt RS, spread triple top |
| ORLY | O'Reilly Automotive, Inc. | Autos and Parts | $1197.60 | 1200s | 1616 | 1008 | 5 TA rating, top third of AUTO sector matrix, consec. buy signals, LT pos trend, LT RS buy, Earn. 2/5 |
| BKU | Bankunited Inc. | Banks | $36.87 | hi 30s - low 40s | 65 | 33 | 4 for 5'er, top 20% of favored BANK sector matrix, one box from peer RS buy, spread triple top, R-R>2.0, 2.8% yield, Earn. 1/24 |
| PEG | Public Service Enterprise Group Inc. | Utilities/Electricity | $84.23 | 82 - 90 | 122 | 71 | 4 for 5'er, top quintile of EUTI sector matrix, one box from mkt RS buy signal, buy on pullback, 2.8% yield |
| COST | Costco Wholesale Corporation | Retailing | $936.94 | 940s - 1010 | 1288 | 792 | 5 TA rating, LT pos trend, LT RS buy, top 50% of RETA sector matrix, price consolidation |
| GLNG | Golar LNG Ltd | Oil Service | $41.38 | hi 30s - lo 40s | 65 | 33 | 5 TA rating, top 20% of OILS sector matrix, LT pos trend, R-R > 3, buy-on-pullback |
| LPX | Louisiana-Pacific Corporation | Forest Prods/Paper | $105.09 | 97-110 | 173 | 87 | 5 TA rating, top half of FORE sector matrix, LT RS buy, R-R > 4, buy-on-pullback |
| REVG | REV Group Inc | Autos and Parts | $32.51 | hi 20s - lo 30s | 54 | 25 | 5 TA rating, top quintile of AUTO sector matrix, LT RS buy, LT pos trend, buy-on-pullback, R-R > 3 |
| TMUS | T-Mobile US Inc. | Telephone | $211.30 | mid 200s - mid 220s | 256 | 184 | 5 for 5'er, top half of favored TELE sector matrix, LT pos peer & mkt RS, triple top, buy on pullback, Earn. 1/23 |
| USFD | US Foods Holding Corp. | Food Beverages/Soap | $67.35 | 65-lo 70s | 85 | 58 | 5 TA rating, top 20% of FOOD sector RS matrix, LT pos trend, LT RS buy, R-R > 2. |
| JCI | Johnson Controls International PLC | Building | $78.66 | hi 70s - lo 80s | 99 | 64 | 4 TA rating, top half BUIL sector matrix, LT RS buy, buy-on-pullback |
| ACM | AECOM | Building | $105.87 | mid 100s - low 110s | 122 | 91 | 4 for 5'er, top half of BUIL sector matrix, LT pos mkt RS, multiple buy signals, buy on pullback, Earn. 2/3 |
| PNR | Pentair Inc | Machinery and Tools | $96.97 | hi 90s - low 100s | 125 | 82 | 5 for 5'er, top 20% of MACH sector matrix, buy on pullback, 1% yield, Earn. 1/28 |
| ANET | Arista Networks Inc | Telephone | $114.34 | 108 - 116 | 145 | 92 | 5 for 5'er, top third of TELE sector matrix, LT pos mkt RS, buy on pullback |
| Symbol | Company | Sector | Current Price | Action Price | Target | Stop | Notes |
|---|---|---|---|---|---|---|---|
| FL | Foot Locker, Inc. | Retailing | $20.53 | 22 - 25 | 16 | 27 | 0 for 5'er, bottom 10% of RETA sector matrix, multiple sell signals |
| ACGL | Arch Capital Group Ltd. | Insurance | $90.17 | lo 90s - hi 80s | 72 | 104 | 1 TA rating, lower 10% of INSU sector matrix, neg trend change, consec. sell signals |
| Comment | |||||||
|---|---|---|---|---|---|---|---|
|
|
|||||||
ANET Arista Networks Inc R ($112.50) - Telephone - ANET is a 5 for 5'er that ranks 10th out of 39 names in the favored telephone sector matrix and has been on a market RS buy signal since 2021. On its default chart, the stock has completed three consecutive buy signals and reached a new all-time earlier this month. ANET has now pulled back to just above prior support, offering an entry point for long exposure. Positions may e added in the $108 - $116 range and we will set our initial stop at $92, which would take out multiple levels of support and violate its bullish support line. We will use the bullish price objective, $145, as our target price.
| 25 | |||||||||||||||||||||||||||||
| 120.00 | X | 120.00 | |||||||||||||||||||||||||||
| 118.00 | X | O | 118.00 | ||||||||||||||||||||||||||
| 116.00 | X | 1 | O | 116.00 | |||||||||||||||||||||||||
| 114.00 | X | O | X | O | 114.00 | ||||||||||||||||||||||||
| 112.00 | X | O | X | 112.00 | |||||||||||||||||||||||||
| 110.00 | X | X | O | X | 110.00 | ||||||||||||||||||||||||
| 108.00 | X | O | X | O | 108.00 | ||||||||||||||||||||||||
| 106.00 | X | X | O | X | Mid | 106.00 | |||||||||||||||||||||||
| 104.00 | X | X | X | O | C | O | 104.00 | ||||||||||||||||||||||
| 102.00 | X | O | X | O | X | O | X | 102.00 | |||||||||||||||||||||
| 100.00 | X | O | X | O | X | O | X | 100.00 | |||||||||||||||||||||
| 99.00 | X | O | X | O | B | O | X | 99.00 | |||||||||||||||||||||
| 98.00 | X | A | O | X | O | X | O | X | 98.00 | ||||||||||||||||||||
| 97.00 | X | O | X | O | X | O | X | O | X | 97.00 | |||||||||||||||||||
| 96.00 | X | O | X | O | O | O | X | 96.00 | |||||||||||||||||||||
| 95.00 | X | O | O | X | 95.00 | ||||||||||||||||||||||||
| 94.00 | X | O | X | • | 94.00 | ||||||||||||||||||||||||
| 93.00 | X | O | • | 93.00 | |||||||||||||||||||||||||
| 92.00 | • | X | • | 92.00 | |||||||||||||||||||||||||
| 91.00 | X | • | X | X | • | 91.00 | |||||||||||||||||||||||
| 90.00 | X | O | • | • | X | O | X | • | 90.00 | ||||||||||||||||||||
| 89.00 | X | O | • | X | X | • | • | X | O | X | • | 89.00 | |||||||||||||||||
| 88.00 | 8 | O | X | O | X | O | X | • | X | O | • | 88.00 | |||||||||||||||||
| 87.00 | X | O | X | O | X | O | X | O | X | • | Bot | 87.00 | |||||||||||||||||
| 86.00 | X | O | X | O | O | X | O | X | • | 86.00 | |||||||||||||||||||
| 85.00 | X | O | X | O | 9 | X | • | 85.00 | |||||||||||||||||||||
| 84.00 | X | O | X | X | O | X | • | 84.00 | |||||||||||||||||||||
| 83.00 | X | O | X | O | X | O | X | • | 83.00 | ||||||||||||||||||||
| 82.00 | X | O | X | O | X | O | X | • | 82.00 | ||||||||||||||||||||
| 81.00 | X | O | X | O | X | O | X | • | 81.00 | ||||||||||||||||||||
| 80.00 | X | O | X | O | O | X | • | 80.00 | |||||||||||||||||||||
| 79.00 | X | O | X | • | O | • | 79.00 | ||||||||||||||||||||||
| 78.00 | X | O | X | • | • | 78.00 | |||||||||||||||||||||||
| 77.00 | O | X | • | 77.00 | |||||||||||||||||||||||||
| 76.00 | O | X | • | 76.00 | |||||||||||||||||||||||||
| 75.00 | O | X | • | 75.00 | |||||||||||||||||||||||||
| 74.00 | • | O | X | • | 74.00 | ||||||||||||||||||||||||
| 73.00 | O | • | 73.00 | ||||||||||||||||||||||||||
| 25 |
| ANF Abercrombie & Fitch Co. ($133.15) - Retailing - ANF reversed into Os and broke a double bottom at $148 to return to a sell signal as shares fell to $130, violating multiple levels of near-term support and testing the bullish support line at $130. Additionally, ANF sits within one box of reversing into Os on its market RS chart, leading two potential attributes at stake for the 3 for 5'er. Beyond the bullish support line, additional support lies at $122. |
| BOOT Boot Barn Holdings Inc ($155.65) - Retailing - BOOT broke a double top at $164 for a fifth consecutive buy signal as the stock rallied to market the 2024 chart high at $168. The stock is a 4 for 5'er that ranks in the top half of the Retailing sector matrix. Shares took a step back into the $150s following the breakout and to an actionable level on the chart. Initial support lies at $154, while additional lies at $144, the bullish support line. |
| CAVA CAVA Group, Inc. ($110.97) - Restaurants - CAVA broke a spread triple bottom at $110 for a second sell signal. CAVA remains a 4 for 5'er, but it resides within one box of reversing into Os on its peer RS chart and has shown negative near-term RS against the market since the latter part of December. From here, support now lies at $97, while the bullish support line sits at $92. |
| CEIX CONSOL Energy Inc. ($101.95) - Oil - CEIX gave a second consecutive sell signal and violated its trend line on Monday when it broke a double bottom at $100; the stock continued lower to $94, where it now sits against support. The negative trend change will drop CEIX to an unfavorable 2 for 5'er, |
| CF CF Industries Holdings, Inc. ($95.50) - Chemicals - CF gained more than 7.5% on Monday and returned to a buy signal when it broke a double top at $95, marking a new multi-year high for the stock. Monday's move adds to an already positive technical picture as CF is a 4 for 5'er and ranks in the top decile of the chemicals sector matrix. From here, the first level of support sits at $87 |
| CW Curtiss Wright Corporation ($349.97) - Aerospace Airline - CW joins the growing list of names posting multiple sell signals off of all time highs. The stock does remain a 5/5'er, but bulls may perhaps be best suited waiting for a bit of confirmation that support at current levels is strong. Below $344, traditional PnF support isn't seen until $292. Towards the upside, bulls will eye all time highs in between $384 and $392. |
| DEO Diageo (United Kingdom) ADR ($116.52) - Food Beverages/Soap - Shares of DEO broke a double bottom at $116 for its second consecutive sell signal. The 0 for 5’er has been trading in a negative trend since 2023 and has been on a market RS sell signal since 2014. The weight of the technical evidence continues to point against Diageo, making it a stock to avoid. From here, its next support comes at $102 from DEO’s 2020 low. |
| DJT Trump Media & Technology Group Corp. ($40.96) - Internet - DJT pushed higher Monday to break a double top at $38 before rising over 16% to $41 intraday. This 5 for 5’er has shown significant volatility with an RRisk score north of 7, but has been in a positive trend since the end of October. The stock also sits in the top quintile of the favored internet sector RS matrix. Initial support can be seen at $34 with further support at $33. Further overhead resistance may be seen at $45 and $54. |
| MNDY monday.com Ltd. ($211.24) - Software - MNDY fell Monday to break a double bottom at $212, marking a second consecutive sell signal. This 2 for 5’er moved to a negative trend in December and sits in the bottom decile of the software sector RS matrix. The weight of the technical evidence is weak and continues to deteriorate. However, the stock is not entering oversold territory. Further support can be seen at $190 from last August. Overhead resistance may be seen initially at $244 with more notable resistance around $300. |
| X United States Steel Corporation ($36.34) - Steel/Iron - X returned to a buy signal and a positive trend Monday when it broke a double top at $36. The positive trend change will promote X to a 4 for 5'er. From here, support can be found at $30, while overhead resistance now sits at $41. |

| Name | Option Symbol | Action | Stop Loss |
|---|---|---|---|
| Apple Inc. - $234.40 | O: 25C230.00D21 | Buy the March 230.00 calls at 13.30 | 212.00 |
| Name | Option | Action |
|---|---|---|
| Paypal Holdings Inc ( PYPL) | Feb. 90.00 Calls | Stopped at 82.00 (CP: 83.65) |
| Name | Option Symbol | Action | Stop Loss |
|---|---|---|---|
| PDD Holdings Inc. - $96.43 | O: 25O100.00D21 | Buy the March 100.00 puts at 10.15 | 104.00 |
| Name | Option | Action |
|---|---|---|
|
|
||
| Name | Option Sym. | Call to Sell | Call Price | Investment for 500 Shares | Annual Called Rtn. | Annual Static Rtn. | Downside Protection |
|---|---|---|---|---|---|---|---|
| Tapestry Inc. $ 67.15 | O: 25C67.50D21 | Mar. 67.50 | 3.50 | $ 31,895.45 | 25.99% | 23.90% | 4.20% |
| Name | Action |
|---|---|
| Fortinet Inc. ( FTNT) - 94.56 | Sell the March 97.50 Calls. |
| Pure Storage ( PSTG) - 64.73 | Sell the March 65.00 Calls. |
| Pure Storage ( PSTG) - 64.73 | Sell the March 65.00 Calls. |
| Norwegian Cruise Line Holdings Ltd. ( NCLH) - 25.79 | Sell the March 27.00 Calls. |
| Synchrony Financial ( SYF) - 63.77 | Sell the May 70.00 Calls. |
| GoDaddy Inc. ( GDDY) - 192.86 | Sell the May 200.00 Calls. |
| Vistra Corp ( VST) - 166.73 | Sell the February 165.00 Calls. |
| Marvell Technology Inc. ( MRVL) - 114.32 | Sell the March 125.00 Calls. |
| HP Inc ( HPQ) - 33.20 | Sell the May 34.00 Calls. |
| Name | Covered Write |
|---|---|
| Shake Shack Inc ( SHAK - 128.43 ) | March 140.00 covered write. |
| Dell Technologies Inc Class C ( DELL - 114.77 ) | March 125.00 covered write. |
Daily Equity & Market Analysis
Loading, Please Wait...

