Most Requested Symbols

With volatility near its lowest point of the year, we examine the process for hedging a portfolio using ETF options.
NDW Morning Pulse - August 14, 2026
Below are highlights from the NDW Morning Update Video for the morning of 08/13. Access the the video on the NDW Morning Update Video page.

With CPI data coming in line with expectations this Wednesday morning, the CBOE SPX Volatility Index (VIX) fell to 14.5, its lowest level since January. However, there remains an elevated level of uncertainty in the market on top of entering what has historically been a volatile period for the market. Despite a relatively cool CPI reading, the fed futures market is still pricing in a better than 65% chance that the Fed will raise interest rates by at least 25 bps by the end of the year, there still has been no clear resolution to the conflict with Iran, and mid-term elections are on the horizon. Meanwhile, we’re only about two weeks away from the beginning of September, which has historically been the worst month of the year for US equities.
With heightened uncertainty and the low volatility (as measured by the VIX) making it relatively cheap to do, this is an opportune time to consider hedging your exposure. Our example later will focus on fully hedging a portfolio with at-the-money puts through the rest of the year, but this can be adjusted depending on client needs and cost constraints. For example, instead of hedging against any decline, clients may only want to hedge against a decline of more than 5% or only half the value of their respective portfolio. In any case, there is flexibility for any situation.
Given the level of concentration in the market – five stocks ((NVDA), (AAPL), (MSFT), currently account for almost 30% of the S&P 500 (SPX) – we’ll look at options on the Invesco QQQ Trust (QQQ), which is heavily concentrated in the largest stocks in the market. But any ETF with liquid options can be used in the same way. If you wanted to create a broader hedge, you could use options on SPY or if you wanted to only hedge semiconductor exposure you could use options on the iShares Semiconductor ETF (SOXX).
Like single stock options, ETF options are usually physically settled, i.e., if you exercise a put option on an ETF or hold it to expiration, you will be expected to deliver the underlying ETF at the strike price; therefore, it may benefit you to close any ETF option positions you have before expiry.

The hedging calculation above assumes a one-to-one relationship in the price movement between the portfolio and the hedging ETF. If you want to increase the precision of your hedge, you can calculate a beta for your portfolio vs. the ETF. To do this, you simply calculate an ETF beta for each stock by multiplying the correlation of the stock and the ETF by the stock's standard deviation divided by the ETF's standard deviation (the standard deviation for each stock can be obtained by putting the stocks into a portfolio and enabling the "Standard Deviation" header.) You would then take a weighted average of the individual betas you calculated to get a beta for the entire portfolio. This process is outlined below.

Once you have the portfolio beta, you multiply it by the number you calculated in Step 4 above to get an adjusted number of contracts to purchase to hedge the portfolio. In this case, our result would be 6 contracts (6.8 * 0.91). In this case, incorporating a beta into our hedge made it less expensive. However, the point is not whether our hedge became cheaper or more expensive, but that we have made it more precise.
Paying more than 3% of your portfolio in option premiums is a notable outlay, although it may be prudent given the potential for volatility. Just as with auto insurance, you can lower the overall cost by increasing your deductible and/or lowering your coverage limits, thereby lowering your overall level of protection. So, instead of hedging the entire value of the portfolio, you can choose to hedge only half or whatever portion is suitable for the situation or instead of using at-the-money puts you could allow for a bit more potential downside and use out-of-the-money options.
Average Level
18.73
| < - -100 | -100 - -80 | -80 - -60 | -60 - -40 | -40 - -20 | -20 - 0 | 0 - 20 | 20 - 40 | 40 - 60 | 60 - 80 | 80 - 100 | 100 - > |
|---|---|---|---|---|---|---|---|---|---|---|---|
|
Sell signaluso
|
|||||||||||
|
Sell signalONEQ
|
Buy signalIJH
|
||||||||||
|
Buy signalxlg
|
Buy signalgld
|
||||||||||
|
Buy signaldx/y
|
Buy signaliwm
|
Buy signalSPY
|
|||||||||
|
Buy signalicf
|
Sell signalEEM
|
Buy signalVOOG
|
Buy signaldia
|
||||||||
|
Sell signaltlt
|
Sell signalagg
|
Sell signalshy
|
Sell signalQQQ
|
Buy signaldvy
|
Buy signalefa
|
Buy signalrsp
|
|||||
|
Sell signallqd
|
Sell signalief
|
Buy signalhyg
|
Sell signalfxe
|
Buy signalijr
|
Sell signalgsg
|
Buy signalVOOV
|
Buy signalgcc
|
||||
| < - -100 | -100 - -80 | -80 - -60 | -60 - -40 | -40 - -20 | -20 - 0 | 0 - 20 | 20 - 40 | 40 - 60 | 60 - 80 | 80 - 100 | 100 - > |
| AGG | iShares US Core Bond ETF |
| USO | United States Oil Fund |
| DIA | SPDR Dow Jones Industrial Average ETF |
| DVY | iShares Dow Jones Select Dividend Index ETF |
| DX/Y | NYCE U.S.Dollar Index Spot |
| EFA | iShares MSCI EAFE ETF |
| FXE | Invesco CurrencyShares Euro Trust |
| GLD | SPDR Gold Trust |
| GSG | iShares S&P GSCI Commodity-Indexed Trust |
| HYG | iShares iBoxx $ High Yield Corporate Bond ETF |
| ICF | iShares Cohen & Steers Realty ETF |
| IEF | iShares Barclays 7-10 Yr. Tres. Bond ETF |
| LQD | iShares iBoxx $ Investment Grade Corp. Bond ETF |
| IJH | iShares S&P 400 MidCap Index Fund |
| ONEQ | Fidelity Nasdaq Composite Index Track |
| QQQ | Invesco QQQ Trust |
| RSP | Invesco S&P 500 Equal Weight ETF |
| IWM | iShares Russell 2000 Index ETF |
| SHY | iShares Barclays 1-3 Year Tres. Bond ETF |
| IJR | iShares S&P 600 SmallCap Index Fund |
| SPY | SPDR S&P 500 Index ETF Trust |
| TLT | iShares Barclays 20+ Year Treasury Bond ETF |
| GCC | WisdomTree Continuous Commodity Index Fund |
| VOOG | Vanguard S&P 500 Growth ETF |
| VOOV | Vanguard S&P 500 Value ETF |
| EEM | iShares MSCI Emerging Markets ETF |
| XLG | Invesco S&P 500 Top 50 ETF |

| Symbol | Company | Sector | Current Price | Action Price | Target | Stop | Notes |
|---|---|---|---|---|---|---|---|
| ZION | Zions Bancorporation | Banks | $71.92 | mid-to-hi 60s | 87 | 55 | 4 for 5'er, top half of favored BANK sector matrix, new RS buy signal, buy on pullback, R-R~2.0, 2.5% yield |
| FR | First Industrial Realty Trust | Real Estate | $63.34 | mid-to-hi 60s | 86 | 59 | 4 for 5'er, top 25% of REAL sector matrix, LT pos peer RS, spread sextuple top, R-R>2.0, 2.9% yield |
| CB | Chubb Ltd | Insurance | $343.33 | mid 340s - mid 360s | 456 | 308 | 4 for 5'er, pos. trend since 2023, LT Mkt RS buy since May '24, Reward to Risk > 4. |
| BFH | Bread Financial Holdings Inc. | Business Products | $110.45 | 100 - 110 | 129 | 89 | 5 for 5'er, top 20% of favored BUSI sector matrix, LT pos peer & mkt RS |
| FITB | Fifth Third Bancorp | Banks | $58.01 | mid to upper 50s | 84 | 46 | 4 for 5'er since March '24, pos. LT Peer RS since March '09, LT pos. trend since Dec. '23. |
| HIG | Hartford Insurance Group Inc/The | Insurance | $137.44 | hi 130s - 140s | 164 | 126 | 5 for 5'er, LT pos peer & mkt RS, bullish catapult, good R-R, 1.65% yield |
| NIC | Nicolet Bankshares Inc | Banks | $177.41 | mid 160s - mid 170s | 196 | 148 | 5 for 5'er, top third of favored BANK sector matrix, LT pos peer RS, shakeout to triple top |
| AER | AerCap Holdings NV | Aerospace Airline | $150.25 | hi 140s - mid 150s | 184 | 130 | 5 for 5'er, Rev. in Xs on Peer RS 7/29, LT pos. Peer and Mkt RS, Pos. trend since Apr. '25. |
| BNY | Bank of New York Mellon Corporation | Banks | $162.93 | low 150s to 160 | 192 | 130 | 5 for 5'er since Sept. '24, top 10% of Banks matrix, LT peer and mkt RS, Pos. trend since Nov. '23. |
| GD | General Dynamics Corporation | Aerospace Airline | $394.21 | 380s - low 390s | 424 | 340 | 4 for 5'er, Pos. ST Peer RS, Pos. LT & ST Mkt RS, Pos. trend and buy signal since June, ATH 7/29. |
| MRK | Merck & Co., Inc. | Drugs | $132.92 | 122 - mid 130s | 168 | 106 | 5 TA rating, top half of drugs sector RS matrix, recent bullish triangle, buy-on-pullback |
| TXRH | Texas Roadhouse, Inc. | Restaurants | $214.31 | 190s - 200s | 262 | 172 | 5 for 5'er, top half of favored REST sector matrix, LT pos peer & mkt RS, good R-R, 1.4% yield |
| GHRS | GH Research Plc | Biomedics/Genetics | $30.24 | 28 - 33 | 46.50 | 24 | 5 for 5'er, LT Mkt. since Feb. '25, top quintile of Bio. matrix, matched chart high on 8/7. |
| GSL | Global Ship Lease Inc. | Transports/Non Air | $41.24 | low 40s | 55 | 35 | 4 for 5'er, favored TRAN sector, LT pos mkt RS, R-R~2.0, 6% yield |
| SXT | Sensient Technologies Corporation | Chemicals | $130.33 | 124 - 132 | 176 | 106 | 4 for 5'er, Pos. LT Peer RS, Top 5 of Chemicals matrix, Pos. Trend since 4/26, ATH on 8/6. |
| Symbol | Company | Sector | Current Price | Action Price | Target | Stop | Notes |
|---|
| Symbol | Company | Sector | Current Price | Action Price | Target | Stop | Notes |
|---|---|---|---|---|---|---|---|
| CM | Canadian Imperial Bank of Commerce | Banks | $120.90 | 100s | 165 | 90 | Removed for earnings on 8/27. Raise stop to $104. |
| DLTR | Dollar Tree, Inc. | Retailing | $128.61 | hi 110s - 120s | 186 | 104 | Removed for earnings on 8/27. Maintain $104 stop. |
| Comment | |||||||
|---|---|---|---|---|---|---|---|
|
|
|||||||
SXT Sensient Technologies Corporation R ($131.01) - Chemicals - SXT has been a 4 for 5’er since April of this year, following a reversal back into Xs on both the market and peer relative strength charts. In addition to positive near-term relative strength, SXT ranks 5th (out of 46) in the Chemicals sector matrix and maintained a long-term peer RS buy signal. On the trend chart, SXT has traded within a positive trend since April of this year and returned to a buy signal in the latter half of July. August’s trading brought a second buy signal and all-time chart high at $132. Okay to consider in the $124 to $132 range. The bullish price objective of $176 will serve as the price target, bringing the reward to risk ratio above 4. The initial stop will be set for $106.
| 132.00 | X | 132.00 | |||||||||||||||||||||||||||
| 130.00 | X | X | 130.00 | ||||||||||||||||||||||||||
| 128.00 | X | X | O | 8 | 128.00 | ||||||||||||||||||||||||
| 126.00 | X | O | X | X | O | X | 126.00 | ||||||||||||||||||||||
| 124.00 | X | O | X | O | 7 | X | O | X | 124.00 | ||||||||||||||||||||
| 122.00 | X | O | X | O | X | X | O | X | O | 122.00 | |||||||||||||||||||
| 120.00 | X | O | X | O | X | O | X | O | X | Mid | 120.00 | ||||||||||||||||||
| 118.00 | X | O | X | X | X | O | X | O | X | O | X | 118.00 | |||||||||||||||||
| 116.00 | X | O | 5 | O | X | O | X | O | X | O | O | X | 116.00 | ||||||||||||||||
| 114.00 | X | O | X | O | X | O | X | O | X | O | X | 114.00 | |||||||||||||||||
| 112.00 | X | O | X | O | 6 | X | O | O | X | 112.00 | |||||||||||||||||||
| 110.00 | X | O | O | O | X | 110.00 | |||||||||||||||||||||||
| 108.00 | X | O | 108.00 | ||||||||||||||||||||||||||
| 106.00 | X | • | 106.00 | ||||||||||||||||||||||||||
| 104.00 | X | • | 104.00 | ||||||||||||||||||||||||||
| 102.00 | X | X | • | 102.00 | |||||||||||||||||||||||||
| 100.00 | X | O | X | • | 100.00 | ||||||||||||||||||||||||
| 99.00 | X | O | X | • | 99.00 | ||||||||||||||||||||||||
| 98.00 | • | X | O | X | • | 98.00 | |||||||||||||||||||||||
| 97.00 | O | • | X | O | X | • | 97.00 | ||||||||||||||||||||||
| 96.00 | O | • | X | O | X | • | 96.00 | ||||||||||||||||||||||
| 95.00 | O | • | X | X | O | • | 95.00 | ||||||||||||||||||||||
| 94.00 | O | • | X | O | X | • | 94.00 | ||||||||||||||||||||||
| 93.00 | O | X | • | X | O | X | • | 93.00 | |||||||||||||||||||||
| 92.00 | O | X | O | • | X | O | X | • | 92.00 | ||||||||||||||||||||
| 91.00 | O | X | O | X | O | • | Bot | 91.00 | |||||||||||||||||||||
| 90.00 | O | X | O | X | • | 90.00 | |||||||||||||||||||||||
| 89.00 | O | X | O | X | X | • | 89.00 | ||||||||||||||||||||||
| 88.00 | O | • | O | X | O | 4 | • | 88.00 | |||||||||||||||||||||
| 87.00 | • | O | X | O | X | • | 87.00 | ||||||||||||||||||||||
| 86.00 | O | X | X | O | X | • | 86.00 | ||||||||||||||||||||||
| 85.00 | O | X | O | X | O | • | 85.00 | ||||||||||||||||||||||
| 84.00 | O | X | O | X | • | 84.00 | |||||||||||||||||||||||
| 83.00 | O | O | • | 83.00 |
| FIVE Five Below Inc ($243.22) - Retailing - FIVE broke a double top at $248 for a third buy signal and to match the all-time chart high. The stock improved to a 5 for 5'er during last week's trading after seeing both the market and peer RS charts return to a column of Xs. Look for consoldiation around the $240 range along with a normalization of the 10-week trading band before considering. Initial support lies at $232, while additional lies at $194. |
| GLNG Golar LNG Ltd ($51.60) - Oil Service - GLNG returned to a buy signal and a positive trend Thursday when it broke a triple top at $53. The outlook for the stock remains negative, however, as even with the positive trend change GLNG is an unfavorable 2 for 5'er. From here, overhead resistance sits at $57. Meanwhile, support can be found at $48. |
| INTU Intuit Inc. ($360.58) - Software - Shares of INTU broke a spread triple top at $340 for its fifth consecutive buy signal. Intuit has rallied sharply off of its June bottom, regaining near-term relative strength before moving back into a positive trend today. The now 3 for 5'er is back to being a hold but is in overbought territory near the top of its ten week trading band. Initial resistance lies at $360 then $416. |
| LYV Live Nation Entertainment Inc. ($186.37) - Leisure - LYV broke a double top at $188 for a fifth buy signal and to match the all-time chart high. The stock has been a 5 for 5'er since July and currently ranks within the top half of the Leisure sector matrix. Okay to consider here on the breakout or on a pullback to the upper $170s. Initial support lies at $176, while the bullish support line resides at $172. |
| SBUX Starbucks Corporation ($109.51) - Restaurants - SBUX broke a quadruple top at $110 to return to a buy signal and bring the stock to its highest level since early 2025. The stock has been a 3 for 5'er since April and maintians positive long-term peer RS and short-term market RS. Okay to consider here on the breakout or on a pullback to the low $100 range. Initial support lies at $102, while the bullish support line sits at $96. |
| WDAY Workday Inc. ($207.95) - Software - Shares of WDAY exploded higher on Thursday, rising almost 20% for its fourth consecutive buy signal. The 4 for 5'er is a solid name after its intense rally, but is in extremely overbought territory well above the top of its ten week trading band. Those looking to buy should wait for consolidation or pullback to the $170s. |

The option suggestions featured here are pulled from the NDW Options Ideas tool. These are just a sample of the ideas that can be found there. The Options Idea tool contains numerous additional income and speculative plays. It also offers relative strength-based screens targeting the highest (and lowest) relative strength stocks and ETFs that have recently moved counter to their longer-term trend. To access or subscribe to the Options Ideas tool, click here.
Call
ExxonMobil Holdings Corp. (XOM) Nov 20 $155 Call

| Additional Data: | |
| Bid/Ask Spread | 6.05% |
| Delta | 61.71 |
| Gamma | 1.78 |
| Implied Volatility | 28.52% |
| Expiry Date | 99 |
| Earnings Date | 10/30/2026 |
Put
Bloom Energy Corporation A (BE) Nov 20 $240 Put
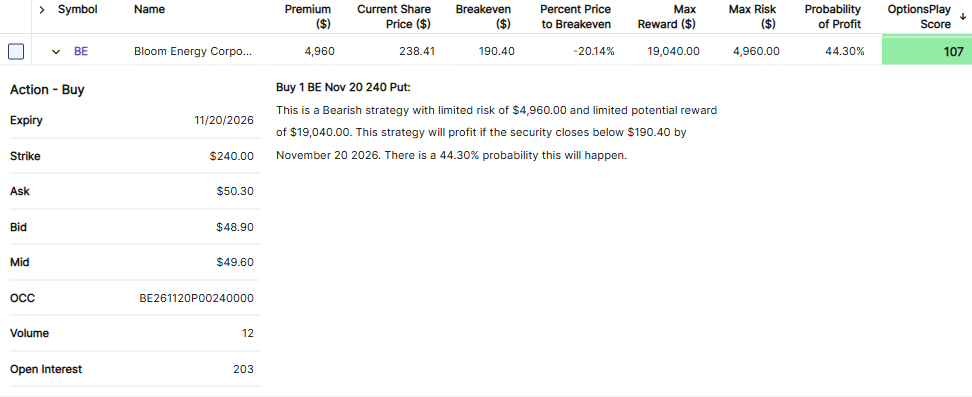
| Additional Data: | |
| Bid/Ask Spread | 2.86% |
| Delta | -39.27 |
| Gamma | 0.30 |
| Implied Volatility | 102.29% |
| Expiry Date | 99 |
| Earnings Date | 10/27/2026 |
Income (Covered Call)
Ross Stores, Inc. (ROST) Sep 25 $225 Covered Call

| Additional Data: | |
| Bid/Ask Spread | 64.00% |
| Delta | 20.19 |
| Gamma | -0.27 |
| Implied Volatility | 34.93% |
| Expiry Date | 43 |
| Earnings Date | 08/20/2026 |
Daily Equity & Market Analysis
Loading, Please Wait...

