
With retailing earnings wrapping this week, it proved timely to check on the state of the consumer and see what potential opportunities may be prevalent within the market.
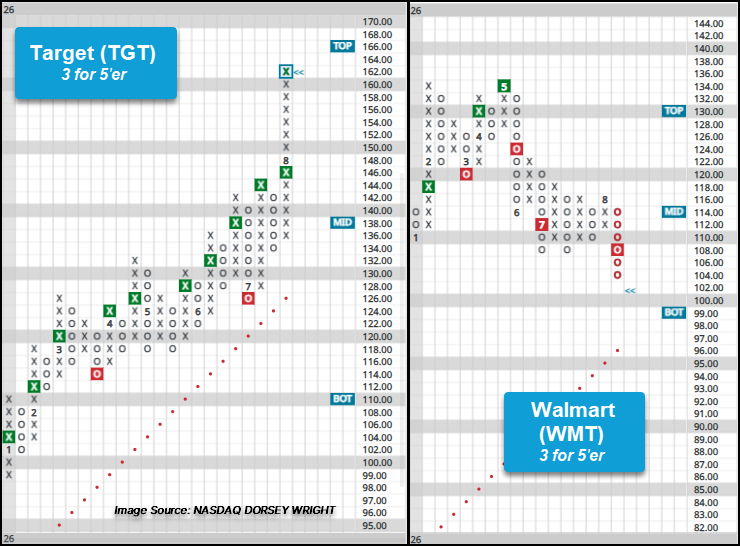
This week’s retail earnings have offered an additional check-in on consumer spending in 2026 with many reports hinging on comparable sales and guidance for the remainder of the year. Target (TGT) was able to beat consensus estimates on comparable sales and raised guidance, sending shares to a 52-week high at $160, while Walmart (WMT) saw its smallest comparable sales growth in over six years, bringing about a third consecutive sell signal as shares fell to their lowest level since November 2025. With retailing earnings wrapping this week, it proved timely to check on the state of the consumer and see what potential opportunities may be prevalent within the market.
While inflation eased slightly in July to 3.4% year-over-year, a recent report by the Bank of America Institute highlighted an even larger easing of consumer spending with only a 5% increase year-over-year, compared to 6.3% in June. The report noted that low to middle income households have seen a narrowing in spending and wage growth, giving the average consumer a healthier balance, while higher-income households have seen spending upheld while wage growth eased. Ultimately, the group behind the report perceives this action, along with others highlighted in the report, as reason to believe the “K-shaped” economy was beginning to close. Pushing even Treasury Secretary Scott Bessent to declare that “K-shaped” economy over.
While pundits will debate the economy’s standing in the coming months, a report such as this offers insight for portfolios. In delving further into the report, there were subsectors like airlines and clothing that saw higher-income earners outspend middle and lower-income earners. Meanwhile, subsectors like lodging and general merchandise were areas where lower-income earners have made headway in terms of matching higher-income earners spending, while restaurants saw lower-income earnings outspend higher-income earners. Utilizing this information in conjunction with understanding where relative strength leadership resides can help construct a list of potentially actionable names.

Below is the current ranking of consumer discretionary subsectors within the 96 member NDW Subsector RS Matrix (Securities > Matrix > Premade Matrices > Sector (Indices, Models)). By utilizing the RS matrix, users can see what subsectors are current showing strength and weakness, allowing for a focus on those discretionary subsectors where spending is still prevalent and technical metrics are strong. In looking for potential ideas from the broader list of discretionary subsectors, the focus will be on the upper echelon of the rankings. While potentially starting by looking at least within the sectors ranking within the top half of the rankings, focus could be narrowed to just a handful of leaders like advertising, consumer electronics, lodging, entertainment, and clothing – all which rank roughly in the top quartile of the matrix.

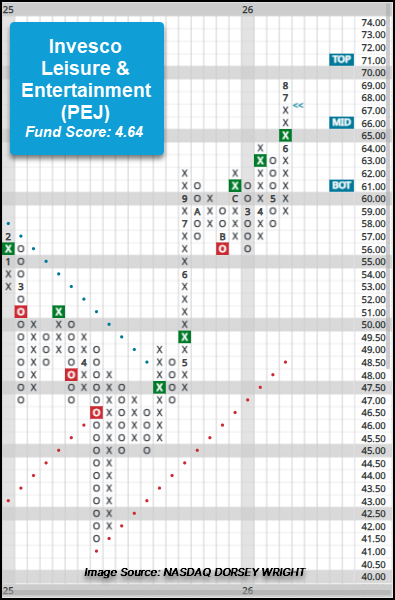
One way to approach exposure to subsectors like those mentioned above is through a focused, potentially theme-oriented ETF. A fund providing exposure to a bevy of the discretionary subsectors mentioned above is the Invesco Leisure & Entertainment ETF (PEJ). PEJ has maintained a long-term positive trend since April 2025 and a buy since December. June’s trading led to a third consecutive buy signal as shares continued higher through the summer, reaching a new chart high at $69 during trading on 8/13. The ETF has sustained long-term positive relative strength against the market since late 2024 and its peer group since June 2025. With a fund score of 4.64, PEJ is scoring a full two points higher than the average score for a fund within the broad cyclical/discretionary space (2.17). The fund is actionable within the mid to upper $60 range, while support can be found at $56 and $58.
For those who may be looking for individual stock exposure users can search for technically strong names within certain subsectors of the market (or subsector ETFs like PEJ above) can utilize the Security Screener (Securities > Security Screener). Below are the criteria used as an example. Bear in mind, the below serves as an example and additional technical criteria or subsectors can be added to either narrow or expand potential ideas searched.
Security Screener Criteria
- Universe: Advertising, Consumer Electronics, Lodging, Clothing , and Entertainment.
- Optionable Only
- Total Return: NO
- Security Type: Stock and ADR
- Technical Attribute: 4 and 5
- Signal: Buy
- Trend: Positive
- Overbought/Oversold: -75% to 75%
Notable names among the eight stocks to fulfill all the criteria listed above are Garmin (GRMN), Hilton (HLT), and Take-Two Interactive (TTWO). Below InterContinential Hotels Group (IHG) is highlighted.
InterContinential Hotels Group (UK) ADR – IHG has been at least a 3 for 5’er since January 2023 and a 5 for 5’er since November 2025. The stock has maintained positive long-term relative strength against the market since May 2023 and its peers within the leisure space since February 2024. On the trend chart, IHG has maintained a positive trend since November 2022 and returned to a buy signal in April of this year. After a second buy signal in May, IHG rallied to a new all-time chart high at $174 in June before pulling back in July and consolidating within the mid $150s to low $160s. The stock is actionable in the upper $150 to low $170 range. Initial support lies in the mid $150s, while additional can be found at $140 and in the upper $120s.

