Most Requested Symbols

With retailing earnings wrapping this week, it proved timely to check on the state of the consumer and see what potential opportunities may be prevalent within the market.
NDW Morning Pulse - August 21, 2026
Beginners Series Webinar: Join us on Monday, August 24th at 2 PM (ET) for our NDW Beginners Series Webinar. This week's topic is: Navigating the Models Page. Register Here.
Below are highlights from the NDW Morning Update Video for the morning of 08/21. Access the the video on the NDW Morning Update Video page.

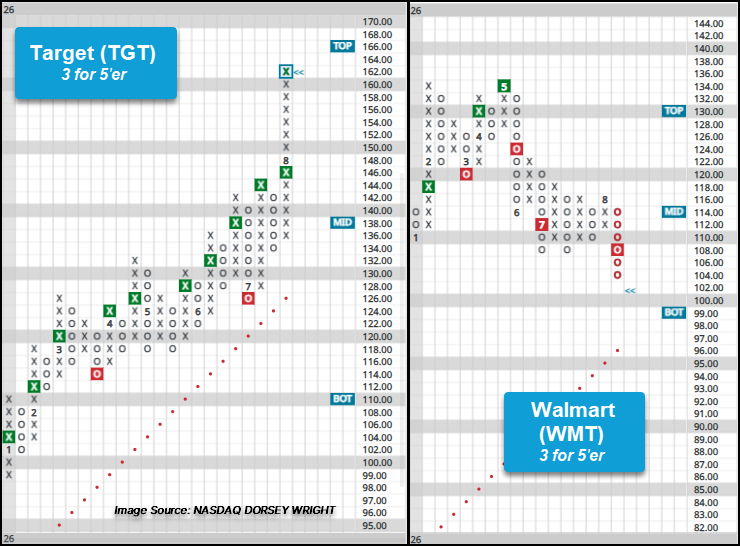
This week’s retail earnings have offered an additional check-in on consumer spending in 2026 with many reports hinging on comparable sales and guidance for the remainder of the year. Target (TGT) was able to beat consensus estimates on comparable sales and raised guidance, sending shares to a 52-week high at $160, while Walmart (WMT) saw its smallest comparable sales growth in over six years, bringing about a third consecutive sell signal as shares fell to their lowest level since November 2025. With retailing earnings wrapping this week, it proved timely to check on the state of the consumer and see what potential opportunities may be prevalent within the market.
While inflation eased slightly in July to 3.4% year-over-year, a recent report by the Bank of America Institute highlighted an even larger easing of consumer spending with only a 5% increase year-over-year, compared to 6.3% in June. The report noted that low to middle income households have seen a narrowing in spending and wage growth, giving the average consumer a healthier balance, while higher-income households have seen spending upheld while wage growth eased. Ultimately, the group behind the report perceives this action, along with others highlighted in the report, as reason to believe the “K-shaped” economy was beginning to close. Pushing even Treasury Secretary Scott Bessent to declare that “K-shaped” economy over.
While pundits will debate the economy’s standing in the coming months, a report such as this offers insight for portfolios. In delving further into the report, there were subsectors like airlines and clothing that saw higher-income earners outspend middle and lower-income earners. Meanwhile, subsectors like lodging and general merchandise were areas where lower-income earners have made headway in terms of matching higher-income earners spending, while restaurants saw lower-income earnings outspend higher-income earners. Utilizing this information in conjunction with understanding where relative strength leadership resides can help construct a list of potentially actionable names.

Below is the current ranking of consumer discretionary subsectors within the 96 member NDW Subsector RS Matrix (Securities > Matrix > Premade Matrices > Sector (Indices, Models)). By utilizing the RS matrix, users can see what subsectors are current showing strength and weakness, allowing for a focus on those discretionary subsectors where spending is still prevalent and technical metrics are strong. In looking for potential ideas from the broader list of discretionary subsectors, the focus will be on the upper echelon of the rankings. While potentially starting by looking at least within the sectors ranking within the top half of the rankings, focus could be narrowed to just a handful of leaders like advertising, consumer electronics, lodging, entertainment, and clothing – all which rank roughly in the top quartile of the matrix.

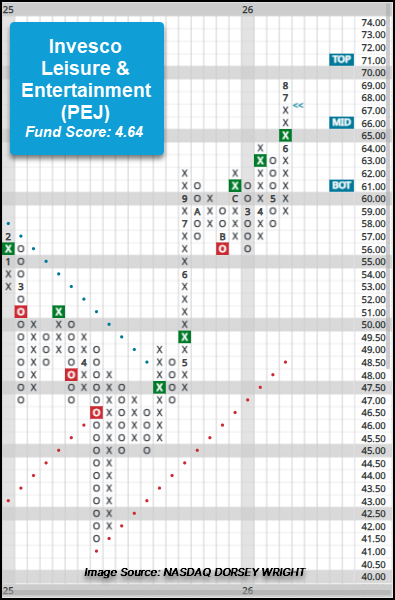
One way to approach exposure to subsectors like those mentioned above is through a focused, potentially theme-oriented ETF. A fund providing exposure to a bevy of the discretionary subsectors mentioned above is the Invesco Leisure & Entertainment ETF (PEJ). PEJ has maintained a long-term positive trend since April 2025 and a buy since December. June’s trading led to a third consecutive buy signal as shares continued higher through the summer, reaching a new chart high at $69 during trading on 8/13. The ETF has sustained long-term positive relative strength against the market since late 2024 and its peer group since June 2025. With a fund score of 4.64, PEJ is scoring a full two points higher than the average score for a fund within the broad cyclical/discretionary space (2.17). The fund is actionable within the mid to upper $60 range, while support can be found at $56 and $58.
For those who may be looking for individual stock exposure users can search for technically strong names within certain subsectors of the market (or subsector ETFs like PEJ above) can utilize the Security Screener (Securities > Security Screener). Below are the criteria used as an example. Bear in mind, the below serves as an example and additional technical criteria or subsectors can be added to either narrow or expand potential ideas searched.
Security Screener Criteria
Notable names among the eight stocks to fulfill all the criteria listed above are Garmin (GRMN), Hilton (HLT), and Take-Two Interactive (TTWO). Below InterContinential Hotels Group (IHG) is highlighted.
InterContinential Hotels Group (UK) ADR – IHG has been at least a 3 for 5’er since January 2023 and a 5 for 5’er since November 2025. The stock has maintained positive long-term relative strength against the market since May 2023 and its peers within the leisure space since February 2024. On the trend chart, IHG has maintained a positive trend since November 2022 and returned to a buy signal in April of this year. After a second buy signal in May, IHG rallied to a new all-time chart high at $174 in June before pulling back in July and consolidating within the mid $150s to low $160s. The stock is actionable in the upper $150 to low $170 range. Initial support lies in the mid $150s, while additional can be found at $140 and in the upper $120s.


| Symbol | Name | Price | Yield | PnF Trend | RS Signal | RS Col. | Fund Score | 200 Day MA | Weekly Mom |
|---|---|---|---|---|---|---|---|---|---|
| DIA | State Street SPDR Dow Jones Industrial Average ETF Trust | 527.51 | 1.37 | Positive | Sell | X | 4.27 | 495.31 | - 6W |
| EEM | iShares MSCI Emerging Markets ETF | 66.62 | 1.94 | Positive | Buy | O | 4.00 | 61.07 | + 1W |
| EFA | iShares MSCI EAFE ETF | 107.35 | 3.08 | Positive | Sell | X | 4.06 | 100.87 | + 4W |
| IJH | iShares S&P MidCap 400 Index Fund | 76.37 | 1.18 | Positive | Buy | O | 4.42 | 71.11 | - 1W |
| IJR | iShares S&P SmallCap 600 Index Fund | 146.37 | 1.13 | Positive | Sell | X | 4.44 | 132.32 | - 6W |
| QQQ | Invesco QQQ Trust | 710.93 | 0.46 | Positive | Buy | O | 4.28 | 652.37 | + 1W |
| RSP | Invesco S&P 500 Equal Weight ETF | 220.28 | 1.49 | Positive | Sell | O | 3.48 | 201.82 | + 2W |
| SPY | State Street SPDR S&P 500 ETF Trust | 762.60 | 1.01 | Positive | Buy | X | 5.05 | 707.13 | + 3W |
| XLG | Invesco S&P 500 Top 50 ETF | 61.90 | 0.67 | Positive | Sell | O | 2.90 | 59.65 | + 4W |

Average Level
17.38
| < - -100 | -100 - -80 | -80 - -60 | -60 - -40 | -40 - -20 | -20 - 0 | 0 - 20 | 20 - 40 | 40 - 60 | 60 - 80 | 80 - 100 | 100 - > |
|---|---|---|---|---|---|---|---|---|---|---|---|
|
Sell signalEEM
|
|||||||||||
|
Buy signalIJH
|
|||||||||||
|
Buy signalijr
|
|||||||||||
|
Sell signalONEQ
|
|||||||||||
|
Buy signaliwm
|
|||||||||||
|
Sell signalshy
|
Buy signaldvy
|
||||||||||
|
Buy signalhyg
|
Buy signalxlg
|
Buy signalrsp
|
|||||||||
|
Buy signaldx/y
|
Sell signalagg
|
Buy signalicf
|
Buy signaldia
|
Buy signalSPY
|
Buy signaluso
|
Sell signalfxe
|
|||||
|
Sell signallqd
|
Sell signaltlt
|
Sell signalief
|
Sell signalQQQ
|
Buy signalVOOG
|
Buy signalefa
|
Buy signalVOOV
|
Buy signalgld
|
Buy signalgsg
|
Buy signalgcc
|
||
| < - -100 | -100 - -80 | -80 - -60 | -60 - -40 | -40 - -20 | -20 - 0 | 0 - 20 | 20 - 40 | 40 - 60 | 60 - 80 | 80 - 100 | 100 - > |
| AGG | iShares US Core Bond ETF |
| USO | United States Oil Fund |
| DIA | SPDR Dow Jones Industrial Average ETF |
| DVY | iShares Dow Jones Select Dividend Index ETF |
| DX/Y | NYCE U.S.Dollar Index Spot |
| EFA | iShares MSCI EAFE ETF |
| FXE | Invesco CurrencyShares Euro Trust |
| GLD | SPDR Gold Trust |
| GSG | iShares S&P GSCI Commodity-Indexed Trust |
| HYG | iShares iBoxx $ High Yield Corporate Bond ETF |
| ICF | iShares Cohen & Steers Realty ETF |
| IEF | iShares Barclays 7-10 Yr. Tres. Bond ETF |
| LQD | iShares iBoxx $ Investment Grade Corp. Bond ETF |
| IJH | iShares S&P 400 MidCap Index Fund |
| ONEQ | Fidelity Nasdaq Composite Index Track |
| QQQ | Invesco QQQ Trust |
| RSP | Invesco S&P 500 Equal Weight ETF |
| IWM | iShares Russell 2000 Index ETF |
| SHY | iShares Barclays 1-3 Year Tres. Bond ETF |
| IJR | iShares S&P 600 SmallCap Index Fund |
| SPY | SPDR S&P 500 Index ETF Trust |
| TLT | iShares Barclays 20+ Year Treasury Bond ETF |
| GCC | WisdomTree Continuous Commodity Index Fund |
| VOOG | Vanguard S&P 500 Growth ETF |
| VOOV | Vanguard S&P 500 Value ETF |
| EEM | iShares MSCI Emerging Markets ETF |
| XLG | Invesco S&P 500 Top 50 ETF |
| Symbol | Company | Sector | Current Price | Action Price | Target | Stop | Notes |
|---|---|---|---|---|---|---|---|
| ZION | Zions Bancorporation | Banks | $67.90 | mid-to-hi 60s | 87 | 55 | 4 for 5'er, top half of favored BANK sector matrix, new RS buy signal, buy on pullback, R-R~2.0, 2.5% yield |
| FR | First Industrial Realty Trust | Real Estate | $62.62 | mid-to-hi 60s | 86 | 59 | 4 for 5'er, top 25% of REAL sector matrix, LT pos peer RS, spread sextuple top, R-R>2.0, 2.9% yield |
| CB | Chubb Ltd | Insurance | $342.87 | mid 340s - mid 360s | 456 | 308 | 4 for 5'er, pos. trend since 2023, LT Mkt RS buy since May '24, Reward to Risk > 4. |
| FITB | Fifth Third Bancorp | Banks | $54.50 | mid to upper 50s | 84 | 46 | 4 for 5'er since March '24, pos. LT Peer RS since March '09, LT pos. trend since Dec. '23. |
| HIG | Hartford Insurance Group Inc/The | Insurance | $137.12 | hi 130s - 140s | 164 | 126 | 5 for 5'er, LT pos peer & mkt RS, bullish catapult, good R-R, 1.65% yield |
| BNY | Bank of New York Mellon Corporation | Banks | $157.24 | low 150s to 160 | 192 | 130 | 5 for 5'er since Sept. '24, top 10% of Banks matrix, LT peer and mkt RS, Pos. trend since Nov. '23. |
| GD | General Dynamics Corporation | Aerospace Airline | $386.07 | 380s - low 390s | 424 | 340 | 4 for 5'er, Pos. ST Peer RS, Pos. LT & ST Mkt RS, Pos. trend and buy signal since June, ATH 7/29. |
| TXRH | Texas Roadhouse, Inc. | Restaurants | $201.20 | 190s - 200s | 262 | 172 | 5 for 5'er, top half of favored REST sector matrix, LT pos peer & mkt RS, good R-R, 1.4% yield |
| GHRS | GH Research Plc | Biomedics/Genetics | $28.68 | 28 - 33 | 46.50 | 24 | 5 for 5'er, LT Mkt. since Feb. '25, top quintile of Bio. matrix, matched chart high on 8/7. |
| GSL | Global Ship Lease Inc. | Transports/Non Air | $43.38 | low 40s | 55 | 35 | 4 for 5'er, favored TRAN sector, LT pos mkt RS, R-R~2.0, 6% yield |
| SXT | Sensient Technologies Corporation | Chemicals | $132.58 | 124 - 132 | 176 | 106 | 4 for 5'er, Pos. LT Peer RS, Top 5 of Chemicals matrix, Pos. Trend since 4/26, ATH on 8/6. |
| BWA | BorgWarner Inc. | Autos and Parts | $64.80 | hi 60s - low 70s | 89 | 57 | 4 for 5'er, top 20% of AUTO sector matrix, triple top, good R-R |
| MLI | Mueller Industries Inc | Metals Non Ferrous | $61.96 | low-to-mid 60s | 104 | 53 | 5 for 5'er, top third of META sector matrix, LT pos peer & mkt RS, spread triple top, buy on pullback, R-R~3.0 |
| AAMI | Acadian Asset Management Inc. | Wall Street | $90.85 | low to mid 90s | 122 | 78 | 5 for 5'er since June '25, 2nd in Wall Street matrix, Pos. trend since July '24, ATH on 8/5. |
| CAH | Cardinal Health, Inc. | Drugs | $228.46 | 224 - mid 240s | 334 | 188 | 4/5 TA rating, top 50% of DRUG sector matrix, LT RS buy, consec buy signals, buy-on-pullback |
| Symbol | Company | Sector | Current Price | Action Price | Target | Stop | Notes |
|---|
| Symbol | Company | Sector | Current Price | Action Price | Target | Stop | Notes |
|---|---|---|---|---|---|---|---|
| BFH | Bread Financial Holdings Inc. | Business Products | $103.18 | 91 | Moved to a sell signal. We will raise our stop to $91, which would move the stock to a negative trend. |
| Comment | |||||||
|---|---|---|---|---|---|---|---|
|
|
|||||||
CAH Cardinal Health, Inc. ($228.98) R - Drugs - CAH has a 4 for 5 TA rating and sits in the top half of the drugs sector RS matrix. The stock has maintained an RS buy signal against the market since mid-2023 and has been in a positive trend since last October. We saw the recent price action lead CAH to two consecutive buy signals and a new all-time high before the share price consolidated back to the current chart position just below the middle of its trading band. Exposure may be considered on this pullback from $224 to the mid-$240s. Our initial stop will be positioned at $188, which would violate multiple support levels and move the stock to a negative trend. The bullish price objective of $334 will serve as our price target, offering a reward-to-risk north of 2-to-1.
| 26 | |||||||||||||||||||||||||||||
| 256.00 | X | 256.00 | |||||||||||||||||||||||||||
| 252.00 | X | O | 252.00 | ||||||||||||||||||||||||||
| 248.00 | X | O | 248.00 | ||||||||||||||||||||||||||
| 244.00 | X | O | 244.00 | ||||||||||||||||||||||||||
| 240.00 | X | X | O | 240.00 | |||||||||||||||||||||||||
| 236.00 | X | O | 8 | O | 236.00 | ||||||||||||||||||||||||
| 232.00 | 3 | X | O | X | O | Mid | 232.00 | ||||||||||||||||||||||
| 228.00 | X | X | O | X | 7 | X | 228.00 | ||||||||||||||||||||||
| 224.00 | X | O | X | O | X | O | 224.00 | ||||||||||||||||||||||
| 220.00 | 2 | X | O | X | O | X | 220.00 | ||||||||||||||||||||||
| 216.00 | X | O | X | O | O | 4 | X | 216.00 | |||||||||||||||||||||
| 212.00 | X | 1 | O | X | O | X | O | X | 212.00 | ||||||||||||||||||||
| 208.00 | X | O | X | O | O | X | O | X | 208.00 | ||||||||||||||||||||
| 204.00 | X | O | X | O | O | X | 204.00 | ||||||||||||||||||||||
| 200.00 | X | C | X | O | X | X | X | 200.00 | |||||||||||||||||||||
| 198.00 | X | O | X | O | X | O | X | O | X | 198.00 | |||||||||||||||||||
| 196.00 | X | X | O | O | X | O | X | O | X | 196.00 | |||||||||||||||||||
| 194.00 | X | O | X | O | X | O | X | 6 | Bot | 194.00 | |||||||||||||||||||
| 192.00 | X | O | X | O | 5 | O | X | 192.00 | |||||||||||||||||||||
| 190.00 | X | B | O | X | O | X | • | 190.00 | |||||||||||||||||||||
| 188.00 | X | O | X | O | X | • | 188.00 | ||||||||||||||||||||||
| 186.00 | X | O | O | X | • | 186.00 | |||||||||||||||||||||||
| 184.00 | X | O | X | • | 184.00 | ||||||||||||||||||||||||
| 182.00 | X | O | • | 182.00 | |||||||||||||||||||||||||
| 180.00 | X | • | 180.00 | ||||||||||||||||||||||||||
| 178.00 | X | • | 178.00 | ||||||||||||||||||||||||||
| 176.00 | X | • | 176.00 | ||||||||||||||||||||||||||
| 174.00 | X | • | 174.00 | ||||||||||||||||||||||||||
| 172.00 | X | • | 172.00 | ||||||||||||||||||||||||||
| 170.00 | X | • | 170.00 | ||||||||||||||||||||||||||
| 168.00 | X | • | 168.00 | ||||||||||||||||||||||||||
| 166.00 | X | • | 166.00 | ||||||||||||||||||||||||||
| 164.00 | X | • | 164.00 | ||||||||||||||||||||||||||
| 162.00 | X | • | 162.00 | ||||||||||||||||||||||||||
| 160.00 | X | • | 160.00 | ||||||||||||||||||||||||||
| 158.00 | • | A | X | X | • | 158.00 | |||||||||||||||||||||||
| 156.00 | X | • | X | O | X | O | X | • | 156.00 | ||||||||||||||||||||
| 154.00 | X | O | X | O | X | O | X | • | 154.00 | ||||||||||||||||||||
| 152.00 | 9 | O | X | O | O | • | 152.00 | ||||||||||||||||||||||
| 150.00 | X | O | X | • | • | 150.00 | |||||||||||||||||||||||
| 148.00 | X | O | X | • | 148.00 | ||||||||||||||||||||||||
| 146.00 | O | • | 146.00 | ||||||||||||||||||||||||||
| 26 |

| CVS CVS Health Corp. ($93.28) - Retailing - CVS broke a triple bottom at $93 for a second sell signal since peaking at $110 in July. The stock has been a 5 for 5'er since May, but recent action has brought the stock to within one box of reversing down into Os on both the market and peer RS charts. From here, support lies at $90, while the bullish support line sits at $83. |
| KMX Carmax Group ($62.13) - Autos and Parts - KMX broke a triple top at $62 for a fourth buy signal as shares rallied to $63. The stock has been a 5 for 5'er since July and currently ranks 3rd (out of 52) within the Autos and Parts sector matrix. Okay to consider here on the breakout or on a pullback to the upper $50s. Note resistance at $71, while additional resdies in the loer $80s. Initial support lies in the mid $50s, while additional can be found at $50 and $47. |
| VTR Ventas, Inc. ($93.55) - Real Estate - VTR moved higher Friday to break a double top at $94. This ends a streak of sell signals for the 5 for 5 TA stock that has been in a positive trend since late 2023. The stock also sits in the top third of the real estate sector RS matrix and has been on an RS buy signal against the market for nearly two years. The weight of the technical evidence is favorable and once again improving. Note that VTR is at resistance at $94 with initial support not seen until $87. |
The option suggestions featured here are pulled from the NDW Options Ideas tool. These are just a sample of the ideas that can be found there. The Options Idea tool contains numerous additional income and speculative plays. It also offers relative strength-based screens targeting the highest (and lowest) relative strength stocks and ETFs that have recently moved counter to their longer-term trend. To access or subscribe to the Options Ideas tool, click here.
Call
Philip Morris International Inc. (PM) Nov 20 $185 Call

| Additional Data: | |
| Bid/Ask Spread | 12.60% |
| Delta | 60.41 |
| Gamma | 1.41 |
| Implied Volatility | 29.97% |
| Expiry Date | 91 |
| Earnings Date | 10/21/2026 |
Put
JD.com (JD) Dec 18 $30 Put

| Additional Data: | |
| Bid/Ask Spread | 2.43% |
| Delta | -47.51 |
| Gamma | 6.68 |
| Implied Volatility | 36.27% |
| Expiry Date | 91 |
| Earnings Date | 11/12/2026 |
Income (Covered Call)
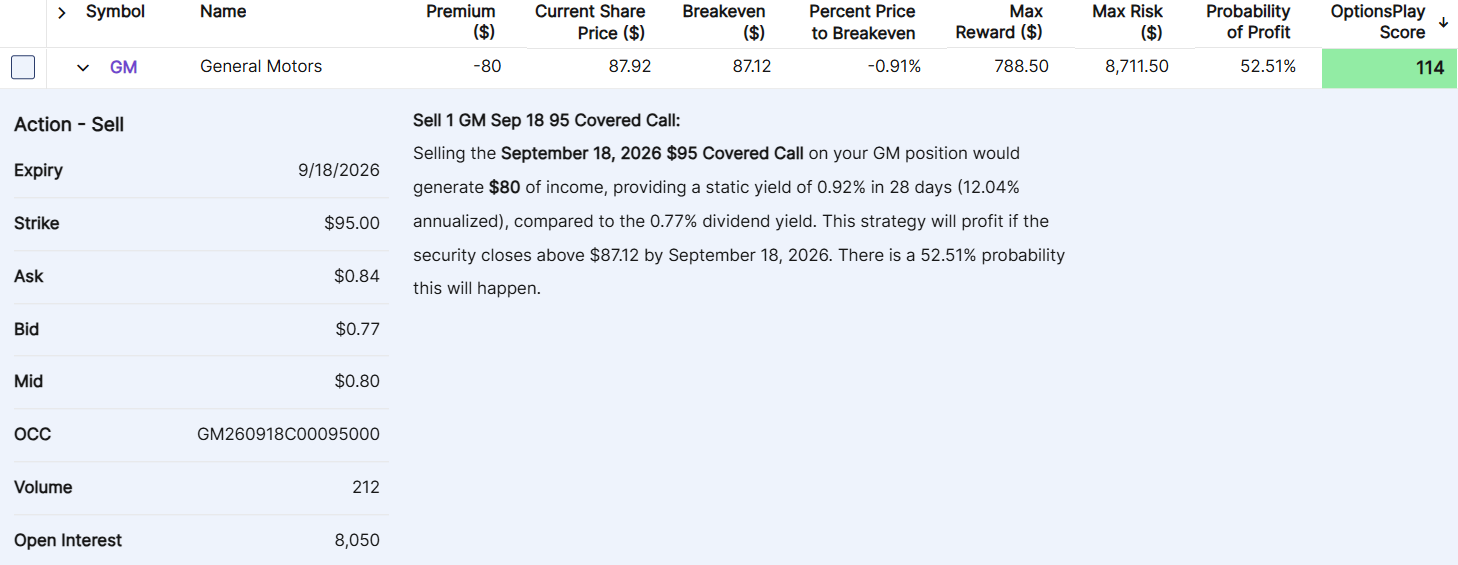
General Motors (GM) Sep 18 $95 Covered Call
| Additional Data: | |
| Ann. Static Return | 12.04% |
| Bid/Ask Spread | 9.09% |
| Delta | 79.91 |
| Gamma | -3.76 |
| Implied Volatility | 31.08% |
| Expiry Date | 28 |
| Earnings Date | 10/20/2026 |
Daily Equity & Market Analysis
Loading, Please Wait...

