Most Requested Symbols

Last Friday's down action saw SPX return to O's on its 1% RS chart vs. SPXEWI. Today we talk about the implications of that reversal.
The end of last week was ugly, there’s no sugar coating that. How does technology look after the recent pullback?
Weekly Rundown Video – June 3, 2026
Weekly rundown with NDW analyst team covering all major asset classes.
Weekly rundown with NDW analyst team covering all major asset classes.
Last Friday (6/5) was ugly for global markets, to say the least. The catalyst for the downside move largely seemed to be the stronger than expected jobs report, ushering back in the idea that good news is bad news for the overall landscape of rates throughout 2026. Markets are still largely convinced that rates in 2026 will either advance, or at the very least stay steady, a stark contrast to the 1-2 rate cuts expected at the start of the year. Adding to the decline was the magnitude of the recent run-up for growth focused assets, particularly semiconductors. All in all, the set-up was ripe for a major exhale that saw semiconductors (SOXX) decline over 10% while major markets (SPX) give back just over 2.50%. The 10.44% decline for SOXX was the 4th worst day in history, followed most recently in March of 2020 (-15% on 3/16/20 and -10.96% on 3/12/20) and 2002 (-10.63%, 10/16/02). While no 10% decline day is “normal” by any stretch of the word, the technical setup for SOXX is still quite strong, with the fund moving back into O’s to a point of old resistance at $530. We touch more on technology’s decline in today’s feature.

A somewhat interesting development to take place as a result of Friday’s action was a reversal back into O’s on a 1% chart between SPX and SPXEWI. In plain language, this suggests that the “average” S&P 500 stock now earns short-term strength against the cap weighted option, a surprising development considering the strength of the larger names coming off 2026 lows. The move marks the first action in favor of SPXEWI since April’s reversal higher as larger names ripped off this year’s lows. It is worth noting that SPX maintains a string of four consecutive buy signals on this chart, suggesting that cap weighted options have maintained their long-term strength since the start of the recent bull market in 2023. While we wouldn’t suggest completely shifting your allocation to favor a more equally weighted position based on this reversal alone, the development certainly does warrant you watch your mega cap positions a bit more cautiously in the event of further declines. It goes without saying that not every reversal is going to lead to a profitable trade… but historically speaking those following an “RS Switching” strategy (owning whichever asset is on a PnF buy signal) or “column switching” (owning whichever asset is in a column of X’s) has led to a return stream that bests owning either SPX or SPXEWI on its own. All that to say, the reversal can be quite telling for what kind of assets are in control of market movement…. But there is perhaps an asterisk that this change comes at the hands of essentially a single day’s exhale rather than sustained leadership from equal weighted assets.

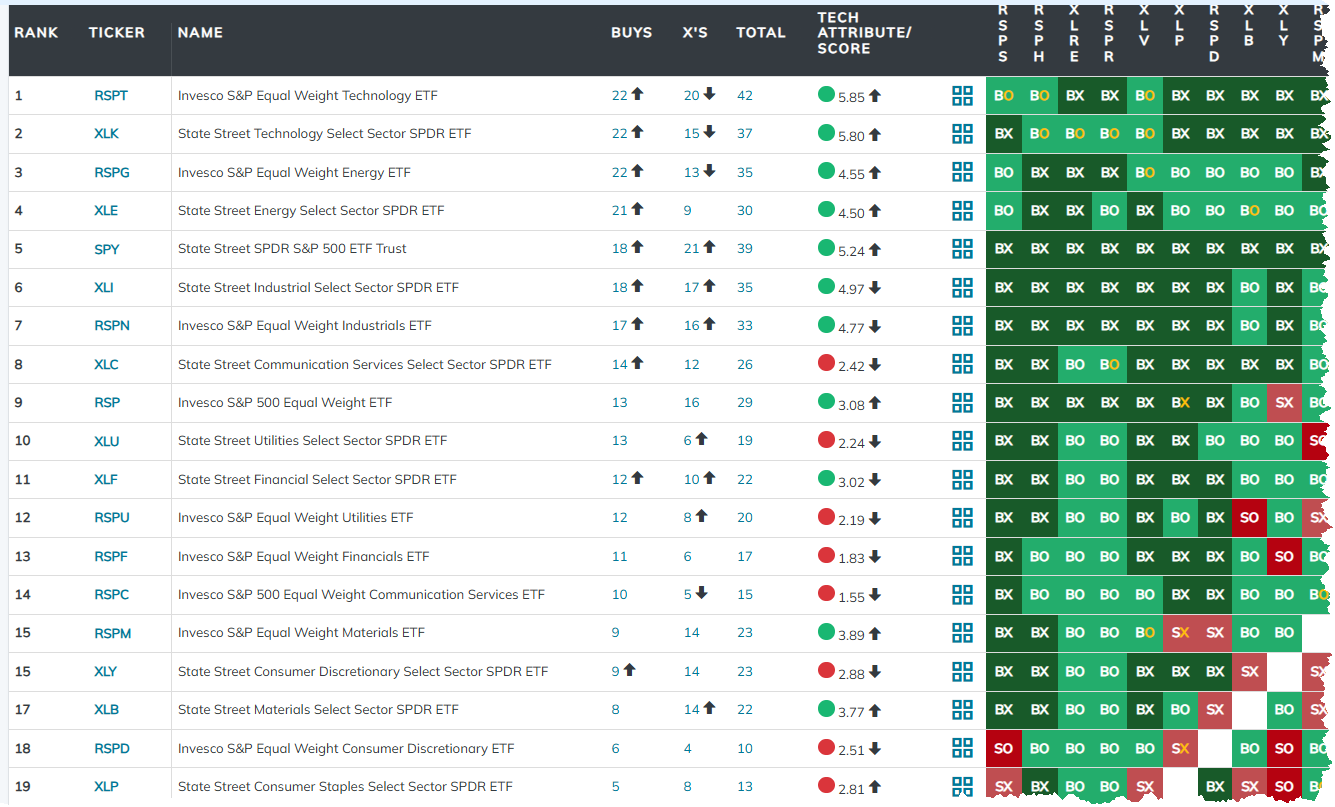
Of course, your portfolio is much more than simple exposure to the S&P 500. There are a multitude of options available to you, spanning across asset classes, size and style perspectives, or sectors. While knowing which option is in control for SPX vs. SPXEWI is helpful, contextualizing each assets strength against other assets across the investment landscape can be quite helpful. Below is a 3.25% matrix pitting SPY & RSP against both cap and equal weighted large cap sector representatives. While the matrix reveals plenty of useful information, perhaps the most interesting is the fact that both RSP and SPY sit in the top 10 of the rankings, signaling high relative strength from both options. All that to say, while equal weighted options have shown some recent relative strength, it certainly isn’t to suggest that larger names have weakened materially- keep this in mind as we rocket to the end of Q2.

The end of last week was ugly, there’s no sugar coating that. The S&P 500 was down 2.25% over Thursday and Friday, with growth and technology stocks taking the brunt of the damage. The Nasdaq-100 fell 4.8%, while the Technology Select Sector SPDR Fund (XLK) dropped a whopping 6.7%, leaving the sector within one percent of entering correction territory. Semiconductor stocks were hit the hardest, as the VanEck Semiconductor ETF (SMH) dropped almost 10%, marking its 10th worst day ever and its biggest one-day decline since January 2025. Suffice to say, it wasn’t good.
When faced with quick pullbacks like these, it’s important to remember the full context of the group’s strength and not let emotion creep into decision-making. NDX and XLK are still up 22% and 35.7% since the end of March, respectively. Domestic equities sit closely behind international equities at the top of DALI, while technology firmly holds first place in DALI’s sector rankings. Tech was previously in historically overbought territory, so the recent pullback could serve as a healthy exhale as the sector consolidates back toward normal levels. After last week’s action, NDX, XLK, and SMH are no longer heavily overbought, trading in actionable territory for the first time since April. Even if technology moves back into a bear market, declining 20% from all-time highs, XLK would return to levels last reached on April 28, erasing just a month and a half of gains.

Prior to this pullback, there had been an encouraging increase in breadth in the sector, serving as another positive sign for the group. There’s an adage that says, “A rising tide lifts all boats.” Over the last several months, technology has lifted the market higher as one of the highest relative strength areas. And yet, the rising tide in technology did not lift all boats, with upside coming almost exclusively from semiconductor stocks. Even over the last few years, mega-cap technology stocks have led the market higher, as opposed to broad-based gains across the sector. However, action over the last month has shown technology broadening out, even amid the recent pullback.
The market and technology bottomed out at the end of March but immediately rebounded in April, with XLK rising 20% during the month. However, Semiconductor fund SMH gained 32% in April, whereas the iShares North American Tech-Software ETF (IGV) rose less than 5%, highlighting just how narrow the upside was.. The major driver of the divergence between semiconductors and software stocks was the impact of AI on their businesses. As AI models continued to advance and develop, demand for semiconductors and memory chips was expected to grow. On the other hand, investors began to fear that AI models could replace portions of the software industry, as LLMs might eventually provide similar functionality. However, narratives within the technology space have shifted in recent months, with investors increasingly recognizing that the underperformance in software may have been overdone.

Tech has looked much more balanced since the end of April, with IGV outperforming SMH, rising 14.2% and 12.4%, respectively. Additionally, the relative strength of both groups appears much closer. SMH has held a fund score above 5.0 for almost a whole year, but IGV’s fund score fell as low as 0.18 in April. Since then, IGV has improved dramatically, raising its score up to a solid 4.16, marking an extreme turnaround for the subgroup. Within software, cybersecurity has seen arguably the largest rebound of about any subgroup—not just within technology. The First Trust NASDAQ Cybersecurity ETF (CIBR) has gained around 45% from its lows, returning to a positive trend before hitting all-time highs once again.

With upside within technology coming from more than just semiconductors, the percentage of technology companies trading in a positive trend (^PTECTECH) has risen up to a respectable 44%, up from 26% in March. For context, the PT is now just one box away from matching its highest level since the start of this bull market in 2022, underscoring the group’s quietly strong participation. While the sector could continue moving lower in the coming weeks, its broad-based strength has been an extremely encouraging development for its long-term health, especially as it continues to hold first place within our relative strength rankings.

Average Level
3.19
| < - -100 | -100 - -80 | -80 - -60 | -60 - -40 | -40 - -20 | -20 - 0 | 0 - 20 | 20 - 40 | 40 - 60 | 60 - 80 | 80 - 100 | 100 - > |
|---|---|---|---|---|---|---|---|---|---|---|---|
|
Buy signaliwm
|
|||||||||||
|
Buy signalIJH
|
|||||||||||
|
Buy signalijr
|
|||||||||||
|
Buy signaldvy
|
|||||||||||
|
Sell signalagg
|
Buy signalXLG
|
Buy signalSPY
|
|||||||||
|
Buy signalhyg
|
Buy signalONEQ
|
Buy signalVOOV
|
|||||||||
|
Sell signalief
|
Buy signalGSG
|
Buy signalVOOG
|
Buy signalQQQ
|
||||||||
|
Sell signalshy
|
Buy signalGCC
|
Sell signallqd
|
Buy signalefa
|
Buy signalicf
|
Buy signalrsp
|
||||||
|
Sell signalgld
|
Buy signalfxe
|
Sell signaltlt
|
Sell signaluso
|
Buy signalEEM
|
Sell signaldx/y
|
Buy signaldia
|
|||||
| < - -100 | -100 - -80 | -80 - -60 | -60 - -40 | -40 - -20 | -20 - 0 | 0 - 20 | 20 - 40 | 40 - 60 | 60 - 80 | 80 - 100 | 100 - > |
| AGG | iShares US Core Bond ETF |
| USO | United States Oil Fund |
| DIA | SPDR Dow Jones Industrial Average ETF |
| DVY | iShares Dow Jones Select Dividend Index ETF |
| DX/Y | NYCE U.S.Dollar Index Spot |
| EFA | iShares MSCI EAFE ETF |
| FXE | Invesco CurrencyShares Euro Trust |
| GLD | SPDR Gold Trust |
| GSG | iShares S&P GSCI Commodity-Indexed Trust |
| HYG | iShares iBoxx $ High Yield Corporate Bond ETF |
| ICF | iShares Cohen & Steers Realty ETF |
| IEF | iShares Barclays 7-10 Yr. Tres. Bond ETF |
| LQD | iShares iBoxx $ Investment Grade Corp. Bond ETF |
| IJH | iShares S&P 400 MidCap Index Fund |
| ONEQ | Fidelity Nasdaq Composite Index Track |
| QQQ | Invesco QQQ Trust |
| RSP | Invesco S&P 500 Equal Weight ETF |
| IWM | iShares Russell 2000 Index ETF |
| SHY | iShares Barclays 1-3 Year Tres. Bond ETF |
| IJR | iShares S&P 600 SmallCap Index Fund |
| SPY | SPDR S&P 500 Index ETF Trust |
| TLT | iShares Barclays 20+ Year Treasury Bond ETF |
| GCC | WisdomTree Continuous Commodity Index Fund |
| VOOG | Vanguard S&P 500 Growth ETF |
| VOOV | Vanguard S&P 500 Value ETF |
| EEM | iShares MSCI Emerging Markets ETF |
| XLG | Invesco S&P 500 Top 50 ETF |

| Symbol | Company | Sector | Current Price | Action Price | Target | Stop | Notes |
|---|---|---|---|---|---|---|---|
| BPOP | Popular, Inc. | Banks | $153.07 | hi 130s - low 150s | 200 | 120 | 5 for 5'er, 18 of 174 in favored BANK sector matrix, LT pos peer & mkt RS, triple top, good R-R, 2% yield |
| GRMN | Garmin Ltd. | Leisure | $236.57 | mid 230s - mid 260s | 364 | 196 | 5 TA rating, LT pos trend and mkt RS buy, top 33% of LEIS sector matrix, buy-on-pullback |
| OSW | OneSpaWorld Holdings Ltd. | Leisure | $24.07 | 22 - 24 | 30.50 | 19 | 5 for 5'er, top half of LEIS sector matrix, LT pos peer & mkt RS, spread quintuple top |
| SKT | Tanger Inc. | Real Estate | $37.09 | mid-to-hi 30s | 48 | 31 | 5 for 5'er, top 25% of REAL sector matrix, LT pos peer & mkt RS, R-R~2.0, 3.2% yield |
| IBOC | International Bancshares Corporation | Banks | $72.98 | low-to-mid 70s | 93 | 63 | 4 for 5'er, favored BANK sector, LT pos peer & mkt RS, bearish signal reversal, R-R~2.0, 1.95% yield |
| MSGE | Madison Square Garden Entertainment Corp. | Leisure | $72.08 | 63 to 69 | 98 | 53 | 5 for 5'er since Nov. 2025; Top Decile of Leisure Matrix; Pos. Trend since May 2025; ATH 5/7. |
| LYV | Live Nation Entertainment Inc. | Leisure | $160.07 | low 160s to mid 170s | 202 | 142 | 4 for 5'er; Pos. Trend; Top Half of Leisure Matrix; Within one box of ATH. |
| MO | Altria Group Inc. | Food Beverages/Soap | $72.19 | low-to-mid 70s | 91 | 62 | 4 for 5'er, top quartile of FOOD sector matrix, one box from RS buy, bullish triangle, 5.9% yield |
| MPC | Marathon Petroleum Corp. | Oil Service | $262.01 | 240 - 260 | 360 | 208 | 4 for 5'er, pos. trend, top third of Oil Services matrix, pos. L-T Mkt and Peer RS. |
| VLO | Valero Energy Corp | Oil Service | $255.82 | mid 230s - hi 250s | 328 | 212 | 4 TA rating, top 50% of OILS sector matrix, LT pos trend, buy-on-pullback |
| C | Citigroup, Inc. | Banks | $132.47 | low 120s - low 130s | 188 | 102 | 5 for 5'er since July '25; top decile of Banks matrix; pos. trend since May '25. |
| CTRE | CareTrust REIT Inc | Real Estate | $37.97 | $38 - $43 | 62.50 | 34 | 5/5'er since Apr. '25, top quintile of Real Estate Matrix, pos. trend and buy signal since Jul. '23. |
| TT | Trane Technologies PLC | Building | $456.84 | 420s - 470s | 652 | 380 | 5 TA rating, LT pos trend and mkt RS buy, top 50% of Building sector matrix, buy-on-pullback |
| BTI | British American Tobacco Sp-Adr (United Kingdom) ADR | Food Beverages/Soap | $59.72 | hi 50s - low 60s | 92 | 51 | 4 for 5'er, top 25% of FOOD sector matrix, one box from mkt RS buy, buy on pullback, R-R~3.0, 5.3% yield |
| LAMR | Lamar Advertising Company | Media | $151.42 | mid 140 to mid 150 | 228 | 122 | 5 for 5'er, top third of Media Matrix, pos. trend, Reward-Risk > 11, current yield > 4%. |
| CM | Canadian Imperial Bank of Commerce | Banks | $108.84 | 100s | 165 | 90 | 5 for 5'er, top 10% of favored BANK sector matrix, LT pos peer RS, bearish signal reversal, R-R>3.0, 2.9% yield |
| JCI | Johnson Controls International PLC | Building | $143.65 | upper 130s to lower 150s | 182 | 124 | 4 for 5'er since Apr. '25, top 25% of Building sector matrix, pos. trend, ATH on 6/3. |
| EBAY | eBay Inc. | Retailing | $109.35 | mid 100s - low 110s | 161 | 93 | 5 for 5'er, top 10% of RETA sector matrix, buy on pullback, R-R~3.0 |
| F | Ford Motor Company | Autos and Parts | $14.90 | 14.50 - 16 | 27 | 12.50 | 5 for 5'er, top 20% of AUTO sector matrix, RS buy signal, spread triple top, R-R~5, 3.9% yield |
| Symbol | Company | Sector | Current Price | Action Price | Target | Stop | Notes |
|---|
| Comment | |||||||
|---|---|---|---|---|---|---|---|
|
|
|||||||
F Ford Motor Company R ($15.10) - Autos and Parts - F is 5 for 5'er that ranks in the top quintile of the autos and parts sector matrix and recently moved to a market RS buy signal for the first time since 2022. On its default chart, F has completed three consecutive buy signals, most recently breaking a spread triple top at $15.50 late last month. After reaching a multi-year high at $17.50, the stock has pulled back to prior resistance, offering an entry point for long exposure. Positions may be added in the $14.50 to $16 range and we will set our initial stop at $12.50. We will use the bullish price objective, $27, as our target price, giving us a reward-to-risk ratio of around 5.0. F also carries a 3.9% yield.
| 23 | 24 | 25 | 26 | ||||||||||||||||||||||||||
| 17.50 | X | Top | 17.50 | ||||||||||||||||||||||||||
| 17.00 | • | X | O | 17.00 | |||||||||||||||||||||||||
| 16.50 | X | • | X | O | 16.50 | ||||||||||||||||||||||||
| 16.00 | X | O | • | X | 6 | 16.00 | |||||||||||||||||||||||
| 15.50 | X | O | • | • | X | O | 15.50 | ||||||||||||||||||||||
| 15.00 | 8 | O | • | X | • | • | X | O | 15.00 | ||||||||||||||||||||
| 14.50 | X | 9 | X | X | • | X | O | • | X | • | X | X | X | 14.50 | |||||||||||||||
| 14.00 | X | O | B | O | 2 | O | • | X | O | • | • | X | O | • | 1 | O | X | O | X | 14.00 | |||||||||
| 13.50 | X | O | X | O | X | O | • | X | 7 | 4 | • | X | O | • | X | O | X | O | X | 13.50 | |||||||||
| 13.00 | X | O | A | C | X | O | 4 | 6 | O | X | O | 7 | O | X | 3 | 4 | 5 | O | Mid | 13.00 | |||||||||
| 12.50 | 7 | O | X | O | 1 | O | X | O | X | 8 | X | 2 | O | X | O | A | O | X | O | X | 12.50 | ||||||||
| 12.00 | X | O | X | O | X | O | X | O | X | O | X | O | X | O | X | O | 9 | O | X | O | X | • | 12.00 | ||||||
| 11.50 | X | O | O | X | 3 | • | O | • | A | C | O | X | 5 | • | O | B | X | O | O | • | 11.50 | ||||||||
| 11.00 | O | • | • | • | O | X | 1 | • | • | O | X | O | 7 | • | 11.00 | ||||||||||||||
| 10.50 | • | O | X | • | 8 | X | O | 5 | • | 10.50 | |||||||||||||||||||
| 10.00 | O | • | O | X | C | X | • | 10.00 | |||||||||||||||||||||
| 9.50 | • | O | 2 | X | • | 9.50 | |||||||||||||||||||||||
| 9.00 | 4 | X | • | Bot | 9.00 | ||||||||||||||||||||||||
| 8.50 | O | • | 8.50 | ||||||||||||||||||||||||||
| 23 | 24 | 25 | 26 |
| CAKE The Cheesecake Factory Incorporated ($67.90) - Restaurants - CAKE broke a double top at $68 for a second buy signal and to bring the chart within one box of its all-time chart high at $69 from July 2025. The stock improved to a 5 for 5'er after shifting back into a positive trend at the end of May, and it currently ranks within the top quintile of the Restaurants sector matrix. Okay to consider here on the breakout. Initial support lies at $64, while additional can be found in the upper to low $50s. |
| PBF PBF Energy Inc. ($42.60) - Oil Service - PBF energy returned to a buy signal and a positive trend Monday when it broke a triple top at $44. The positive trend change will promote PBF to an acceptable 3 for 5'er. From here, PBF faces overhead resistance at $46, while support can be found at $37. |
| TJX The TJX Companies, Inc. ($160.75) - Retailing - TJX broke a double top at $162 to return to a buy signal. The stock has been a 5 for 5'er since November 2025 and ranks within the top half of the Retailing sector matrix. Okay to consider here on the breakout. Initial support lies at $154, while additional can be found in the upper to mid $140s. |

The option suggestions featured here are pulled from the NDW Options Ideas tool. These are just a sample of the ideas that can be found there. The Options Idea tool contains numerous additional income and speculative plays. It also offers relative strength-based screens targeting the highest (and lowest) relative strength stocks and ETFs that have recently moved counter to their longer-term trend. To access or subscribe to the Options Ideas tool click here.
Call
Altria Group (MO) September 18 $70 Call

| Additional Data: | |
| Bid/Ask Spread | 7.32% |
| Delta | 63.84 |
| Gamma | 4.92 |
| Implied Volatility | 27.32% |
| Expiry Days | 102 |
| Earnings Date | 7/30/2026 |
Put
The Boeing Company (BA) July 10 $220 Put

| Additional Data | |
| Bid/Ask Spread | 13.40% |
| Delta | -55.71 |
| Gamma | 1.93 |
| Implied Volatility | 32.25% |
| Expiry Days | 32 |
| Earnings Date | 7/28/2026 |
Income (Covered Call)
Corning Incorporated ([GLW) July 10 $230 Covered Call

| Additional Data: | |
| Ann. Static Return | 48.55% |
| Bid/Ask Spread | 38.32% |
| Delta | 74.86 |
| Gamma | -0.66 |
| Implied Volatility | 78.99% |
| Expiry Days | 32 |
| Earnings Date | 7/28/2026 |
Daily Equity & Market Analysis
Loading, Please Wait...
