Most Requested Symbols

While the last three years were extremely strong for both the economy and the financial sector, the start of this year has been a very different story. Given recent movement, how should we view financials and the sector's implications on the broader market.
High yield spreads have widened recently, a potential sign of risk-off sentiment.
Weekly Rundown Video – Mar 12, 2026
Weekly rundown with NDW analyst team covering all major asset classes.
Weekly rundown with NDW analyst team covering all major asset classes.
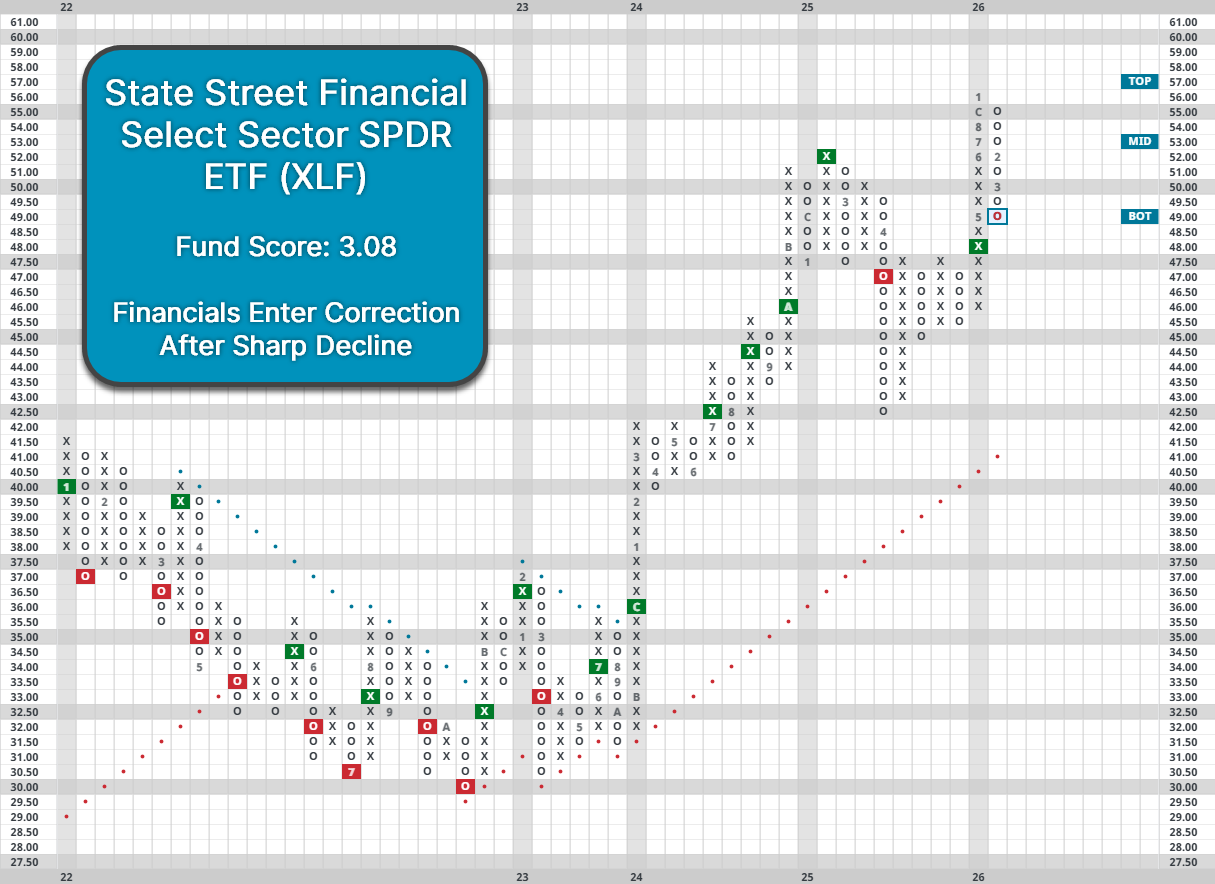
For better or worse, there’s no such thing as a crystal ball that predicts markets. Instead, the best we have are indicators and areas of the market that are more likely to precede movement of the economy. Among the eleven major sectors of domestic equities, the financial sector is the most likely to foreshadow movement in the broader economy. While the last three years were extremely strong for both the economy and the financial sector, the start of this year has been a very different story.
The State Street Financial Select Sector SPDR ETF (XLF) is down more than 10.8% YTD—its worst beginning to a year besides of the start of Covid since 2009. The fund is back to price levels first achieved in 2024, and its fund score has fallen to a mediocre 3.08, which is its lowest since late 2023. Meanwhile, the group is down to the middle of DALI after sitting in the number one spot as recently as last March. The broader sector has unquestionably weakened, but which areas have taken the largest hit, and are there concerning catalysts causing the decline?
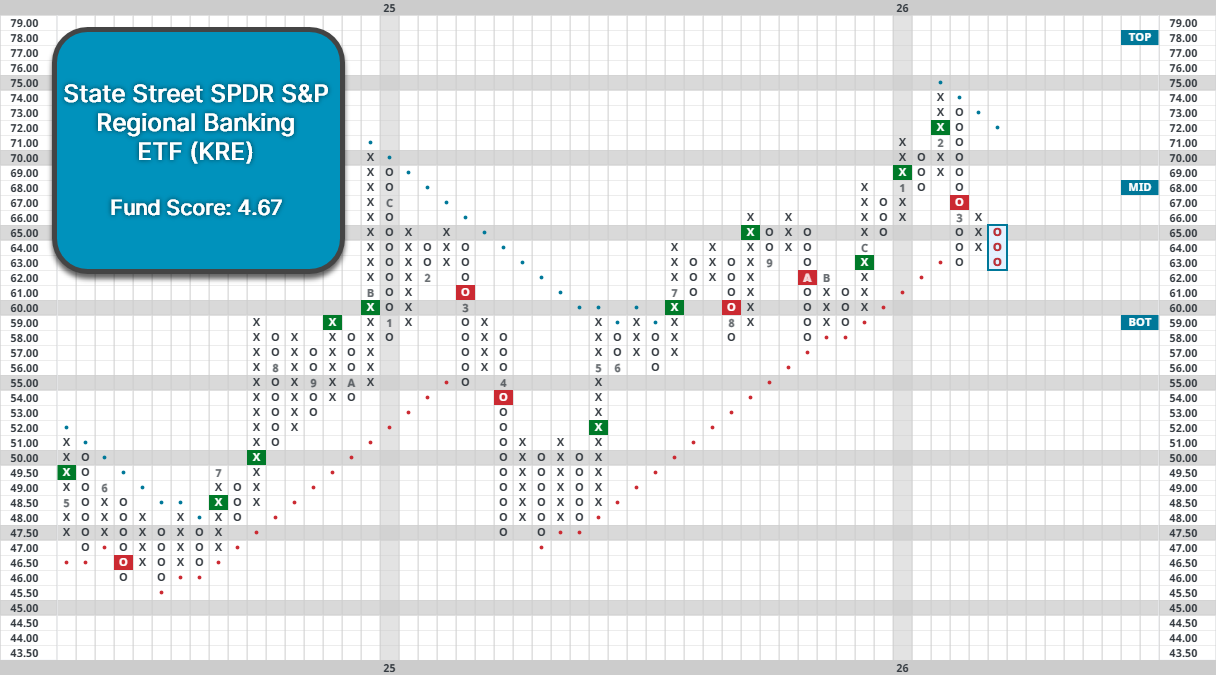
Banks have seen the most downside within financials over the last several months, and regional banks have been hit especially hard. Regional banks focus heavily on lending to small businesses, real estate developers, and local consumers, making their performance directly tied to local credit conditions and economic activity. Deteriorating credit conditions (read more below), commercial real estate woes, and consumer spending concerns have all served as recent headwinds. The State Street SPDR S&P Regional Banking ETF (KRE) is down more than 11% over the last month, moving to a negative trend for the first time since last year. While KRE holds a solid fund score of 4.67, its recent performance marks notable divergence from previous action, making it an area to watch for further weakness in the coming months.
One financial area we previously highlighted as experiencing weakness was payment processors, whose movement often coincides with expectations of consumer spending. While the subgroup has been disrupted by potential legislation limiting fees and interest charges, it has also fallen further due to lowered expectations of consumer spending, even among the higher tax-bracket demographic. Last year saw significant discussion about the “k-shaped” US economy in which businesses and the upper class continue spending while the average American failed to enjoy the same benefits. Notably, American Express (AXP) was an exception to downside several months ago as its high-end customer base was made it resilient in the face of declines from Visa (V) and Mastercard (MA). However, the last couple months have seen it drop by 20% from highs, falling into a negative trend and moving down to hold territory as an oversold 3 for 5’er.
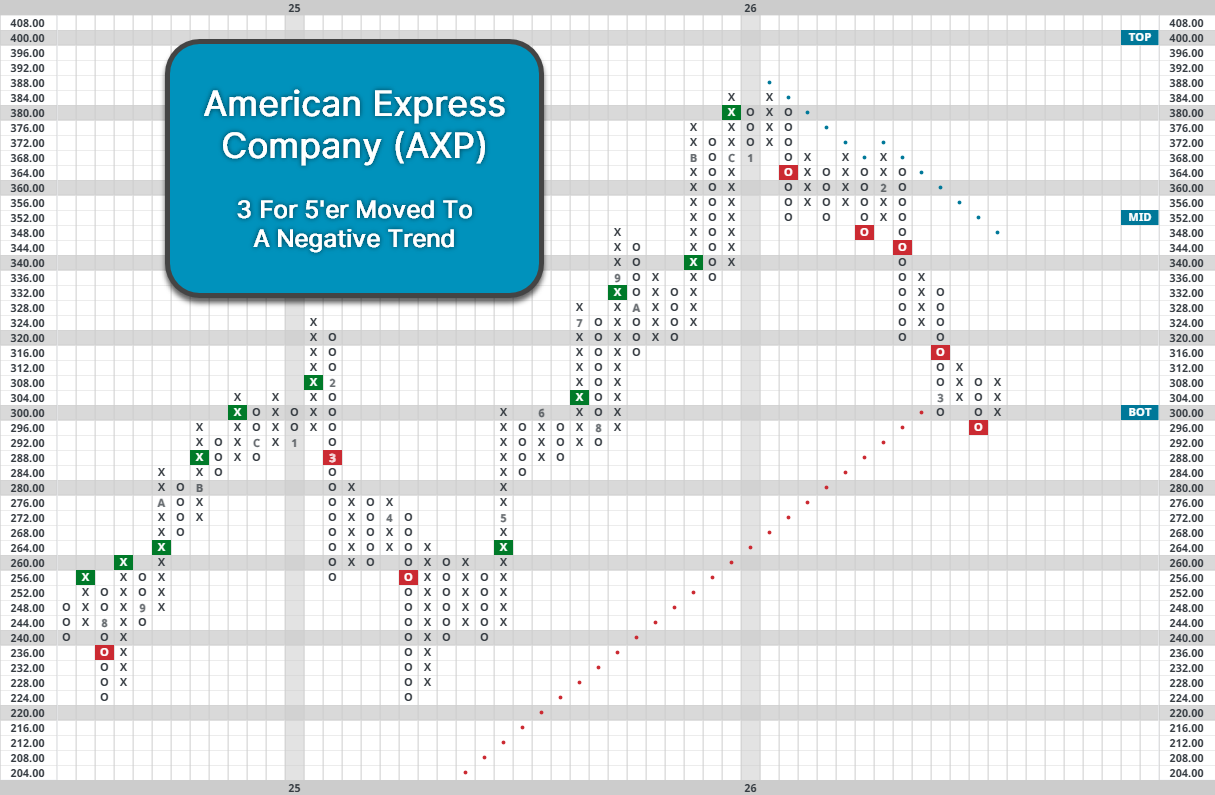
AXP’s selloff is partially due to the potential for AI‑driven white‑collar layoffs to dampen spending by its affluent customer base. When combined with potential business struggles and increases in credit risk, there are some initial signs that the upper branch of the k-shaped economy is starting to slow down. If financials truly are a reflection of the economy and its potential deceleration, then the sector deserves more attention in the coming months as the economy continues to navigate uncertainty. Regardless of what might be driving the sector lower, the relative strength of the sector has undoubtedly been headed in the wrong direction of late, even if it remains in ok territory for the time being.

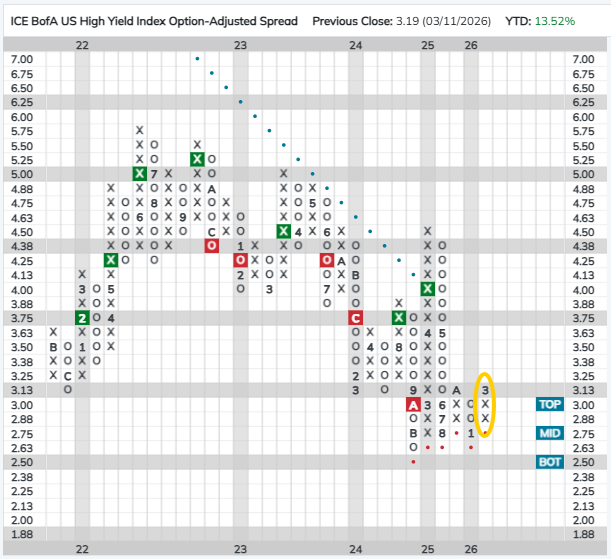
In Friday’s trading, the ICE BofA US High Yield Index Option Adjusted Spread (HIGHYIELDSPREAD), which measures the yield spread between high yield bonds and US Treasuries, reversed up into a column of Xs reflecting widening high yield spreads. The other high yield spread index that we track on the site (CBUS10YRSPREAD) reversed into Xs in February. The widening of high yield spreads is potentially a sign of a risk-off shift toward credit in the bond market and a warning sign to high yield investors. There have already been signs of weakness in high yield bonds – in the Asset Class Group Scores, the high yield corporates group has seen its average score decline from around 3.15 and the beginning of the year to its current score of 2.74.
More significantly for many investors, high yield spreads are also considered to be a bellwether for the economy (or at least economic sentiment) and equities. When investors are worried about the possibility of recession and by extension that borrowers (i.e., bond issuers) won’t be able to service their debt, they demand a higher return for the (perceived) increase in risk and high yield spreads widen. Conversely, when the economy is perceived as being strong, investors are more willing to lend and high yield spreads contract. In an extreme example, high yield spreads widened by more than 700 bps in March of 2020 amid fears of an economic collapse at the outset of the COVID-19 pandemic. Last year, CBUS10YRSPREAD rose about 180 bps in March and April amid tariff worries.
The economy and the stock market are not one in the same, but there is a typically a strong relationship between the two and US equities have historically performed significantly better when high yield spreads are narrowing, indicating favorable economic conditions. The table below shows the quarterly performance of the S&P 500 when high yield spreads are narrowing versus when they are widening. It is also apparent that the magnitude of the change is also change is also significant as the S&P has performed better during quarters when spreads narrowed significantly and worse when they widened by a large amount.

The practical implication of this relationship is that equity investors would be well-served to keep an eye on high yield spreads as widening spreads could signal trouble for stocks while narrowing spreads have historically been associated with positive returns. Another consequence of the relationship between high yield spreads and equities is that investors seeking safety and diversification from their fixed income allocations may want to limit their exposure to high yield bonds. High yield bond prices decline as spreads widen and, as we’ve seen, equities also tend to perform poorly during periods when spreads are widening. Therefore, investors with large high yield allocations are likely to see their bond portfolio decline at the same time as their equity exposure.
We don’t want to overblow the significance of the reversal on HIGHYIELDSPREAD’s chart, as you can see there was another reversal in the last year that was ultimately short-lived and it does not necessarily mean that the S&P will finish the quarter in the red. But, with other signs – like US equities falling to third in DALI – that sentiment may be shifting to risk-off it is worth taking note of what the bond market has to tell us.
Average Level
-8.05
| < - -100 | -100 - -80 | -80 - -60 | -60 - -40 | -40 - -20 | -20 - 0 | 0 - 20 | 20 - 40 | 40 - 60 | 60 - 80 | 80 - 100 | 100 - > |
|---|---|---|---|---|---|---|---|---|---|---|---|
|
Buy signalefa
|
|||||||||||
|
Buy signaliwm
|
|||||||||||
|
Buy signalijr
|
|||||||||||
|
Sell signaltlt
|
|||||||||||
|
Buy signalVOOV
|
|||||||||||
|
Sell signalXLG
|
|||||||||||
|
Buy signalSPY
|
|||||||||||
|
Buy signalIJH
|
|||||||||||
|
Buy signalief
|
|||||||||||
|
Sell signallqd
|
Buy signalrsp
|
||||||||||
|
Buy signalfxe
|
Buy signaldia
|
Sell signalONEQ
|
Buy signalQQQ
|
Buy signalicf
|
Buy signalGSG
|
||||||
|
Buy signalhyg
|
Buy signalshy
|
Buy signalagg
|
Sell signalVOOG
|
Buy signalEEM
|
Buy signaldvy
|
Buy signalGLD
|
Sell signaldx/y
|
Buy signalGCC
|
Buy signalUSO
|
||
| < - -100 | -100 - -80 | -80 - -60 | -60 - -40 | -40 - -20 | -20 - 0 | 0 - 20 | 20 - 40 | 40 - 60 | 60 - 80 | 80 - 100 | 100 - > |
| AGG | iShares US Core Bond ETF |
| USO | United States Oil Fund |
| DIA | SPDR Dow Jones Industrial Average ETF |
| DVY | iShares Dow Jones Select Dividend Index ETF |
| DX/Y | NYCE U.S.Dollar Index Spot |
| EFA | iShares MSCI EAFE ETF |
| FXE | Invesco CurrencyShares Euro Trust |
| GLD | SPDR Gold Trust |
| GSG | iShares S&P GSCI Commodity-Indexed Trust |
| HYG | iShares iBoxx $ High Yield Corporate Bond ETF |
| ICF | iShares Cohen & Steers Realty ETF |
| IEF | iShares Barclays 7-10 Yr. Tres. Bond ETF |
| LQD | iShares iBoxx $ Investment Grade Corp. Bond ETF |
| IJH | iShares S&P 400 MidCap Index Fund |
| ONEQ | Fidelity Nasdaq Composite Index Track |
| QQQ | Invesco QQQ Trust |
| RSP | Invesco S&P 500 Equal Weight ETF |
| IWM | iShares Russell 2000 Index ETF |
| SHY | iShares Barclays 1-3 Year Tres. Bond ETF |
| IJR | iShares S&P 600 SmallCap Index Fund |
| SPY | SPDR S&P 500 Index ETF Trust |
| TLT | iShares Barclays 20+ Year Treasury Bond ETF |
| GCC | WisdomTree Continuous Commodity Index Fund |
| VOOG | Vanguard S&P 500 Growth ETF |
| VOOV | Vanguard S&P 500 Value ETF |
| EEM | iShares MSCI Emerging Markets ETF |
| XLG | Invesco S&P 500 Top 50 ETF |

| Symbol | Company | Sector | Current Price | Action Price | Target | Stop | Notes |
|---|---|---|---|---|---|---|---|
| ABBV | AbbVie Inc. | Drugs | $227.68 | 210s - low 230s | 284 | 188 | 5 for 5'er, favored DRUG sector, LT pos peer & mkt RS, breakout from consec sell signals, 2.9% yield |
| AB | AllianceBernstein Holding LP | Wall Street | $39.25 | low 40s | 64 | 32 | 3 TA rating, LT mkt RS buy, LT pos trend, top 50% of WALL sector matrix, consec buy signals, buy-on-pullback, yield > 8% |
| ZWS | Zurn Elkay Water Solutions Corp. | Machinery and Tools | $47.01 | hi 40s - lo 50s | 95 | 42 | 5 TA rating, LT pos trend, LT mkt RS buy, consec buy signals, buy-on-pullback |
| CACI | CACI International Inc. | Computers | $604.38 | 570s - 600s | 672 | 528 | 5 for 5'er, top 25% of COMP sector matrix, LT pos mkt RS, triple top breakout |
| WBS | Webster Financial Corporation | Banks | $68.77 | hi 60s - low 70s | 91 | 58 | 4 for 5'er, top 25% of BANK sector matrix, one box from peer RS buy, buy on pullback, 2.2% yield |
| MCK | McKesson Corporation | Drugs | $934.29 | 396-hi 470s | 1304 | 752 | 5 TA rating, top 33% of DRUG sector matrix, LT RS buy, consec buy signals, buy-on-pullback |
| CGON | CG Oncology, Inc. | Biomedics/Genetics | $64.66 | hi 50s - low 60s | 80 | 50 | 5 for 5'er, 18 of 162 in BIOM sector matrix, bullish catapult, good R-R, Earn. 3/26 |
| AZN | Astrazeneca Group PLC Ads (United Kingdom) ADR | Drugs | $193.31 | mid 180s - upper 190s | 236 | 160 | 4 for 5'er, top 25% of DRUG sector matrix, LT pos peer RS, one box from mkt RS buy, bullish triangle |
| RTX | RTX Corp. | Aerospace Airline | $207.26 | upper 190s to mid 210s | 254 | 166 | 4/5'er; top third of Aero matrix; Peer RS within 1 box of RS buy; ATHs on 3/2. |
| COCO | Vita Coco Company, Inc. | Food Beverages/Soap | $57.69 | mid-to-hi 50s | 72 | 48 | 5 for 5'er, top half of FOOD sector matrix, LT pos peer & mkt RS, pos trend flip |
| DGII | Digi International Inc | Telephone | $50.50 | upper 40s to lower 50s | 61 | 40 | 5 for 5'er; top quartile of Telephone matrix; buy signal since May '25, pos. trend since June '25. |
| Symbol | Company | Sector | Current Price | Action Price | Target | Stop | Notes |
|---|---|---|---|---|---|---|---|
| CPRT | Copart Incorporated | Autos and Parts | $35.55 | hi 30s | 28 | 42 | 1 TA rating, bottom 50% of AUTO sector matrix, NT and mkt RS sell last month, consec sell signals |
| Comment | |||||||
|---|---|---|---|---|---|---|---|
|
|
|||||||
DGII Digi International Inc ($49.62) - Telephone - DGII has been a 5 for 5’er since November 2025 and currently ranks within the top quartile of the Telephone sector matrix. The stock maintains superior near and long-term relative strength against the market and its peer groups having maintained RS buy signals since November. On the trend chart, DGII has sustained a positive trend since June 2025 and buy signal since May of last year as well. February’s trading led to a fifth consecutive buy signal as shares rallied to a new all-time chart at $51. After a brief pullback in the latter part of February, the chart has returned to Xs and matched the chart high. DGII resides in actionable territory and could be considered in upper $40 to lower $50 range. The bullish price objective of $61 will serve as the price target, and the initial stop loss point will be set at $40, which would violate multiple levels of support dating back January.
| 25 | 26 | ||||||||||||||||||||||||||||
| 51.00 | X | X | 51.00 | ||||||||||||||||||||||||||
| 50.00 | X | O | 3 | 50.00 | |||||||||||||||||||||||||
| 49.00 | X | O | X | 49.00 | |||||||||||||||||||||||||
| 48.00 | X | X | O | X | 48.00 | ||||||||||||||||||||||||
| 47.00 | X | O | X | X | O | 47.00 | |||||||||||||||||||||||
| 46.00 | X | O | 2 | O | X | 46.00 | |||||||||||||||||||||||
| 45.00 | X | O | X | O | X | Mid | 45.00 | ||||||||||||||||||||||
| 44.00 | X | C | O | X | O | 44.00 | |||||||||||||||||||||||
| 43.00 | X | O | X | 1 | X | 43.00 | |||||||||||||||||||||||
| 42.00 | X | O | X | O | X | 42.00 | |||||||||||||||||||||||
| 41.00 | X | O | X | O | 41.00 | ||||||||||||||||||||||||
| 40.00 | X | O | X | 40.00 | |||||||||||||||||||||||||
| 39.00 | A | X | O | X | 39.00 | ||||||||||||||||||||||||
| 38.00 | • | X | O | X | O | X | 38.00 | ||||||||||||||||||||||
| 37.00 | X | • | X | O | X | O | 37.00 | ||||||||||||||||||||||
| 36.00 | X | O | • | 7 | 9 | B | X | • | 36.00 | ||||||||||||||||||||
| 35.00 | X | O | • | 6 | O | X | O | • | Bot | 35.00 | |||||||||||||||||||
| 34.00 | • | X | X | X | O | X | O | X | • | 34.00 | |||||||||||||||||||
| 33.00 | • | X | O | X | O | X | X | O | X | O | X | • | 33.00 | ||||||||||||||||
| 32.00 | • | B | O | X | O | X | O | X | O | X | 8 | X | • | 32.00 | |||||||||||||||
| 31.00 | X | O | C | X | O | X | O | X | O | • | 31.00 | ||||||||||||||||||
| 30.00 | X | O | X | 2 | 3 | X | • | 30.00 | |||||||||||||||||||||
| 29.00 | X | A | 1 | X | • | O | X | • | 29.00 | ||||||||||||||||||||
| 28.00 | X | O | X | O | • | O | 5 | • | 28.00 | ||||||||||||||||||||
| 27.00 | X | O | X | • | 4 | X | X | • | 27.00 | ||||||||||||||||||||
| 26.00 | O | X | 9 | • | O | X | O | X | • | 26.00 | |||||||||||||||||||
| 25.00 | O | X | • | O | X | O | X | • | 25.00 | ||||||||||||||||||||
| 24.00 | 8 | X | • | O | X | O | • | 24.00 | |||||||||||||||||||||
| 23.00 | O | X | • | O | • | • | 23.00 | ||||||||||||||||||||||
| 22.00 | O | X | • | • | 22.00 | ||||||||||||||||||||||||
| 21.00 | O | • | 21.00 | ||||||||||||||||||||||||||
| 25 | 26 |
| ALNY Alnylam Pharmaceuticals Inc. ($313.05) - Biomedics/Genetics - ALNY inched lower to complete a double bottom break at $312. The 2 for 5'er moved down from a 3 last month after reversing back into a negative trend. Additionally, the stock ranks near the bottom of the biomedics/genetics sector matrix. A sell can be considered here. Initial resistance can be seen at $328, with additional resistance at $344. |
| CE Celanese Corporation ($59.38) - Chemicals - CE returned to a buy signal and a positive trend Thursday when it broke a double top at $56. The positive trend change will promote CE to a still unfavorable 2 for 5'er. From here, the next level of overhead resistance sits at $61. |
| CVX Chevron Corporation ($196.97) - Oil - CVX gave a fourth consecutive buy signal and reached a new all-time high on Thursday when it broke a double top at $194. Thursday's move adds to an already positive technical outlook as CVX is a 3 for 5'er and ranks in the top quartile of the oil sector matrix. However, the stock is now heavily extended with a weekly OBOS reading approaching 120%. |
| DELL Dell Technologies Inc Class C ($149.91) - Computers - Shares of DELL have improved notably over the last several weeks, and today's action saw the stock break a double top at $150 to return to a buy signal. The 5 for 5'er moved into a positive trend while regaining most of its relative strength over the last month, taking it back to strong buy territory. However, the stock is now in overbought territory, so those looking to add should wait for pullback or consolidation. Support starts at $138 while initial resistance lies at $152. |
| GE GE Aerospace ($304.27) - Aerospace Airline - Quick comment for GE today as the 4/5'er has posted its second consecutive sell signal on its default chart. While the development certainly isn't bullish by any means, we have still put in a series of higher lows coming of recent December bottoms. Keep a close eye on the name for further technical deterioration... but you're fine to maintain exposure for now. Support is found at the 2026 lows around $292. |
| MS Morgan Stanley ($153.63) - Wall Street - MS shares moved lower today to break a double bottom at $154 to mark its third consecutive sell signal. This 4 for 5'er moved to a negative trend last week but maintains an RS buy signal versus the market that has been in place since June 2013. MS shares are trading in heavily oversold territory. From here, support is offered at $152. |
| SPG Simon Property Group, Inc. ($187.57) - Real Estate - Shares of SPG moved lower during Thursday's trading, completely its second consecutive sell signal. Additionally, today's action saw the stock flip its trend back to negative, bringing it down to a 4 for 5'er. However, for the time being, the stock remains more a buy given its market and peer relative strength. Initial support starts at $182. |
| TMO Thermo Fisher Scientific Inc. ($476.77) - Healthcare - TMO inched lower to complete a triple bottom break at $488, marking its second consecutive sell signal. The 2 for 5'er moved down from a 4 last month after moving back into a negative trend and reversing into a column of Os against the market. The weekly OBOS indicates that the stock is in oversold territory, so wait for the 10-week trading band to normalize before selling your position. Strong resistance can be seen at $520. The bearish resistance line can be seen at $608. |

| Name | Option Symbol | Action | Stop Loss |
|---|---|---|---|
| Cisco Systems, Inc. - $77.76 | CSCO2618F80 | Buy the June 80.00 calls at 4.25 | 73.00 |
| Name | Option | Action |
|---|---|---|
| J.P. Morgan Chase & Co. ( JPM) | May. 310.00 Calls | Stopped at 280.00 (CP: 282.91) |
| GE Aerospace ( GE) | May. 340.00 Calls | Stopped at 308.00 (CP: 304.27) |
| Archer-Daniels-Midland Company ( ADM) | Jun. 67.50 Calls | Raise the option stop loss to 5.90 (CP: 7.90) |
| Name | Option Symbol | Action | Stop Loss |
|---|---|---|---|
| Amazon.com Inc. - $209.46 | AMZN2618R205 | Buy the June 205.00 puts at 13.60 | 224.00 |
| Name | Option | Action |
|---|---|---|
| General Mills, Inc. ( GIS) | Apr. 45.00 Puts | Raise the option stop loss to 4.00 (CP: 6.00) |
| MetLife, Inc. ( MET) | Apr. 77.50 Puts | Raise the option stop loss to 6.20 (CP: 8.20) |
| Mosaic Company ( MOS) | Jun. 25.00 Puts | Stopped at 32.00 (CP: 31.04) |
| Name | Option Sym. | Call to Sell | Call Price | Investment for 500 Shares | Annual Called Rtn. | Annual Static Rtn. | Downside Protection |
|---|---|---|---|---|---|---|---|
| Devon Energy Corporation $ 45.36 | DVN2618F47.5 | Jun. 47.50 | 3.20 | $ 21,716.70 | 30.60% | 22.98% | 5.87% |
| Name | Action |
|---|---|
| Intel Corporation ( INTC) - 47.98 | Sell the May 49.00 Calls. |
| Freeport-McMoRan Inc. ( FCX) - 61.54 | Sell the June 65.00 Calls. |
| Micron Technology, Inc. ( MU) - 418.69 | Sell the June 420.00 Calls. |
| Moderna, Inc. ( MRNA) - 55.97 | Sell the April 55.00 Calls. |
| Cameco Corporation ( CCJ) - 115.39 | Sell the April 120.00 Calls. |
| Fortinet Inc. ( FTNT) - 83.48 | Sell the May 85.00 Calls. |
| CAVA Group, Inc. ( CAVA) - 80.50 | Sell the April 80.00 Calls. |
| Name | Covered Write |
|---|---|
| Invesco PLC ( IVZ - 23.95 ) | April 24.00 covered write. |
Daily Equity & Market Analysis
LISTEN TO PODCAST
Mar 12, 2026
NDW MORNING UPDATE
Mar 12, 2026
Loading, Please Wait...
