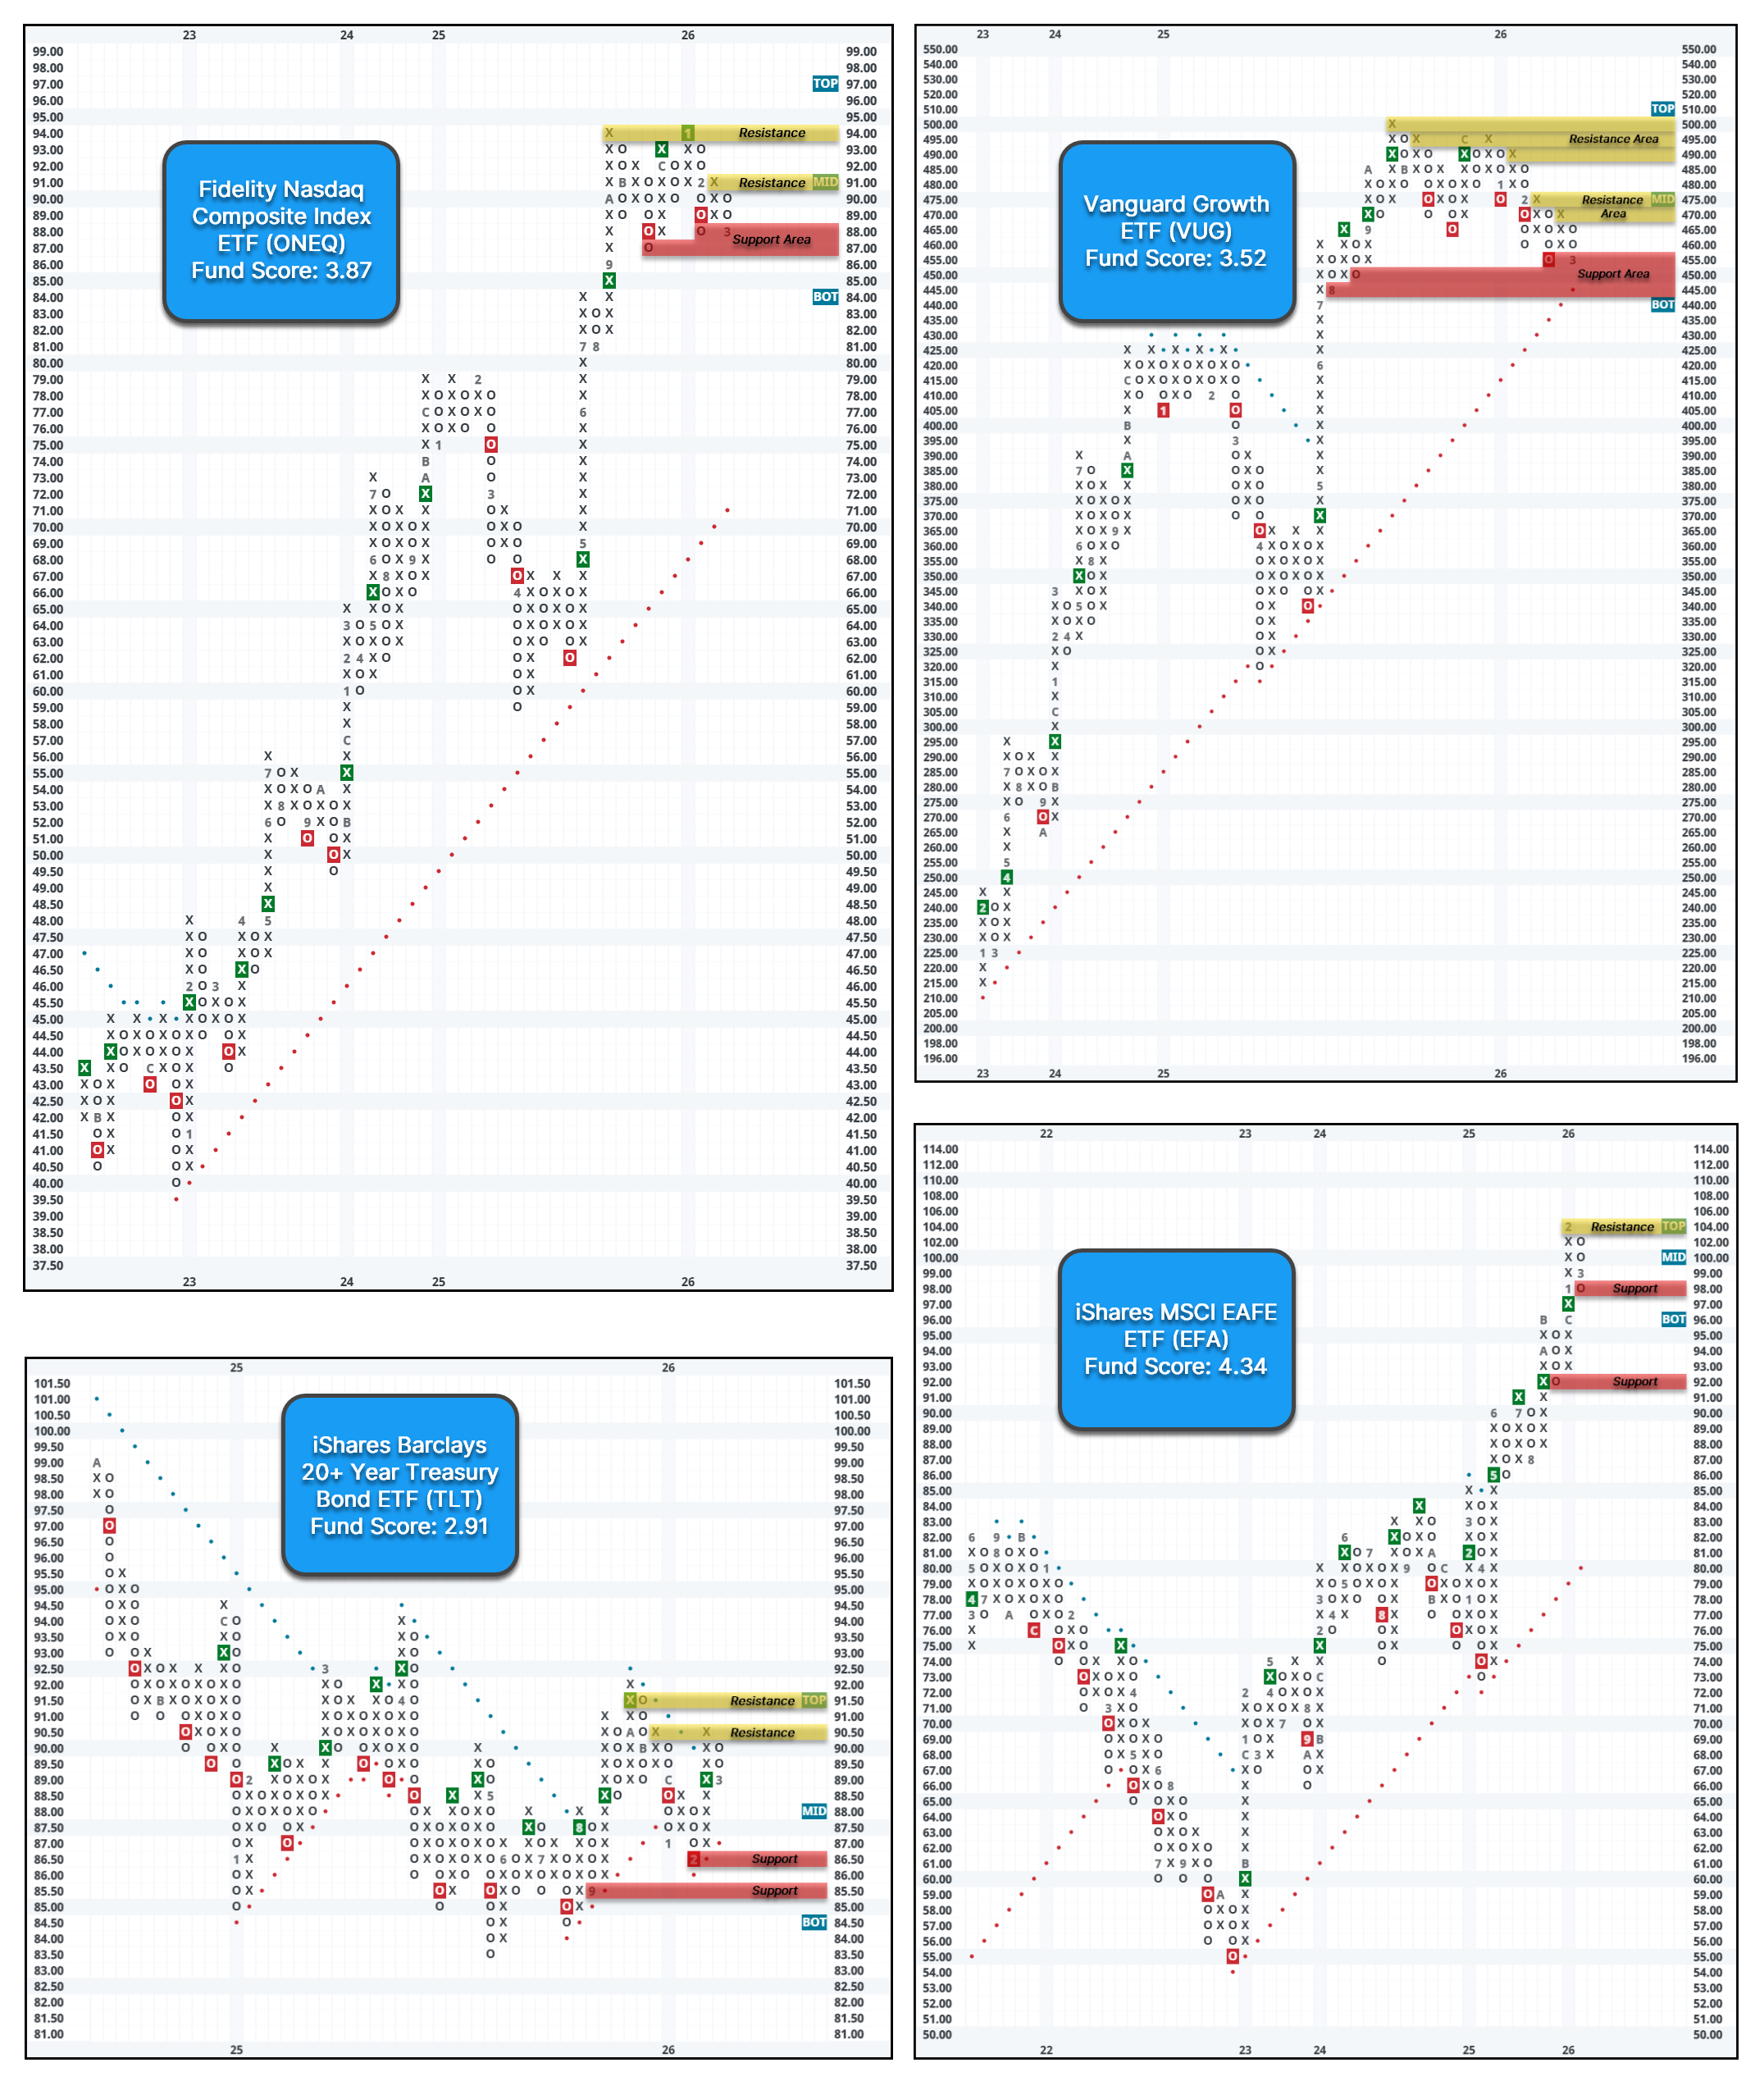
Most Requested Symbols

Market regimes have shifted rapidly in recent months, making it more important than ever to stay aligned with evolving leadership trends. As an alternative core equity approach, you may want to consider the NDW Large Cap Core Model (TR0.
Five months can seem like the blink of an eye to some investors, but in the world of cryptocurrencies, it can feel like a lifetime. With all significant movement over the last several months, how should we handle Bitcoin?
The curve has an average reading of 8.74%.
Weekly Rundown Video – Mar 4, 2026
Weekly rundown with NDW analyst team covering all major asset classes.
Weekly rundown with NDW analyst team covering all major asset classes.
Market regimes have shifted rapidly in recent months, making it more important than ever to stay aligned with evolving leadership trends. As many of you know, simply indexing client portfolios to the S&P 500 and hoping to ride long‑term market strength is not always sufficient, especially in periods of dispersion and rotation. These shifts have created an environment where traditional cap‑weighted exposure can lag meaningfully, as leadership narrows and sector performance diverges, underscoring the growing need for a more tactical, adaptive approach.
As an alternative core equity approach, you may want to consider the NDW Large Cap Core Model (TR) (NDWLCCORE.TR). In brief, the model:
To start the year, the model is up 9.03%, outperforming the S&P 500 Total Return benchmark (TR.SPXX) by more than 9 percentage points. Over the past year, the model has returned 34%, roughly 16 points above the benchmark. Since inception in 1993, the model has delivered an annualized return of 15.2%, exceeding its benchmark by more than 4.5%.

For those interested in deeper analysis, the Stats tab provides additional performance and risk metrics. While the model carries slightly higher volatility, its Sharpe Ratio (0.62 vs. 0.56) reflects stronger risk‑adjusted performance.
Much of the recent outperformance stems from the model’s strategic overweight to areas of relative strength and underweight to areas showing deterioration. As shown in the sector comparison below, the model remains underweight Technology and Financials—two sectors that have weakened technically in recent months—while overweighting Industrials and Basic Materials, both of which rank among the top 3 sectors in our DALI framework.

For those looking for single-stock ideas, it is sometimes helpful to look at a model’s holdings to identify leadership names and relative outperforms. Within the NDW Large Cap Core Model, the model purchased Howmet Aerospace Inc. (HWM) in July 2024. Since then, the stock has had an absolute performance of 163% over the course of just under two years. The stock is up over 20% year-to-date (YTD) and sits on two consecutive buy signals, after completing a double top break at $228 last month. The 5 for 5’er has been in a positive trend since 2022 and currently ranks in the top quartile of the aerospace airline sector matrix. HWM sits near overbought territory but is still actionable at current levels. Initial support is at $208, with additional support between $188-$192. Initial resistance can be seen at $264, its previous all-time high.

In conclusion, the NDW Large Cap Core Model can provide a viable solution for those interested in large‑cap exposure with a momentum overlay. Beyond simple index replication, the model offers a disciplined, rules‑based framework designed to adapt to shifting market leadership—an increasingly important advantage in today’s rapidly evolving regime.

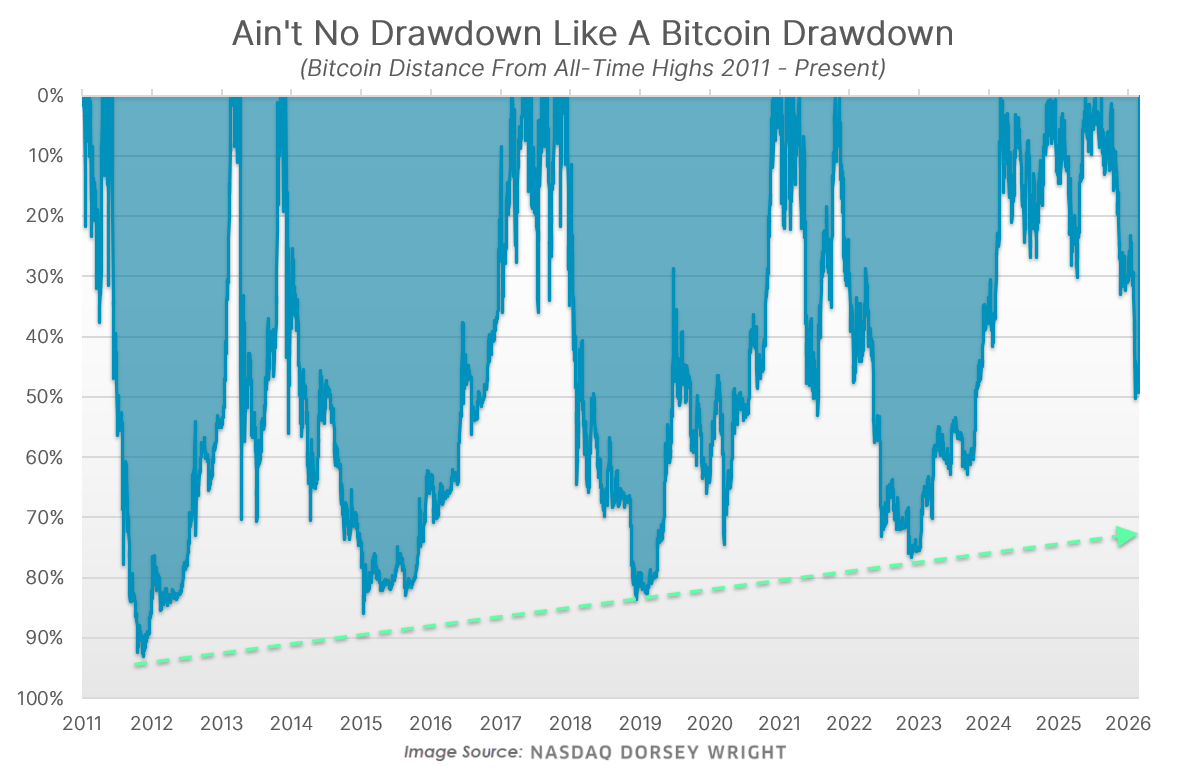
Five months can seem like the blink of an eye to some investors, but in the world of cryptocurrencies, it can feel like a lifetime. Bitcoin was setting new all-time highs above $125k in October with all the steam in the world behind it. Since then, cryptocurrencies have steadily declined, with Bitcoin moving to a sell signal after falling 50% from its all-time high. However, Bitcoin has since reversed back up into a column of Xs, gaining ~15% from its bottom. With all the movement over the last several months, how should we handle Bitcoin?

While a 50% decline in the stock market would be generationally bad, Bitcoin is no stranger to significant downside. In fact, declines of that magnitude should be closer to the expectation than the exception. To give investors a better idea of that experience, we looked at the probability of Bitcoin declining by certain amounts over different holding periods going back to 2011. While the S&P 500 has never declined by 50% or more within a six-month period since 1950, Bitcoin sees a drawdown of 50% or more in a third of six-month periods. Meanwhile, Bitcoin has experienced an intra-year decline of 20% or more in every single one-year period since 2011. Granted, these numbers are the greatest decline within the period, not the overall return, meaning a period can see large drawdowns and still recover. With our current situation beginning to rebound, should we expect the cryptocurrency market to turn around from here?

There have been six other instances in which BTC fell more than 50% from highs before returning to all-time highs. Once Bitcoin officially moves 50% away from its highs, it tends to do pretty well over the following months. Specifically, it averages a 14% return, which is roughly in line with Bitcoin’s 17.1% gain over the last month. However, things usually take a turn for the worse after the first month. Of those six instances, five of them were lower after a full year, averaging a one-year decline of 19%, which bodes poorly for the upcoming year. That said, if Bitcoin’s outlook has taken a turn for the worse, when could we expect the cryptocurrency to potentially bottom and recover?

Of those six instances in which Bitcoin fell an initial 50%, it averaged a maximum drawdown of 76.6%. Said differently, Bitcoin typically gets cut in half for a second time after the initial 50% decline. Additionally, it took an average of 5.7 months after falling 50% before it reached those respective bottoms. Extrapolating that to our current environment, six months from our initial 50% decline would mean that things could bottom in August of this year, but downside has persisted for more than a year as well. Once Bitcoin finally bottomed out in those instances, it took an average of 15 months to get back to all-time highs. However, it’s also taken as long as 25 months and as short as 4 months.
One interesting trend with Bitcoin is that it tends to see a pronounced decline roughly every four years, bottoming in late 2011, 2015, late 2018, and 2022. However, those steeper declines have gradually become less intense over time. For context, Bitcoin was down 76.6% in 2022, but it would’ve needed an additional 70% decline from that point to match 2011’s 93.1% decline. Using some guesswork and continuing that trend, it wouldn’t be surprising to see things bottom out around a drawdown of 70%, which would correspond to a price of around $38k for Bitcoin. Granted, that’s a guess assuming things continue lower, but it also falls roughly in line with the ~75% average drawdown when Bitcoin does fall 50%.
Trying to predict where Bitcoin might go is like attempting to predict the winner of the Super Bowl during the regular season. Recent performance can provide some guidance, but all it takes is a week’s worth of action to change everything. The weight of the evidence suggests that Bitcoin has more room for downside, but investors should watch for signs of improvement if Bitcoin truly has turned a new corner, as cryptocurrencies are known to move quicker than anything else
| Symbol | Name | Price | Yield | PnF Trend | RS Signal | RS Col. | Fund Score | 200 Day MA | Weekly Mom |
|---|---|---|---|---|---|---|---|---|---|
| DIA | State Street SPDR Dow Jones Industrial Average ETF Trust | 479.84 | 1.40 | Positive | Sell | X | 3.63 | 463.29 | - 4W |
| EEM | iShares MSCI Emerging Markets ETF | 57.63 | 1.94 | Positive | Buy | X | 5.22 | 53.06 | - 1W |
| EFA | iShares MSCI EAFE ETF | 99.16 | 3.08 | Positive | Sell | X | 4.01 | 94.11 | - 1W |
| IJH | iShares S&P MidCap 400 Index Fund | 69.86 | 1.25 | Positive | Buy | O | 4.36 | 65.43 | - 2W |
| IJR | iShares S&P SmallCap 600 Index Fund | 127.66 | 1.33 | Positive | Sell | O | 3.25 | 118.24 | - 3W |
| QQQ | Invesco QQQ Trust | 608.91 | 0.46 | Positive | Buy | O | 4.18 | 588.43 | - 10W |
| RSP | Invesco S&P 500 Equal Weight ETF | 200.54 | 1.53 | Positive | Sell | O | 3.27 | 189.23 | - 1W |
| SPY | State Street SPDR S&P 500 ETF Trust | 681.31 | 1.06 | Positive | Buy | X | 4.73 | 656.05 | - 10W |
| XLG | Invesco S&P 500 Top 50 ETF | 57.24 | 0.67 | Positive | Buy | O | 3.88 | 56.10 | - 10W |

Average Level
8.74
| < - -100 | -100 - -80 | -80 - -60 | -60 - -40 | -40 - -20 | -20 - 0 | 0 - 20 | 20 - 40 | 40 - 60 | 60 - 80 | 80 - 100 | 100 - > |
|---|---|---|---|---|---|---|---|---|---|---|---|
|
Buy signalijr
|
|||||||||||
|
Buy signalXLG
|
Buy signalSPY
|
Buy signalIJH
|
|||||||||
|
Buy signalefa
|
Buy signalQQQ
|
Buy signalief
|
|||||||||
|
Sell signalVOOG
|
Buy signaliwm
|
Buy signalVOOV
|
Buy signaldvy
|
||||||||
|
Buy signalshy
|
Sell signalONEQ
|
Sell signallqd
|
Sell signaltlt
|
Buy signalgcc
|
Buy signalGSG
|
||||||
|
Buy signalhyg
|
Buy signalfxe
|
Buy signaldia
|
Buy signalEEM
|
Buy signalagg
|
Buy signalrsp
|
Buy signalGLD
|
Sell signaldx/y
|
Buy signalicf
|
Buy signalUSO
|
||
| < - -100 | -100 - -80 | -80 - -60 | -60 - -40 | -40 - -20 | -20 - 0 | 0 - 20 | 20 - 40 | 40 - 60 | 60 - 80 | 80 - 100 | 100 - > |
| AGG | iShares US Core Bond ETF |
| USO | United States Oil Fund |
| DIA | SPDR Dow Jones Industrial Average ETF |
| DVY | iShares Dow Jones Select Dividend Index ETF |
| DX/Y | NYCE U.S.Dollar Index Spot |
| EFA | iShares MSCI EAFE ETF |
| FXE | Invesco CurrencyShares Euro Trust |
| GLD | SPDR Gold Trust |
| GSG | iShares S&P GSCI Commodity-Indexed Trust |
| HYG | iShares iBoxx $ High Yield Corporate Bond ETF |
| ICF | iShares Cohen & Steers Realty ETF |
| IEF | iShares Barclays 7-10 Yr. Tres. Bond ETF |
| LQD | iShares iBoxx $ Investment Grade Corp. Bond ETF |
| IJH | iShares S&P 400 MidCap Index Fund |
| ONEQ | Fidelity Nasdaq Composite Index Track |
| QQQ | Invesco QQQ Trust |
| RSP | Invesco S&P 500 Equal Weight ETF |
| IWM | iShares Russell 2000 Index ETF |
| SHY | iShares Barclays 1-3 Year Tres. Bond ETF |
| IJR | iShares S&P 600 SmallCap Index Fund |
| SPY | SPDR S&P 500 Index ETF Trust |
| TLT | iShares Barclays 20+ Year Treasury Bond ETF |
| GCC | WisdomTree Continuous Commodity Index Fund |
| VOOG | Vanguard S&P 500 Growth ETF |
| VOOV | Vanguard S&P 500 Value ETF |
| EEM | iShares MSCI Emerging Markets ETF |
| XLG | Invesco S&P 500 Top 50 ETF |
| Symbol | Company | Sector | Current Price | Action Price | Target | Stop | Notes |
|---|---|---|---|---|---|---|---|
| ABBV | AbbVie Inc. | Drugs | $232.35 | 210s - low 230s | 284 | 188 | 5 for 5'er, favored DRUG sector, LT pos peer & mkt RS, breakout from consec sell signals, 2.9% yield |
| AB | AllianceBernstein Holding LP | Wall Street | $38.54 | low 40s | 64 | 32 | 3 TA rating, LT mkt RS buy, LT pos trend, top 50% of WALL sector matrix, consec buy signals, buy-on-pullback, yield > 8% |
| PKG | Packaging Corp of America | Forest Prods/Paper | $226.22 | hi 200s - mid 230s | 358 | 184 | 4 TA rating, top 20% of FORE sector RS matrix, LT RS buy, buy-on-pullback |
| ZWS | Zurn Elkay Water Solutions Corp. | Machinery and Tools | $48.44 | hi 40s - lo 50s | 95 | 42 | 5 TA rating, LT pos trend, LT mkt RS buy, consec buy signals, buy-on-pullback |
| CACI | CACI International Inc. | Computers | $612.52 | 570s - 600s | 672 | 528 | 5 for 5'er, top 25% of COMP sector matrix, LT pos mkt RS, triple top breakout |
| CAKE | The Cheesecake Factory Incorporated | Restaurants | $62.99 | low-to-mid 60s | 96 | 52 | 5 for 5'er, top 20% of REST sector matrix, LT pos mkt RS, multiple buy signals, R-R>2.5, 1.8% yield |
| WBS | Webster Financial Corporation | Banks | $69.08 | hi 60s - low 70s | 91 | 58 | 4 for 5'er, top 25% of BANK sector matrix, one box from peer RS buy, buy on pullback, 2.2% yield |
| MCK | McKesson Corporation | Drugs | $931.35 | 396-hi 470s | 1304 | 752 | 5 TA rating, top 33% of DRUG sector matrix, LT RS buy, consec buy signals, buy-on-pullback |
| CGON | CG Oncology, Inc. | Biomedics/Genetics | $60.30 | hi 50s - low 60s | 80 | 50 | 5 for 5'er, 18 of 162 in BIOM sector matrix, bullish catapult, good R-R, Earn. 3/26 |
| Symbol | Company | Sector | Current Price | Action Price | Target | Stop | Notes |
|---|---|---|---|---|---|---|---|
| CPRT | Copart Incorporated | Autos and Parts | $38.02 | hi 30s | 28 | 42 | 1 TA rating, bottom 50% of AUTO sector matrix, NT and mkt RS sell last month, consec sell signals |
| Comment | |||||||
|---|---|---|---|---|---|---|---|
|
|
|||||||
CGON CG Oncology, Inc. R ($62.04) - Biomedics/Genetics - CGON is a 5 for 5'er that ranks 18th of 162 names in the biomedics/genetics sector matrix. After giving two consecutive sell signals, CGON rallied, returning to a buy signal with a triple top break at $56 last month. In this week's trading, the stock gave a second consecutive buy signal when it completed a bullish catapult at $60. Long exposure may be added in the upper $50s to low $60s and we will set our initial stop at $50, which would violate CGON's bullish support line. We will use the bullish price objective, $80, as our target price. CGON is expected to report earnings on 3/26.
| 26 | |||||||||||||||||||||||||||||
| 63.00 | X | 63.00 | |||||||||||||||||||||||||||
| 62.00 | X | O | 62.00 | ||||||||||||||||||||||||||
| 61.00 | X | O | 61.00 | ||||||||||||||||||||||||||
| 60.00 | 3 | O | 60.00 | ||||||||||||||||||||||||||
| 59.00 | X | X | 59.00 | ||||||||||||||||||||||||||
| 58.00 | X | O | X | 58.00 | |||||||||||||||||||||||||
| 57.00 | X | X | X | O | X | 57.00 | |||||||||||||||||||||||
| 56.00 | X | O | X | X | O | X | O | 56.00 | |||||||||||||||||||||
| 55.00 | X | O | X | O | X | O | X | 2 | X | 55.00 | |||||||||||||||||||
| 54.00 | X | O | X | O | X | O | X | O | X | O | X | 54.00 | |||||||||||||||||
| 53.00 | X | O | X | O | O | X | O | X | O | X | 53.00 | ||||||||||||||||||
| 52.00 | X | O | O | O | O | X | 52.00 | ||||||||||||||||||||||
| 51.00 | X | O | X | • | Mid | 51.00 | |||||||||||||||||||||||
| 50.00 | X | O | X | • | 50.00 | ||||||||||||||||||||||||
| 49.00 | X | O | • | 49.00 | |||||||||||||||||||||||||
| 48.00 | X | • | 48.00 | ||||||||||||||||||||||||||
| 47.00 | X | • | 47.00 | ||||||||||||||||||||||||||
| 46.00 | X | X | • | 46.00 | |||||||||||||||||||||||||
| 45.00 | X | X | X | X | O | X | • | 45.00 | |||||||||||||||||||||
| 44.00 | X | O | X | O | X | X | O | X | O | X | • | 44.00 | |||||||||||||||||
| 43.00 | X | O | X | O | X | O | X | O | X | O | X | • | 43.00 | ||||||||||||||||
| 42.00 | O | X | O | X | O | X | C | O | 1 | • | 42.00 | ||||||||||||||||||
| 41.00 | O | B | X | X | O | O | X | • | 41.00 | ||||||||||||||||||||
| 40.00 | O | X | O | X | O | X | • | 40.00 | |||||||||||||||||||||
| 39.00 | O | X | O | X | O | X | • | 39.00 | |||||||||||||||||||||
| 38.00 | O | O | X | O | • | 38.00 | |||||||||||||||||||||||
| 37.00 | O | X | • | 37.00 | |||||||||||||||||||||||||
| 36.00 | O | • | Bot | 36.00 | |||||||||||||||||||||||||
| 26 |

| AXP American Express Company ($300.94) - Finance - AXP shares moved lower today to break a double bottom at $296 to mark its fifth consecutive sell signal and enter a negative trend. This 4 for 5'er has been on an RS buy signal versus the market since February 2022. AXP shares are trading in heavily oversold territory with a weekly overbought/oversold reading of -111%. From here, support is offered at $292, $288, and $284. |
| CG The Carlyle Group LP ($49.40) - Wall Street - CG shares moved lower today to break a double bottom at $49 to mark its third consecutive sell signal. This 2 for 5'er has been in a negative trend since February but on an RS buy signal versus the market since December 2023. CG shares are trading in heavily oversold territory near the bottom of their ten-week trading band. From here, support is offered at $49. |
| COF Capital One Financial Corporation ($187.51) - Finance - COF shares moved lower today to complete a bearish triangle at $188 to mark its second consecutive sell signal. This 3 for 5'er has been in a negative trend since February but on an RS buy signal versus the market since December 2020. COF shares are trading in heavily oversold territory with a weekly overbought/oversold reading of -92%. From here, support is offered at $184. |
| GAP The Gap, Inc. ($23.44) - Retailing - GAP broke a double bottom at $25 as shares fell to $24, violating the bullish support line. This will shift the trend to negative and drop the stock down to a 3 for 5'er while also placing the market RS chart within one box of reversing down into Os. Support now lies at $20, while additional can be found at 19 and $18. |
| JPM J.P. Morgan Chase & Co. ($288.85) - Banks - JPM shares moved lower today to break a double bottom at $288 to mark its second consecutive sell signal and complete a bearish catapult. This 5 for 5'er has been in a positive trend since November 2023 and on an RS buy signal versus the market since March 2024. JPM shares are trading near the bottom of their ten-week trading band with a weekly overbought/oversold reading of -52%. From here, support is offered at $284. |
| KR The Kroger Co. ($74.63) - Retailing - KR broke a double top at $73 to return to a buy signal as shares rallied to $74, mathcing the stock's all-time chart high. The stock is a 4 for 5'er that ranks within the top third of the Retailing sector matrix and is accompanied by a yield north of 2%. Okay to consider in the lower $70s. Initial support lies at $67, while the bullish support line sits at $65. |
| MS Morgan Stanley ($159.84) - Wall Street - MS shares moved lower to mark their fifth consecutive sell signal and enter a negative trend. This 4 for 5'er has been on an RS buy signal versus the market since June 2013. MS shares are trading in heavily oversold territory with a weekly overbought/oversold reading of -70%. From here, support is offered at $156 and $152. |
| VRTX Vertex Pharmaceuticals Incorporated ($453.53) - Biomedics/Genetics - VRTX inched lower to complete a double bottom break at $456. The 1 for 5'er ranks near the bottom half of the biomedics/genetics sector matrix. A sell can be considered here, given the weight of the evidence and normalization of the 10-week trading band. Strong resistance can be seen at $496. Initial support at $456, with additional support at $440. |
| WFC Wells Fargo & Company ($80.36) - Banks - WFC shares moved lower today to break a double bottom to mark its fourth consecutive sell signal. This 3 for 5'er has been in a negative trend since February but on an RS buy signal versus the market since November 2024. WFC shares are trading in heavily oversold territory with a weekly overbought/oversold reading of -70%. From here, support is offered at $78 and $77. |
| Name | Option Symbol | Action | Stop Loss |
|---|---|---|---|
| AFLAC Incorporated - $111.29 | O: 26E110.00D15 | Buy the May 110.00 calls at 6.20 | 104.00 |
| Name | Option | Action |
|---|---|---|
| Huntington Bancshares Incorporated ( HBAN) | Apr. 18.00 Calls | Stopped at 16.00 (CP: 16.25) |
| Citigroup, Inc. ( C) | Feb. 120.00 Calls | Stopped at 106.00 (CP: 114.34) |
| Name | Option Symbol | Action | Stop Loss |
|---|---|---|---|
| Best Buy Co., Inc. - $66.68 | O: 26Q67.50D15 | Buy the May 67.50 puts at 5.85 | 71.00 |
| Name | Option | Action |
|---|---|---|
| Cal-Maine Foods, Inc. ( CALM) | May. 85.00 Puts | Stopped at 90.00 (CP: 89.67) |
| Marvell Technology Inc. ( MRVL) | Apr. 80.00 Puts | Stopped at 84.00 (CP: 90.68) |
| ARM Holdings PLC ADR ( ARM) | Apr. 130.00 Puts | Raise the option stop loss to 16.35 (CP: 18.35) |
| Abbott Laboratories ( ABT) | Aug. 115.00 Puts | Raise the option stop loss to 7.85 (CP: 9.85) |
| Delta Air Lines Inc. ( DAL) | May. 65.00 Puts | Initiate an option stop loss of 6.80 (CP: 8.80) |
| CBRE Group, Inc. ( CBRE) | Apr. 145.00 Puts | Initiate an option stop loss of 8.10 (CP: 10.10) |
| Name | Option Sym. | Call to Sell | Call Price | Investment for 500 Shares | Annual Called Rtn. | Annual Static Rtn. | Downside Protection |
|---|---|---|---|---|---|---|---|
| Invesco PLC $ 24.73 | O: 26D24.00D17 | Apr. 24.00 | 1.25 | $ 11,334.60 | 41.94% | 38.37% | 4.23% |
| Name | Action |
|---|---|
| Intel Corporation ( INTC) - 45.95 | Sell the May 49.00 Calls. |
| Freeport-McMoRan Inc. ( FCX) - 62.66 | Sell the June 65.00 Calls. |
| Micron Technology, Inc. ( MU) - 397.05 | Sell the June 420.00 Calls. |
| Moderna, Inc. ( MRNA) - 53.83 | Sell the April 55.00 Calls. |
| Cameco Corporation ( CCJ) - 114.24 | Sell the April 120.00 Calls. |
| Name | Covered Write |
|---|---|
| Exxon Mobil Corporation ( XOM - 150.76 ) | June 150.00 covered write. |
Daily Equity & Market Analysis
Loading, Please Wait...
