Most Requested Symbols

The weekly overbought/oversold reading for crude oil was north of 200% overbought, marking its highest level going back to 1983.
Lessons from Marches past.
Weekly Rundown Video – Mar 4, 2026
Weekly rundown with NDW analyst team covering all major asset classes.
Weekly rundown with NDW analyst team covering all major asset classes.
For seven trading days in a row crude oil prices closed higher with Monday’s (3/9) action seeing the commodity rally more than 4%, building on a 12% up day during Friday’s (3/6) trading session. Monday’s trading brought along with it the widest trading range for the commodity in its trading history when considering high and low daily prices going back to the beginning of data in March 1983. With an intraday high of $119.48 and low of $81.19, the over 38-point price range is more than 15 points higher than the trading day with the second widest high-low price range, March 9th, 2022, at 23.
Considering crude’s rise to a four year high just shy of $120 with intraday trading Monday, investors may be a little surprised to have found the commodity closing Monday’s trading in the mid-$90s. Even with the pullback from those intraday highs, the weekly overbought/oversold reading for crude oil was north of 200% overbought, marking its highest level going back to 1983 and appearing more like a temperature boiling point measure than a securitys overbought reading. Along with crude oil, reformulate gasoline (UJ/) has witnessed similar price volatility as the commodity has rallied to historically overbought levels.

While investors are witnessing a historic rise in crude oil prices and other energy related commodities in the short-term, energy related U.S. equities have sustained an overbought stance for longer than their commodity counterparts. Evidence can be found in a variety of places on the platform, but the weekly distribution indicator for the broader energy equity space helps provide the simplest context.
For those not familiar with the weekly distribution (^WD) indicator, it measures the average weekly overbought/oversold (OBOS) reading for the stocks within a given universe. While short-term in nature and prone to quicker fluctuations than most indicators, the WD can be helpful in identifying an exhausted or extended move to the upside (or downside). Like the weekly distribution curve, the WD ranges from -100% to +100%; though the average readings rarely get above 40% or below -40%, making these levels our typical mark for overbought or oversold positions.
Since early February this year, the WD for the Energy sector (^WDECENERGY) has maintained a reading north of 40% for 22 trading days, marking the second longest run of days in overbought or extended territory for the indicator. The longest period of overbought trading days was from December 2003 to January 2004 for 29 days, and at this point, the WD for Energy would need to maintain a reading above 40% until next Thursday (3/19) before breaking that streak. On a somewhat basic level, though the exact reasons are different, both periods were (and have been) driven by tensions in the middle east causing supply chain concerns for the global energy market.
Given the historic level of extension within energy-related equities, as well as commodities, investors will look for the dust to settle and see prices behave within a more normal trading range before considering new or additional long exposure. Very long-term holders with considerable gains may look to hedge current exposure, while shorter-term holders are likely looking to lock in profits if that has not occurred yet.


It’s March and there is turmoil in the market once again. Domestic equities have fallen to third in the DALI asset class rankings and technology, which has been a stalwart of the recent bull market sits fifth in the DALI sector rankings. Commodities, which now rank second in the DALI asset class rankings, have been far from calm as silver (SI/) has routinely moved +/-5% on any given day and crude oil ([CL/) just experienced its largest price swing since 2020. For whatever reason, volatility often seems to crop up around this time of year. Last year, the S&P 500 ([SPX]) was down more than 5.5% in March before the precipitous drop it (and rapid recovery) experienced in early April following the imposition of tariffs. Six years ago, the S&P experienced a peak-to-trough decline of roughly 30% in March at the outset of the COVID-19 pandemic. This week also marks the 17th anniversary of the market bottom during the Global Financial Crisis – which depending on how you define “bottom” occurred on March 6th, when the S&P hit its intraday low or yesterday, March 9th, when the S&P recorded its closing low.
As investors, perhaps the single most important lesson we can take away from these events is the importance of having a plan in place and sticking to it. On the TODAY show on October 6, 2008, at which point the S&P 500 was already down more than 32% from its 2007 peak, Jim Cramer said “Whatever money you may need for the next five years, please take it out of the stock market right now, this week. I do not believe that you should risk those assets in the stock market right now.” Investors who followed Cramer’s advice avoided another 25% of the downside in equities, but how many became so fearful that they never reentered the market and missed one of the greatest bull markets in history? How many others panic-sold during the COVID crash only to miss out on a recovery that saw the S&P reach an all-time high less than six months later? Anyone who shifted their entire portfolio to cash or bonds and maintained that allocation long-term did so to their detriment.

With the benefit of hindsight, it’s easy to see the folly of such a decision. However, at that time, there was a very real feeling among many people that the sky was indeed falling. Depending on where you were in life during these periods, you may or may not have an appreciation for the pervasive fear that existed from Main Street to Wall Street. There were several events surrounding the financial crisis that had never occurred and/or were believed to be “impossible” e.g., the fall of Lehman Brothers and the nationwide collapse of home prices, which led to speculation that the global economy could collapse. Early in the pandemic, the US had its highest unemployment since the Great Depression.
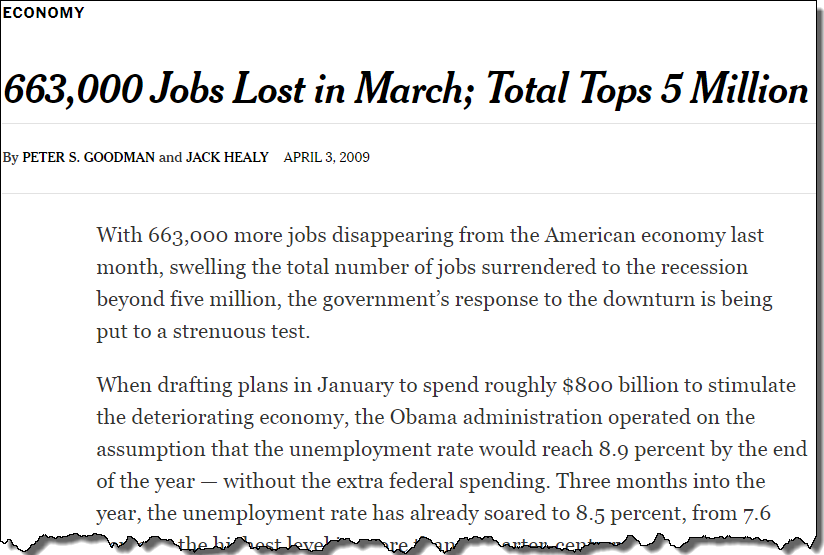
Even after the market had bottomed in 2009 and 2020 there was still no shortage of headlines that would have given all but the most steely, disciplined investors qualms about deploying capital into the market. An April 3, 2009 New York Times headline read, “663,000 Jobs Lost in March; Total Tops 5 Million.” Chrysler filed for bankruptcy on April 30th, followed by General Motors in early June. All of this to say, that even as the recovery of the US equity market was underway, there were still plenty of reasons to be skeptical that the worst was over.
Our aim here isn’t to advocate for a buy-and-hold approach. What we are saying is that during periods of uncertainty, emotion and instinct can be your worst enemy. Letting go of your instincts is no easy feat, after all, we rely on instinct and experience to guide us through virtually every part of our lives. This is why it’s critical to have a systematic approach that you understand and trust in place. If you don’t currently have a plan for how you’ll get defensive AND redeploy capital, the good news is that you have an opportunity to develop one now. While there is some turbulence in the market, with the S&P 500 only about 3% off its all-time high, US stocks are, by and large, still in pretty good shape. So, heed this lesson from Marches past – a little legwork now will save a lot of headaches later.
We’ll leave you with the excerpt below from a piece we published in 2018 in which our Senior Portfolio Manager, John Lewis, discusses the history of systematic relative strength and how he came to realize that removing emotion from the process was key to its success. John’s experience offers valuable lessons on the value of a rules-based system and how even a seasoned portfolio manager can end up doing more harm than good when they try to fit intuition into the process.
We have been managing our Systematic Relative Strength (SRS) strategies since 2005. We have seen a number of different types of markets come and go over the last 13 years. None of the major or minor events have caused us to make changes to our SRS process. I think that consistency in the process has allowed us to navigate markets that have been totally unpredictable and, to be perfectly honest, kept us sane. We field calls all the time asking about the nuts and bolts of the SRS process and we are always happy to discuss what we do. Those discussions generally focus on how the process works, and very rarely on what the logic was behind all of the design decisions. We are incredibly process-oriented and realize that outcomes are hard to control over short-term time horizons. So, we thought it would be valuable to share how the SRS process came to be, in order to give everyone a better idea about what the process truly is.
When I first started at Dorsey Wright our investment process was sort-of well-defined. I think “sort-of” describes most investment processes. There is some sort of rule set that morphs over time and there is a ton of discretion. Factors come and go, and there are fudge factors all over the place that allow you to do what is comfortable. One of the things we wanted to do was to pull the process apart and find out what worked and what didn’t. For example, if we required rising earnings estimates for something to be purchased, was that really helping, or was it just something we looked at that didn’t have any material impact on performance. We also wanted to know when these different factors work, when they don’t, and how long it will be before they start working again. It didn’t take too long to figure out what was really driving the returns: momentum. All of the other stuff was just kind of “there.” When we looked at all of the momentum research, it was clear that we weren’t generating the same type of returns as we were finding in the literature. It doesn’t take a genius to figure out why you aren’t getting those returns; the problem is looking at you in the mirror every morning. Believe it or not, coming to grips with the fact that you are the problem is actually the easy part.
We discussed at length how to implement a momentum model that was realistic and kept our emotions out of the equation so the model could work freely over time. The process became an obsession. People rarely spend time on the implementation because it just isn’t as exciting as coming up with the “next big thing.” There are a few things that work over time in financial markets. Momentum is one of them. Why doesn’t everyone do it? Because it is much harder than it looks!
The normal way models are run is to tweak and optimize them over time. All of our testing showed that made things worse. As soon as you had enough data to train the inputs for the “new market” the factor began working again. It took a ton of testing to realize the most optimal strategy over long periods of time was one that was never optimal over short periods of time. That testing also confirmed that when humans mess with good processes it rarely goes well. This happens in all types of cases and has been well-documented by psychologists. It also became clear that more information was not better. It’s momentum that makes the process go. We felt the more things we added into the process the more watered down it would be, and the more things there would be to break. The more testing we did the less complicated the process got. We had to resist the urge to solve every little problem and just try to solve the big one. There is so much inefficiency in the big problem that you don’t even need to solve the little ones! What we wound up with is a process that we believe is extremely complicated in its simplicity. It was actually harder to keep stripping things out of the model to make it better rather than adding variables. We believe that kind of process is more robust going forward.
We do get asked, from time to time, why everyone doesn’t do things the way we have chosen to do them. I think there are three reasons why this type of process is difficult to implement over long periods of time. First, it lacks sizzle. People love a good story. They want to believe you have information other people don’t and that will drive returns. The fact of the matter is that, on any small amount of trades, a human can probably do better than a systematic process, if that human has some sort of special insight. However, I don’t think it is possible to replicate over a full portfolio of trades over a long time horizon, like 10 years. It just isn’t possible to have that much legal information that others don’t. Second, it can be seen as career suicide. Once the model is up and running why do they need you anymore? Adding discretion to the process might hurt returns over the long-term, but it sure does make everyone think you are more important! There isn’t an easy solution to the problem. All I can say is we decided early on to do what we felt was best for clients and let the chips fall where they may. Finally, it is incredibly difficult to check your ego at the door every day. The more experience you have, the more you think you can just make a small override to the model and make things better. In all the time we have been watching this process work, we have noticed the more it looks like you should do something different than the model the more you need to follow the model! Like flying an airplane, your instruments and process become so much more important when things get dicey, and that’s what separates the winners from the losers.
The whole point of the SRS process is to systematically push the portfolio to strength. We are constantly pulling the weeds and watering the flowers. The whole thing is designed to change with markets, over time, and to try to minimize the risks major regime changes present to any model. We are wrong a lot. In fact, we are wrong more often than we are right, but the goal is not to stay wrong. If the holdings need to be changed the model identifies those changes. What we don’t change is the model. We just keep implementing the process in a disciplined fashion over time, and we believe that has been the biggest key to success.
Average Level
3.12
| < - -100 | -100 - -80 | -80 - -60 | -60 - -40 | -40 - -20 | -20 - 0 | 0 - 20 | 20 - 40 | 40 - 60 | 60 - 80 | 80 - 100 | 100 - > |
|---|---|---|---|---|---|---|---|---|---|---|---|
|
Buy signalefa
|
|||||||||||
|
Buy signalshy
|
|||||||||||
|
Sell signalXLG
|
|||||||||||
|
Buy signaliwm
|
Buy signalIJH
|
||||||||||
|
Sell signalONEQ
|
Buy signalEEM
|
Sell signallqd
|
|||||||||
|
Sell signalVOOG
|
Buy signalQQQ
|
Buy signalagg
|
Sell signaldx/y
|
||||||||
|
Buy signalfxe
|
Buy signalSPY
|
Buy signalVOOV
|
Buy signaldvy
|
Sell signaltlt
|
Buy signalgcc
|
Buy signalGSG
|
|||||
|
Buy signalhyg
|
Buy signaldia
|
Buy signalijr
|
Buy signalrsp
|
Buy signalief
|
Buy signalGLD
|
Buy signalicf
|
Buy signalUSO
|
||||
| < - -100 | -100 - -80 | -80 - -60 | -60 - -40 | -40 - -20 | -20 - 0 | 0 - 20 | 20 - 40 | 40 - 60 | 60 - 80 | 80 - 100 | 100 - > |
| AGG | iShares US Core Bond ETF |
| USO | United States Oil Fund |
| DIA | SPDR Dow Jones Industrial Average ETF |
| DVY | iShares Dow Jones Select Dividend Index ETF |
| DX/Y | NYCE U.S.Dollar Index Spot |
| EFA | iShares MSCI EAFE ETF |
| FXE | Invesco CurrencyShares Euro Trust |
| GLD | SPDR Gold Trust |
| GSG | iShares S&P GSCI Commodity-Indexed Trust |
| HYG | iShares iBoxx $ High Yield Corporate Bond ETF |
| ICF | iShares Cohen & Steers Realty ETF |
| IEF | iShares Barclays 7-10 Yr. Tres. Bond ETF |
| LQD | iShares iBoxx $ Investment Grade Corp. Bond ETF |
| IJH | iShares S&P 400 MidCap Index Fund |
| ONEQ | Fidelity Nasdaq Composite Index Track |
| QQQ | Invesco QQQ Trust |
| RSP | Invesco S&P 500 Equal Weight ETF |
| IWM | iShares Russell 2000 Index ETF |
| SHY | iShares Barclays 1-3 Year Tres. Bond ETF |
| IJR | iShares S&P 600 SmallCap Index Fund |
| SPY | SPDR S&P 500 Index ETF Trust |
| TLT | iShares Barclays 20+ Year Treasury Bond ETF |
| GCC | WisdomTree Continuous Commodity Index Fund |
| VOOG | Vanguard S&P 500 Growth ETF |
| VOOV | Vanguard S&P 500 Value ETF |
| EEM | iShares MSCI Emerging Markets ETF |
| XLG | Invesco S&P 500 Top 50 ETF |

| Symbol | Company | Sector | Current Price | Action Price | Target | Stop | Notes |
|---|---|---|---|---|---|---|---|
| ABBV | AbbVie Inc. | Drugs | $227.45 | 210s - low 230s | 284 | 188 | 5 for 5'er, favored DRUG sector, LT pos peer & mkt RS, breakout from consec sell signals, 2.9% yield |
| AB | AllianceBernstein Holding LP | Wall Street | $37.91 | low 40s | 64 | 32 | 3 TA rating, LT mkt RS buy, LT pos trend, top 50% of WALL sector matrix, consec buy signals, buy-on-pullback, yield > 8% |
| ZWS | Zurn Elkay Water Solutions Corp. | Machinery and Tools | $47.29 | hi 40s - lo 50s | 95 | 42 | 5 TA rating, LT pos trend, LT mkt RS buy, consec buy signals, buy-on-pullback |
| CACI | CACI International Inc. | Computers | $633.21 | 570s - 600s | 672 | 528 | 5 for 5'er, top 25% of COMP sector matrix, LT pos mkt RS, triple top breakout |
| WBS | Webster Financial Corporation | Banks | $68.61 | hi 60s - low 70s | 91 | 58 | 4 for 5'er, top 25% of BANK sector matrix, one box from peer RS buy, buy on pullback, 2.2% yield |
| MCK | McKesson Corporation | Drugs | $942.16 | 396-hi 470s | 1304 | 752 | 5 TA rating, top 33% of DRUG sector matrix, LT RS buy, consec buy signals, buy-on-pullback |
| CGON | CG Oncology, Inc. | Biomedics/Genetics | $61.29 | hi 50s - low 60s | 80 | 50 | 5 for 5'er, 18 of 162 in BIOM sector matrix, bullish catapult, good R-R, Earn. 3/26 |
| AZN | Astrazeneca Group PLC Ads (United Kingdom) ADR | Drugs | $194.95 | mid 180s - upper 190s | 236 | 160 | 4 for 5'er, top 25% of DRUG sector matrix, LT pos peer RS, one box from mkt RS buy, bullish triangle |
| RTX | RTX Corp. | Aerospace Airline | $208.23 | upper 190s to mid 210s | 254 | 166 | 4/5'er; top third of Aero matrix; Peer RS within 1 box of RS buy; ATHs on 3/2. |
| Symbol | Company | Sector | Current Price | Action Price | Target | Stop | Notes |
|---|---|---|---|---|---|---|---|
| CPRT | Copart Incorporated | Autos and Parts | $37.57 | hi 30s | 28 | 42 | 1 TA rating, bottom 50% of AUTO sector matrix, NT and mkt RS sell last month, consec sell signals |
| Comment | |||||||
|---|---|---|---|---|---|---|---|
|
|
|||||||
RTX RTX Corp. R ($207.10) - Aerospace Airline - RTX Corporation has been a 4 for 5’er since March 2025 and currently ranks within the top third of the Aerospace Airline sector matrix. The stock has maintained positive long-term market RS since March 2025 and sits within one box of a peer RS buy signal and potential increase to a 5 technical attribute rating. On the trend chart, RTX has traded in a positive trend for more than two years and maintained a buy signal since December of last year. Price action kicking off March brought about a fourth buy signal with the triple top break at $208 as shares rallied to a new all-time chart high at $212. With shares pulling back slightly from those highs this week RTX resides in actionable territory. Those seeking exposure can consider the stock in the upper $190 to mid-$210 range. The bullish price objective of $254 will serve as the price target, and the initial stop loss point will be set at $166, which would violate multiple levels of support dating back to December 2025. RTX is accompanied by a yield of 1.3%.
| 26 | |||||||||||||||||||||||||||||
| 212.00 | X | 212.00 | |||||||||||||||||||||||||||
| 208.00 | X | 208.00 | |||||||||||||||||||||||||||
| 204.00 | X | X | 3 | 204.00 | |||||||||||||||||||||||||
| 200.00 | X | X | O | X | O | X | 200.00 | ||||||||||||||||||||||
| 198.00 | X | O | X | O | X | O | X | Mid | 198.00 | ||||||||||||||||||||
| 196.00 | X | X | O | X | 2 | X | O | X | 196.00 | ||||||||||||||||||||
| 194.00 | X | O | X | O | O | O | 194.00 | ||||||||||||||||||||||
| 192.00 | X | O | X | 192.00 | |||||||||||||||||||||||||
| 190.00 | 1 | O | X | 190.00 | |||||||||||||||||||||||||
| 188.00 | X | O | X | 188.00 | |||||||||||||||||||||||||
| 186.00 | X | O | 186.00 | ||||||||||||||||||||||||||
| 184.00 | X | 184.00 | |||||||||||||||||||||||||||
| 182.00 | X | 182.00 | |||||||||||||||||||||||||||
| 180.00 | X | X | X | 180.00 | |||||||||||||||||||||||||
| 178.00 | X | O | X | O | X | 178.00 | |||||||||||||||||||||||
| 176.00 | X | O | X | O | X | 176.00 | |||||||||||||||||||||||
| 174.00 | X | B | O | X | 174.00 | ||||||||||||||||||||||||
| 172.00 | X | O | X | 172.00 | |||||||||||||||||||||||||
| 170.00 | A | X | O | X | Bot | 170.00 | |||||||||||||||||||||||
| 168.00 | X | O | X | C | 168.00 | ||||||||||||||||||||||||
| 166.00 | X | O | X | 166.00 | |||||||||||||||||||||||||
| 164.00 | X | O | X | 164.00 | |||||||||||||||||||||||||
| 162.00 | X | O | X | 162.00 | |||||||||||||||||||||||||
| 160.00 | 8 | X | O | X | 160.00 | ||||||||||||||||||||||||
| 158.00 | X | O | X | O | X | 158.00 | |||||||||||||||||||||||
| 156.00 | X | O | X | O | 156.00 | ||||||||||||||||||||||||
| 154.00 | X | 9 | X | 154.00 | |||||||||||||||||||||||||
| 152.00 | X | X | O | 152.00 | |||||||||||||||||||||||||
| 150.00 | X | O | X | 150.00 | |||||||||||||||||||||||||
| 148.00 | X | 7 | O | X | 148.00 | ||||||||||||||||||||||||
| 146.00 | X | O | X | O | X | 146.00 | |||||||||||||||||||||||
| 144.00 | X | O | X | O | 144.00 | ||||||||||||||||||||||||
| 142.00 | X | O | 142.00 | ||||||||||||||||||||||||||
| 140.00 | X | 140.00 | |||||||||||||||||||||||||||
| 138.00 | X | 6 | 138.00 | ||||||||||||||||||||||||||
| 136.00 | X | O | X | 136.00 | |||||||||||||||||||||||||
| 134.00 | O | X | O | X | 134.00 | ||||||||||||||||||||||||
| 132.00 | O | X | O | 132.00 | |||||||||||||||||||||||||
| 130.00 | 4 | X | X | 130.00 | |||||||||||||||||||||||||
| 128.00 | O | X | O | 5 | 128.00 | ||||||||||||||||||||||||
| 126.00 | O | X | O | X | • | 126.00 | |||||||||||||||||||||||
| 124.00 | O | X | O | X | • | 124.00 | |||||||||||||||||||||||
| 122.00 | O | X | O | X | • | 122.00 | |||||||||||||||||||||||
| 120.00 | O | X | O | X | • | 120.00 | |||||||||||||||||||||||
| 118.00 | O | X | O | X | • | 118.00 | |||||||||||||||||||||||
| 116.00 | O | X | O | X | • | 116.00 | |||||||||||||||||||||||
| 114.00 | O | O | • | 114.00 | |||||||||||||||||||||||||
| 26 |
| CAVA CAVA Group, Inc. ($81.54) - Restaurants - CAVA broke a double top at $82 for a third buy signal since February. The stock improved to a 4 for 5'er after seeing its peer RS chart give an RS buy signal in the latter part of February, and it is currently the top ranked stock within the Restaurants sector matrix. Okay to consider here on the breakout or on a pullback to the upper $70s. Initial support lies at $75, while additional can be found in the $66 to $67 range. |
| CCJ Cameco Corporation ($120.32) - Metals Non Ferrous - CCJ returned to a buy signal Tuesday after successfully testing its bullish support line. Tuesday's move adds to a modestly positive technical picture as CCJ is a 3 for 5'er that and ranks in the top half of the non-ferrous metals sector matrix. From here, support sits at $108. |
| FNV Franco-Nevada Corp. ($262.67) - Precious Metals - FNV returned to a buy signal when it broke a double top at $268. Tuesday's move adds to a moderately favorable outlook as FNV is a 3 for 5'er. From here, overhead resistance sits at $284, while support can be found at $248. |
| PAAS Pan American Silver Corp ($61.42) - Precious Metals - After giving two consecutive sell signals PAAS returned to a buy signal. Tuesday when it broke a double top at $64. Tuesday's move adds evidence to an already positive technical picture as PAAS is a 4 for 5'er and ranks in the top half of the precious metals sector matrix. From here, support sits at $57. |

| Name | Option Symbol | Action | Stop Loss |
|---|---|---|---|
| General Dynamics Corporation - $357.13 | O: 26E360.00D15 | Buy the May 360.00 calls at 15.70 | 336.00 |
| Name | Option | Action |
|---|---|---|
|
|
||
| Name | Option Symbol | Action | Stop Loss |
|---|---|---|---|
| PepsiCo, Inc. - $161.66 | O: 26S160.00D17 | Buy the July 160.00 puts at 9.10 | 172.00 |
| Name | Option | Action |
|---|---|---|
| General Mills, Inc. ( GIS) | Jun. 47.50 Puts | Raise the option stop loss to 3.60 (CP: 5.60) |
| CBRE Group, Inc. ( CBRE) | Apr. 145.00 Puts | Raise the option stop loss to 9.60 (CP: 11.60) |
| Name | Option Sym. | Call to Sell | Call Price | Investment for 500 Shares | Annual Called Rtn. | Annual Static Rtn. | Downside Protection |
|---|---|---|---|---|---|---|---|
| Fortinet Inc. $ 83.81 | O: 26E85.00D15 | May. 85.00 | 84.26 | $ 39,606.05 | 34.53% | 35.24% | 5.99% |
| Name | Action |
|---|---|
| Intel Corporation ( INTC) - 45.58 | Sell the May 49.00 Calls. |
| Freeport-McMoRan Inc. ( FCX) - 60.49 | Sell the June 65.00 Calls. |
| Micron Technology, Inc. ( MU) - 389.32 | Sell the June 420.00 Calls. |
| Moderna, Inc. ( MRNA) - 55.74 | Sell the April 55.00 Calls. |
| Cameco Corporation ( CCJ) - 116.14 | Sell the April 120.00 Calls. |
| Invesco PLC ( IVZ) - 23.88 | Sell the April 24.00 Calls. |
| Name | Covered Write |
|---|---|
| Iron Mountain Inc. ( IRM - 107.14 ) | July 110.00 covered write. |
Daily Equity & Market Analysis
Loading, Please Wait...
