Most Requested Symbols

With the international equities seeing their most downside in almost a year, is it a sign of worse things to come?
Over the years we have found sports and their ranking systems to be an effective method for explaining relative strength investing to clients and the NCAA tournament’s seeding system and single-elimination structure make it especially well-suited for this purpose.
Weekly Rundown Video – Mar 4, 2026
Weekly rundown with NDW analyst team covering all major asset classes.
Weekly rundown with NDW analyst team covering all major asset classes.
International equities have been one of the most consistent areas of strength recently. However, with disruption from the war in Iran, international equities have taken their largest hit since the Tariff Tantrum last year. Broader international equity representative ACWX has declined over 5%, marking its largest pullback in eleven months. Meanwhile, emerging markets have taken an even larger hit, with the iShares MSCI Emerging Markets ETF (EEM) within striking distance of entering a 10% correction. With the group seeing its most downside in a while, is it a sign of worse things to come?
Looking at the iShares MSCI ACWI ex US ETF (ACWX) on a more sensitive $0.50 chart, it moved to a sell signal but remains in a positive trend with support starting at $69. Previous resistance around $67.5 could also serve as a future bounce point. Additionally, ACWX continues to display a strong fund score of 5.53, highlighting the continued strength of the broader international equity group. As a result, its long-term outlook remains mostly positive. That said, emerging markets have seen the most downside within space, so have they materially weakened?

Looking at the trend chart for EEM, the stock is on a deep column of Os due to the recent pullback. However, it continues to trade well above its positive trend line and maintains its three consecutive buy signals while support lies closely at $53. Additionally, EEM holds an extremely strong fund score of 5.43. So even with recent action, emerging markets continue to hold steady as strong regions.

One important piece of context surrounding the decline of international equities was their posture prior to the selloff. International equities, and especially emerging markets, were overextended in the near-term given how quickly they shot up in recent months. Within our asset class group scores page, the All Global & Intl Diversified group previously had an overbought/oversold (OBOS) reading north of 100%, placing it in overextended territory. Meanwhile, the Emerging Markets Diversified group held an even more elevated OBOS reading of 200%—its highest level since 2010. Both groups have now reversed into normalized territory, and their previous levels and subsequent pullback serve as a cautionary tale to closely monitor groups while in overextended territory.

With international equities sitting atop DALI while different representatives continue to hold technical strength, the broader asset class appears fine for now. If anything, the recent pullback leaves the group in actionable territory for those that had yet to add sufficient exposure. Plus, international equities still outpace the S&P 500 (SPX) by a good margin on a YTD basis. That said, relative strength changes quickly, especially during periods of heightened geopolitical conflict, making it even more important than usual to monitor the latest relative strength developments.

It’s that time of year again – March Madness is just around the corner. Next Sunday (3/15), ("Selection Sunday"), the NCAA selection committee will formally announce the field of 64 (or 68, as the case is now) teams who will be playing in the 2025 NCAA Men’s College Basketball Tournament. The tournament officially gets underway two days later with the First Four and begins in earnest on the 19th with the round of 64 and operates in a single-elimination format, which means that 63 games will be played to determine the ultimate champion.
While personal college affiliations are of course important, for many people it is the office pools and bracket challenges that drive the interest in this event. In bracket scoring, there is no reward for our favorite team "hanging in there" against a major conference powerhouse, and style points are not awarded in the final tabulation. Participants simply need to pick which teams will win each of the 63 games, which is no easy task – estimates of the odds of picking a perfect bracket (i.e. correctly picking the winner of all 63 games) range from one in 128 billion to one in 9.2 quintillion. Fortunately, the NCAA brought March Madness into the casual fans' wheelhouse by seeding the teams, helping us all move one step closer to being "bracketologists."
The seeding process of teams began in 1979 as a way for the NCAA to make sure that the strongest teams didn't end up meeting each other too early in the tournament, which would be a threat to TV ratings and the overall fan experience. The seeding also provides the uninitiated a basis for picking winners because while there are few who have followed the seasons of all 64 teams from around the country, everyone intuitively understands that picking a number 16 seed (the lowest-ranked team(s)) to beat a number one seed is not a statistically good bet.
In fact, prior to 2018’s tournament, a number one seed had never lost to a number 16 seed. That year, the University of Virginia (UVA) Cavaliers earned the dubious distinction of becoming the first number one seed to do so when they were defeated in the first round by the University of Maryland, Baltimore County (UMBC) Retrievers 74 to 54. UMBC stood as the only 16 seed to make it out of the first round until 2023 when the Fairleigh Dickinson University (FDU) Knights defeated number one seed Purdue 63 to 58. Like UMBC, FDU didn’t defy the odds for long, however, falling to nine seed Florida Atlantic in the second round.
A team with a high ranking is, after all, the stronger team based on qualitative and quantitative evaluation. They often possess more talent and better coaching than the lower-ranked teams, especially when comparing teams with a large gap in seeding. While past performance has certainly not guaranteed future success for all the high-seeded teams, it is certainly a good starting point for the average fan's tournament bracket.
Last year’s tournament exemplified the strength of high seeds as number one through number four seeds had a perfect 16-0 record in the first round of the tournament. The Elite Eight contained four number one seeds, three number two seeds, and one number three seed and no number one seed lost a game until the Final Four.
We compiled data from CBS Sports and ESPN regarding the success of each of the 16 seeds advancing through the NCAA tournament, updated through the 2025 tournament (there were no results for 2020 as the tournament was canceled that year). The seeding process has largely worked out as the NCAA intended it to. Higher-ranked teams typically advance through the early rounds, leading to exciting clashes of talented teams late in the tournament. Top-seeded teams don't always survive the four-round gauntlet that precedes the Final Four, but, historically, these teams win about 80% of the games they play. Meanwhile, the 13 - 16 seeds combine to win only about 11% of the games they play.
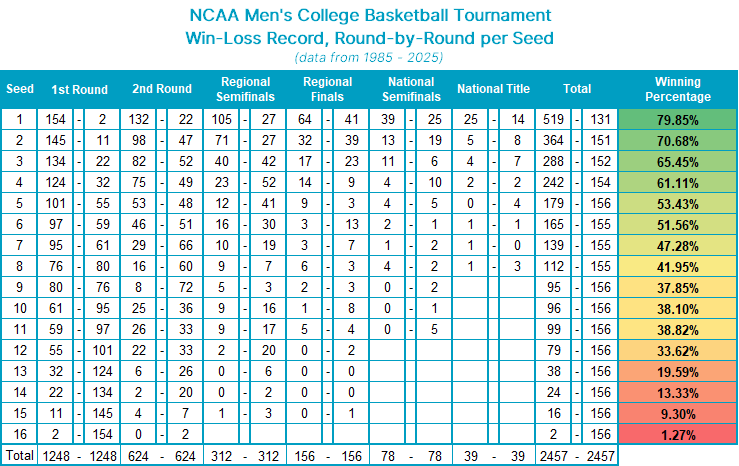
Additional NCAA Seeding Statistics (1985-2025)
Beware of those "Bracket Busters"
Despite the statistical trends, in many years we see a "Cinderella team" emerge somewhere along the way. Basically, a low-seeded team manages to defy the odds and beat a higher-seeded team. In 2022 15th-seeded St. Peters defeated basketball powerhouses Kentucky (2) and Purdue (3) en route to the Elite Eight, falling to the eventual national runner-up North Carolina (an 8-seed). In 2023, 15th seed Princeton defeated Arizona (2) and Missouri (7) before falling to Creighton (6) in the Sweet 16. And in 2024, 11th seed NC State made it to the Final Four before being knocked off by national runner-up Purdue (1). Over the life of the NCAA tournament, however, two and three seeds still win more than two-thirds of their games, while 11 seeds win only about one-third of theirs. Yet many fans spend as much time evaluating which 11, 12, or 13-seed will win their first game as they will analyzing which top seed is likely to win the whole tournament - which is far more important in terms of bracket scoring.
This tendency is similar to a study that we have referenced in this report many times over the years regarding the derivation of risk in a stock. The study, conducted by Benjamin King, looked at the risk in an individual stock and what caused the price of the stock to move. The study found that 80% of the risk is associated with the sector and overall market, while only 20% was company specific. The other part of the study found that the average investor spends 80% of their time evaluating company-specific information, and just 20% of their time evaluating market and sector risk.
Many NCAA "bracketologists" spend an awful lot of time slicing and dicing the differences between the point guards of 16 seeds, which have only ever won two games out of the 158 they’ve played. Yes, you may be the one to predict that third win by a 16 seed; however, you are also predicting the elimination of a one seed, which have historically won almost 99% of their first-round games, and about 80% of all their NCAA tournament games. Number one seeds have a history of making it much further into the tournament, which means incorrectly picking a 16 seed over a one seed, not only goes down as a loss for that game but probably two or three more games in your bracket. So, while the potential of being able to claim "victory" in correctly picking an upset by a 16 seed may be alluring, the fact is such picks have been correct less than 2% of the time in tournament history. Which side would you rather be on?
The Relative Strength Seeding Process
When we compare investments in a relative strength matrix, we are simply “seeding” teams, and like the NCAA experts, we are seeding them based on their success against their peers. The more relative strength buy signals generated by a team/security, the stronger the ranking or the “seeding” of that stock or ETF. Like the NCAA tournament, we know that history shows those top seeds perform better as a universe than the lower seeds. There are upsets, of course, but the trend favors the higher seeds and so that is where we focus our investment.
While the NCAA committee has its own proprietary ways of ranking teams, the input is based upon head-to-head games earlier in the season and overall recent performance. How a relative strength matrix ranks stocks, sectors, and even asset classes is not particularly dissimilar. Our relative strength rankings are a way to identify the strongest performance trends within a given universe, using head-to-head comparisons (RS charts) to build a database of information. The matrix process also affords us a lens through which to see negative performance trends begin to improve. We'd offer, however, that top-ranked assets in a matrix are your high seeds and thus offer the best probability of repeatable success. While low-ranked assets that are simply improving would be the equivalent of a 12-seed scoring an upset. We would not build a portfolio based on 12 seeds due to the instability of these trends, however, the RS rankings do offer a logical, organized means for approaching the "upset" selection process.
Average Level
20.63
| < - -100 | -100 - -80 | -80 - -60 | -60 - -40 | -40 - -20 | -20 - 0 | 0 - 20 | 20 - 40 | 40 - 60 | 60 - 80 | 80 - 100 | 100 - > |
|---|---|---|---|---|---|---|---|---|---|---|---|
|
Buy signalefa
|
|||||||||||
|
Buy signalagg
|
|||||||||||
|
Buy signalijr
|
|||||||||||
|
Buy signalief
|
|||||||||||
|
Buy signalshy
|
Buy signalIJH
|
Buy signalrsp
|
|||||||||
|
Buy signalXLG
|
Buy signaldia
|
Buy signalEEM
|
Buy signaltlt
|
Buy signalgcc
|
|||||||
|
Buy signalfxe
|
Sell signalVOOG
|
Buy signalQQQ
|
Buy signaliwm
|
Sell signaldx/y
|
Buy signalGLD
|
Buy signaluso
|
|||||
|
Buy signalhyg
|
Sell signalONEQ
|
Buy signalSPY
|
Sell signallqd
|
Buy signalVOOV
|
Buy signaldvy
|
Buy signalicf
|
Buy signalGSG
|
||||
| < - -100 | -100 - -80 | -80 - -60 | -60 - -40 | -40 - -20 | -20 - 0 | 0 - 20 | 20 - 40 | 40 - 60 | 60 - 80 | 80 - 100 | 100 - > |
| AGG | iShares US Core Bond ETF |
| USO | United States Oil Fund |
| DIA | SPDR Dow Jones Industrial Average ETF |
| DVY | iShares Dow Jones Select Dividend Index ETF |
| DX/Y | NYCE U.S.Dollar Index Spot |
| EFA | iShares MSCI EAFE ETF |
| FXE | Invesco CurrencyShares Euro Trust |
| GLD | SPDR Gold Trust |
| GSG | iShares S&P GSCI Commodity-Indexed Trust |
| HYG | iShares iBoxx $ High Yield Corporate Bond ETF |
| ICF | iShares Cohen & Steers Realty ETF |
| IEF | iShares Barclays 7-10 Yr. Tres. Bond ETF |
| LQD | iShares iBoxx $ Investment Grade Corp. Bond ETF |
| IJH | iShares S&P 400 MidCap Index Fund |
| ONEQ | Fidelity Nasdaq Composite Index Track |
| QQQ | Invesco QQQ Trust |
| RSP | Invesco S&P 500 Equal Weight ETF |
| IWM | iShares Russell 2000 Index ETF |
| SHY | iShares Barclays 1-3 Year Tres. Bond ETF |
| IJR | iShares S&P 600 SmallCap Index Fund |
| SPY | SPDR S&P 500 Index ETF Trust |
| TLT | iShares Barclays 20+ Year Treasury Bond ETF |
| GCC | WisdomTree Continuous Commodity Index Fund |
| VOOG | Vanguard S&P 500 Growth ETF |
| VOOV | Vanguard S&P 500 Value ETF |
| EEM | iShares MSCI Emerging Markets ETF |
| XLG | Invesco S&P 500 Top 50 ETF |

| Symbol | Company | Sector | Current Price | Action Price | Target | Stop | Notes |
|---|---|---|---|---|---|---|---|
| ABBV | AbbVie Inc. | Drugs | $236.19 | 210s - low 230s | 284 | 188 | 5 for 5'er, favored DRUG sector, LT pos peer & mkt RS, breakout from consec sell signals, 2.9% yield |
| AB | AllianceBernstein Holding LP | Wall Street | $38.68 | low 40s | 64 | 32 | 3 TA rating, LT mkt RS buy, LT pos trend, top 50% of WALL sector matrix, consec buy signals, buy-on-pullback, yield > 8% |
| PKG | Packaging Corp of America | Forest Prods/Paper | $232.55 | hi 200s - mid 230s | 358 | 184 | 4 TA rating, top 20% of FORE sector RS matrix, LT RS buy, buy-on-pullback |
| ZWS | Zurn Elkay Water Solutions Corp. | Machinery and Tools | $50.33 | hi 40s - lo 50s | 95 | 42 | 5 TA rating, LT pos trend, LT mkt RS buy, consec buy signals, buy-on-pullback |
| CACI | CACI International Inc. | Computers | $624.55 | 570s - 600s | 672 | 528 | 5 for 5'er, top 25% of COMP sector matrix, LT pos mkt RS, triple top breakout |
| CAKE | The Cheesecake Factory Incorporated | Restaurants | $64.04 | low-to-mid 60s | 96 | 52 | 5 for 5'er, top 20% of REST sector matrix, LT pos mkt RS, multiple buy signals, R-R>2.5, 1.8% yield |
| WBS | Webster Financial Corporation | Banks | $70.10 | hi 60s - low 70s | 91 | 58 | 4 for 5'er, top 25% of BANK sector matrix, one box from peer RS buy, buy on pullback, 2.2% yield |
| MCK | McKesson Corporation | Drugs | $978.71 | 396-hi 470s | 1304 | 752 | 5 TA rating, top 33% of DRUG sector matrix, LT RS buy, consec buy signals, buy-on-pullback |
| Symbol | Company | Sector | Current Price | Action Price | Target | Stop | Notes |
|---|---|---|---|---|---|---|---|
| CPRT | Copart Incorporated | Autos and Parts | $37.94 | hi 30s | 28 | 42 | 1 TA rating, bottom 50% of AUTO sector matrix, NT and mkt RS sell last month, consec sell signals |
| Comment | |||||||
|---|---|---|---|---|---|---|---|
|
|
|||||||
MCK McKesson Corporation ($929.78) R - Drugs - MCK has a 5 for 5 TA rating and sits in the top third of the Drugs sector RS matrix. The stock has been on an RS buy signal against the market since 2022 and been in a positive trend since last August. The market action this week saw MCK retract from all-time highs down toward the middle of its trading band, offering a potential buy-on-pullback opportunity. Long exposure can be considered from $396 to the upper $470s. Our initial stop will be positioned at $752, which would violate multiple support levels and move the stock to a negative trend. The bullish price objective of $1304 will serve as our price target, offering a reward-to-risk north of 2-to-1.
| 26 | |||||||||||||||||||||||||||||
| 992.00 | 3 | Top | 992.00 | ||||||||||||||||||||||||||
| 976.00 | X | 976.00 | |||||||||||||||||||||||||||
| 960.00 | X | X | 960.00 | ||||||||||||||||||||||||||
| 944.00 | X | O | X | 944.00 | |||||||||||||||||||||||||
| 928.00 | X | O | X | 928.00 | |||||||||||||||||||||||||
| 912.00 | X | O | X | 912.00 | |||||||||||||||||||||||||
| 896.00 | X | O | 896.00 | ||||||||||||||||||||||||||
| 880.00 | X | X | 880.00 | ||||||||||||||||||||||||||
| 864.00 | X | O | 2 | Mid | 864.00 | ||||||||||||||||||||||||
| 848.00 | B | X | O | 1 | 848.00 | ||||||||||||||||||||||||
| 832.00 | X | O | X | C | X | 832.00 | |||||||||||||||||||||||
| 816.00 | X | O | X | O | X | 816.00 | |||||||||||||||||||||||
| 800.00 | X | O | O | X | 800.00 | ||||||||||||||||||||||||
| 792.00 | X | O | 792.00 | ||||||||||||||||||||||||||
| 784.00 | X | 784.00 | |||||||||||||||||||||||||||
| 776.00 | A | X | 776.00 | ||||||||||||||||||||||||||
| 768.00 | X | X | O | X | 768.00 | ||||||||||||||||||||||||
| 760.00 | X | O | X | O | X | 760.00 | |||||||||||||||||||||||
| 752.00 | X | O | X | O | X | • | 752.00 | ||||||||||||||||||||||
| 744.00 | • | X | O | X | O | X | • | Bot | 744.00 | ||||||||||||||||||||
| 736.00 | X | X | • | X | O | X | O | • | 736.00 | ||||||||||||||||||||
| 728.00 | X | X | O | X | O | • | X | O | X | • | 728.00 | ||||||||||||||||||
| 720.00 | O | X | O | X | O | X | O | • | X | X | O | • | 720.00 | ||||||||||||||||
| 712.00 | O | X | O | X | 7 | O | 8 | • | X | O | X | • | 712.00 | ||||||||||||||||
| 704.00 | O | X | 6 | O | X | O | • | X | 9 | O | X | • | 704.00 | ||||||||||||||||
| 696.00 | O | X | O | X | O | X | O | X | O | X | • | 696.00 | |||||||||||||||||
| 688.00 | O | X | O | O | X | O | X | O | • | 688.00 | |||||||||||||||||||
| 680.00 | O | X | O | X | X | O | • | 680.00 | |||||||||||||||||||||
| 672.00 | O | O | X | O | X | • | 672.00 | ||||||||||||||||||||||
| 664.00 | O | X | O | X | • | 664.00 | |||||||||||||||||||||||
| 656.00 | O | O | X | • | 656.00 | ||||||||||||||||||||||||
| 648.00 | O | X | • | 648.00 | |||||||||||||||||||||||||
| 640.00 | • | O | • | 640.00 | |||||||||||||||||||||||||
| 26 |
| AEM Agnico-Eagle Mines Ltd. ($217.80) - Precious Metals - AEM gave an initial sell signal Thursday when it broke a double bottom at $224. The outlook for the stock remains favorable, however, as AEM is a 4 for 5'er that ranks in the top half of the precious metals sector matrix. From here, the next level of support sits at $190. |
| AGI Alamos Gold Inc ($48.88) - Precious Metals - AGI gave an initial sell signal Thursday when it broke a double bottom at $49. The outlook for the stock remains decidedly positive as AGI is a 5 for 5'er that ranks in the top half of the precious metals sector matrix. From here, the next level of support is AGI's trend line at $45. |
| ALGT Allegiant Travel Company ($83.73) - Aerospace Airline - ALGT broke a double bottom at $90 for a third sell signal as shares fell to $83. The move violates multiple levels of support, as well as the bullish support line, and brings the chart down to levels not seen since December last year. Along with the trendline violation, ALGT will reverse into a column of Os on its peer RS chart, dropping the stock down to a 1 for 5'er. From here, support now lies at $81, while additional can be found at $74. |
| ALK Alaska Air Group Inc ($43.79) - Aerospace Airline - ALK broke a spread triple bottom at $46 for a third sell signal as shares fell down to $44. The move violates the bullish support line, which along with the market and peer RS charts reversing into Os earlier in the week, will drop the stock down to a 0 for 5'er. From here, support on the chart now lies at $38, the November 2025 chart lows. |
| AVGO Broadcom Ltd ($328.68) - Semiconductors - AVGO pushed higher after the company's earnings release, breaking a double top at $324 before rising to $336 intraday. This also moved the stock back to a positive trend, promoting it to a 3 for 5 TA rating. The weight of the technical evidence is mixed but improving. Initial support can be seen at $308 with further support at $296. Further overhead resistance may be seen at $340 and $352. |
| CMC Commercial Metals Corporation ($68.31) - Steel/Iron - CMC gave a third consecutive sell signal and fell to a negative trend Thursday when it broke a double bottom at $69. The negative trend change will drop the stock to a still acceptable 3 for 5'er. However, from here, CMC shows no additional support on its chart until $58. |
| CRS Carpenter Technology Corporation ($393.82) - Steel/Iron - After giving five consecutive buy signals CRS fell to a sell signal Thursday when it broke a double bottom at $384. The outlook for the stock remains favorable as CRS is a 5 for 5'er that ranks in the top quartile of the steel/iron sector matrix. From here, the next level of support sits at $380. |
| CTAS Cintas Corporation ($205.69) - Textiles/Apparel - CTAS broke a double top at $204 for a third buy signal as shares rallied to $208. The stock has been a 3 for 5'er since October last year and the breakout brings the trend chart up to levels not seen since August last year. Okay to consider here on the breakout or on a pullback to the upper $190s. Initial support lies at $194, while additional can be found at $190, the bullish support line, and in the $180 range. |
| IE Ivanhoe Electric Inc. ($13.86) - Metals Non Ferrous - IE gave a fourth consecutive buy signal and fell to a negative trend Thursday when it broke a triple bottom at $14.50. The negative trend change will demote IE to an unfavorable 2 for 5'er. The stock now sits against support at $14, meanwhile, overhead resistance can be found at $16.50. |
| UAL United Airlines Holdings Inc. ($95.39) - Aerospace Airline - UAL reversed into Os and broke a double bottom at $97 to complete a bearish catapult as shares fell to $93. The break follows a trendline violation earlier in the week, which along with a market RS chart reversal to Os and peer RS sell signal, will drop the stock down to a 1 for 5'er. From here, support now lies at $89, the November 2025 chart lows. |
| VSCO Victoria's Secret & Company ($50.10) - Retailing - VSCO reversed into Os and broke a double bottom at $56 for a second sell signal as shares fell to $50. The move violates mulitple levels of support and brings the chart down to levels not seen since December last year. The breakdown will cause the market and peer RS charts to reverse into a column of Os, dropping the stock down to a 3 for 5'er. From here, support on the default chart lies at $44, the bullish support line. |

| Name | Option Symbol | Action | Stop Loss |
|---|---|---|---|
| Archer-Daniels-Midland Company - $66.35 | ADM2618F67.5 | Buy the June 67.50 calls at 4.20 | 62.00 |
| Name | Option | Action |
|---|---|---|
| Eli Lilly and Company ( LLY) | Apr. 1,080.00 Calls | Stopped at 976.00 (CP: 977.09) |
| Name | Option Symbol | Action | Stop Loss |
|---|---|---|---|
| Mondelez International, Inc. Class A - $58.36 | MDLZ2618R57.5 | Buy the June 57.50 puts at 3.20 | 63.00 |
| Name | Option | Action |
|---|---|---|
| ARM Holdings PLC ADR ( ARM) | Apr. 130.00 Puts | Raise the option stop loss to 12.45 (CP: 14.45) |
| Abbott Laboratories ( ABT) | Aug. 115.00 Puts | Initiate an option stop loss of 7.50 (CP: 9.50) |
| Name | Option Sym. | Call to Sell | Call Price | Investment for 500 Shares | Annual Called Rtn. | Annual Static Rtn. | Downside Protection |
|---|---|---|---|---|---|---|---|
| Exxon Mobil Corporation $ 149.82 | XOM2618F150 | Jun. 150.00 | 10.00 | $ 70,759.60 | 16.99% | 20.44% | 4.93% |
| Name | Action |
|---|---|
| Intel Corporation ( INTC) - 45.58 | Sell the May 49.00 Calls. |
| Freeport-McMoRan Inc. ( FCX) - 65.93 | Sell the June 65.00 Calls. |
| Micron Technology, Inc. ( MU) - 400.77 | Sell the June 420.00 Calls. |
| Moderna, Inc. ( MRNA) - 57.80 | Sell the April 55.00 Calls. |
| Cameco Corporation ( CCJ) - 120.24 | Sell the April 120.00 Calls. |
| Name | Covered Write |
|---|---|
| The Gap, Inc. ( GAP - 27.74 ) | March 29.00 covered write. |
| Kinross Gold Corporation ( KGC - 33.97 ) | April 36.00 covered write. |
| Bunge Limited ( BG - 115.01 ) | July 120.00 covered write. |
Daily Equity & Market Analysis
Loading, Please Wait...
