
The VIX is picking up, but realized volatility remains low. What happens when the market is pricing in a volatility spike? Today, we take a look.
Beginners Series Webinar: Join us on Friday, October 11th at 2 PM (ET) for our NDW Beginners Series Webinar. This week's topic is: Navigating the Models Page. Register Here
The CBOE SPX Volatility Index (VIX), often referred to as the “fear gauge,” has seen a notable uptick as we approach the US Presidential election and a critical period for FOMC decisions. However, realized volatility over the last month has been quite low. The VIX is intended to measure the annualized standard deviation of returns over the next thirty days. Realized volatility looks at the actual annualized standard deviation of returns across a period such as the last thirty days. As of close on 10/09/2024, the VIX is at 20.86 while the last thirty days of realized volatility sits at 10.10.
Historically, the VIX tends to overestimate volatility over a coming period, so it’s normal for the VIX to be higher than trailing volatility. That said, the current difference between trailing realized volatility and the VIX is in rare territory. For context, the present spread between the two would place in the 94th percentile since the VIX’s inception while the ratio of the VIX to realized volatility is in the 98th percentile. With the market pricing in significant increases in volatility, should we be concerned this is a sign of worse things to come?

To answer this question, we placed the spread between the VIX and realized volatility into deciles and then looked at the forward returns of the S&P 500 for each group since 1990, which is as far back as VIX data goes. Viewing the table above, the performance for the tenth and highest spread decile (which is where we are now) sticks out, especially at shorter time horizons. Across all the forward time horizons, the decile with the highest difference between the VIX and realized volatility also has the highest returns. Most notably, the one-week and one-month forward return is double that of the next closest group. In addition to strong returns, the top decile has also shown a higher hit rate. Compared to the general market average, the top decile had a 5% and 6% higher probability of generating positive one-month and three-month returns, respectively. For those looking to see when prior periods have occurred, you can see a graph of the S&P 500 with the times in the top decile shaded in purple.

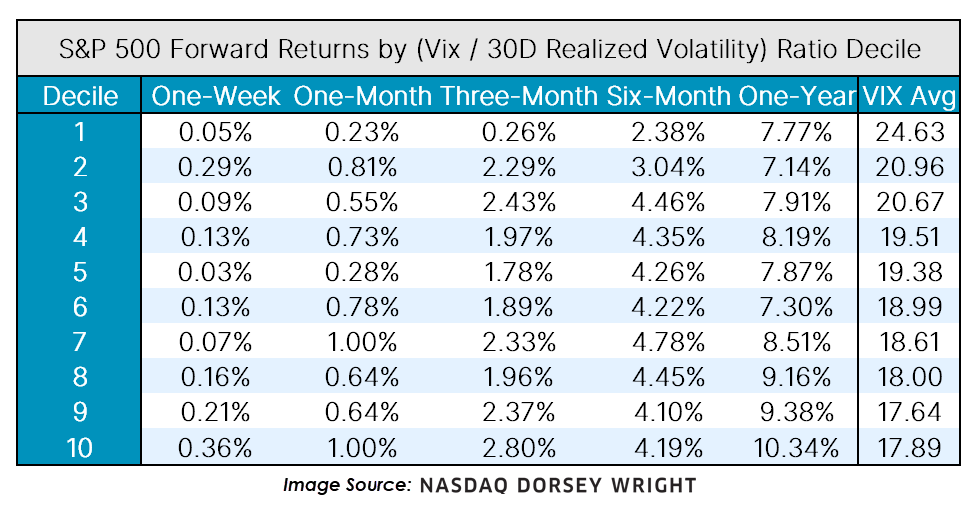
One thing to note is that the top decile has a higher overall VIX level, which can be positively correlated to returns at extreme levels (e.g., 2009, March 2020, etc.), which may influence the positive returns. However, the trend of greater performance with greater VIX to realized volatility holds up when looking at the ratio of VIX divided by realized volatility, which appears to not suffer from the same issue of higher overall levels, as seen in the table below.
Humans inherently dislike uncertainty, especially when it comes to money and the potential downside. When the VIX is significantly higher than recent realized volatility, it might be an indication that the market is overly fearful. Presently, the election appears to be a large source of volatility, and those looking for additional context around the subject should read today’s featured article on the matter.
