Most Requested Symbols

The presidential election can have major implications for the economy and the market as the winner will shape foreign and domestic policy for the next four years, so it’s not surprising that we might see an increase in volatility in the weeks leading up to the election. This year, there is perhaps more uncertainty than usual about the outcome of the election as many polls have shown that the race is a dead heat. With odds between the candidates roughly evenly split, should we expect to experience more volatility than unusual this year?
The curve has an average reading of 18.80%.
Today's featured stock is Madden Steven LTD (SHOO).
Comments include: ARCH, BA, DKS, SHAK, & WFRD.
Call: Exxon Mobil Corporation (XOM), Put: Bristol-Myers Squibb Company (BMY), Covered Write: Tesla Inc. (TSLA)
WEEKLY RUNDOWN - October 9, 2024
Weekly discussion covering all asset classes with the NDW analyst team.
Weekly discussion covering all asset classes with the NDW analyst team.
Beginners Series Webinar: Join us on Friday, October 11th at 2 PM (ET) for our NDW Beginners Series Webinar. This week's topic is: Navigating the Models Page. Register Here
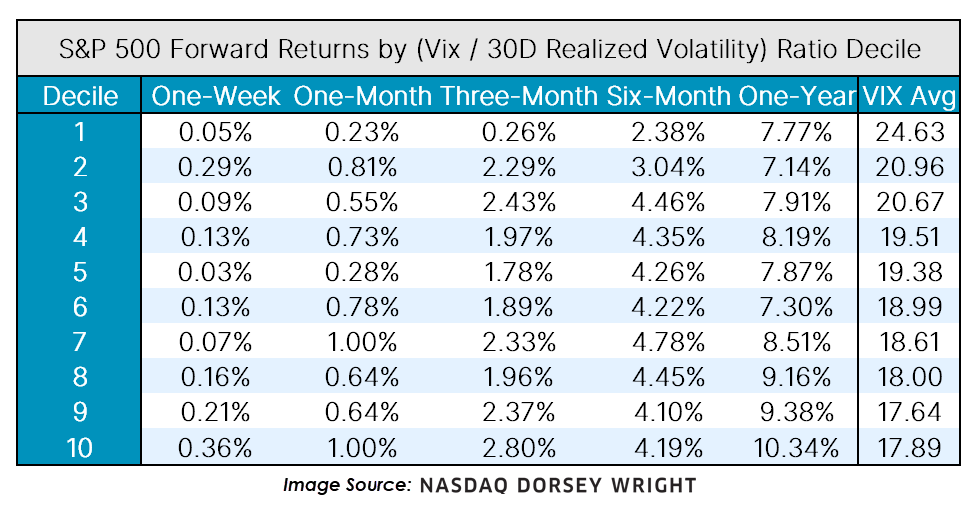
The CBOE SPX Volatility Index (VIX), often referred to as the “fear gauge,” has seen a notable uptick as we approach the US Presidential election and a critical period for FOMC decisions. However, realized volatility over the last month has been quite low. The VIX is intended to measure the annualized standard deviation of returns over the next thirty days. Realized volatility looks at the actual annualized standard deviation of returns across a period such as the last thirty days. As of close on 10/09/2024, the VIX is at 20.86 while the last thirty days of realized volatility sits at 10.10.
Historically, the VIX tends to overestimate volatility over a coming period, so it’s normal for the VIX to be higher than trailing volatility. That said, the current difference between trailing realized volatility and the VIX is in rare territory. For context, the present spread between the two would place in the 94th percentile since the VIX’s inception while the ratio of the VIX to realized volatility is in the 98th percentile. With the market pricing in significant increases in volatility, should we be concerned this is a sign of worse things to come?

To answer this question, we placed the spread between the VIX and realized volatility into deciles and then looked at the forward returns of the S&P 500 for each group since 1990, which is as far back as VIX data goes. Viewing the table above, the performance for the tenth and highest spread decile (which is where we are now) sticks out, especially at shorter time horizons. Across all the forward time horizons, the decile with the highest difference between the VIX and realized volatility also has the highest returns. Most notably, the one-week and one-month forward return is double that of the next closest group. In addition to strong returns, the top decile has also shown a higher hit rate. Compared to the general market average, the top decile had a 5% and 6% higher probability of generating positive one-month and three-month returns, respectively. For those looking to see when prior periods have occurred, you can see a graph of the S&P 500 with the times in the top decile shaded in purple.

One thing to note is that the top decile has a higher overall VIX level, which can be positively correlated to returns at extreme levels (e.g., 2009, March 2020, etc.), which may influence the positive returns. However, the trend of greater performance with greater VIX to realized volatility holds up when looking at the ratio of VIX divided by realized volatility, which appears to not suffer from the same issue of higher overall levels, as seen in the table below.
Humans inherently dislike uncertainty, especially when it comes to money and the potential downside. When the VIX is significantly higher than recent realized volatility, it might be an indication that the market is overly fearful. Presently, the election appears to be a large source of volatility, and those looking for additional context around the subject should read today’s featured article on the matter.

On Monday, 10/8, the S&P 500 Volatility Index (VIX) was up nearly 18% while the S&P 500 (SPX) was down a relatively modest 1%. One reason for outsized move in the VIX may be that the market is expecting a volatility to pick up between now and election day. The VIX is calculated using the implied volatility of S&P index options expiring in the 30 days, so Monday was the first day when options expiring post-election day were included. The presidential election can have major implications for the economy and the market as the winner will shape foreign and domestic policy for the next four years, so it’s not surprising that we might see an increase in volatility in the weeks leading up to the election. This year, there is perhaps more uncertainty than usual about the outcome of the election as many polls have shown that the race is a dead heat. With odds between the candidates roughly evenly split, should we expect to experience more volatility than unusual this year? Would there be less volatility leading up to election day if one candidate was leading by 10 points?
To get a better understanding of how the state of the race affects the state of the market we looked at the final polls for every election since 1952 (and polling averages for the two most recent elections) and the returns and volatility of the S&P 500 in the October before; we used two methods to gauge volatility – annualized standard deviation of the daily returns for the month and index’s range for the month – calculated as the high minus the low divided by the prior month’s close. The results of our study are shown in the table below.
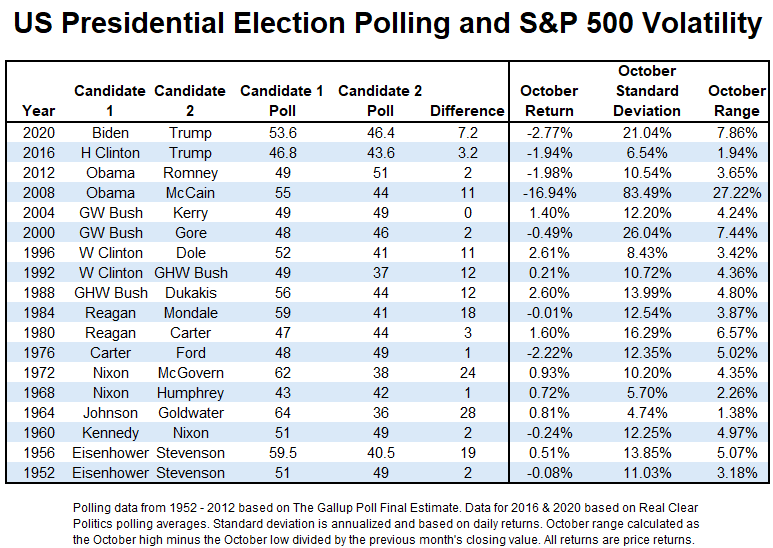
Our hypothesis going in was that we might see increased market volatility in October in years when polling showed a particularly tight race. However, the data doesn’t appear to bear that out. There are some years in which a close presidential race was accompanied by an unusually volatile October, as was the case in 2000. But we also know that this was during the dot com bubble. Four years later in 2004, an even tighter presidential race (at least based on the final polling) saw significantly less market volatility. Meanwhile, October 2020 was much more volatile than October 2016, even though the polling averages showed a less competitive race in 2020. Of course, this was also during the COVID-19 pandemic, suggesting that volatility or lack there of has less to do with the competitiveness of the race for the White House than the existing market environment. While we typically expect to see some volatility around election season, the data suggests that we shouldn’t expect an outsized increase this year just because of a close contest.
Average Level
18.80
| < - -100 | -100 - -80 | -80 - -60 | -60 - -40 | -40 - -20 | -20 - 0 | 0 - 20 | 20 - 40 | 40 - 60 | 60 - 80 | 80 - 100 | 100 - > |
|---|---|---|---|---|---|---|---|---|---|---|---|
|
Buy signalONEQ
|
|||||||||||
|
Buy signalQQQ
|
|||||||||||
|
Buy signalVOOV
|
|||||||||||
|
Buy signalXLG
|
|||||||||||
|
Buy signalVOOG
|
|||||||||||
|
Buy signalijr
|
Buy signalgld
|
||||||||||
|
Buy signaliwm
|
Buy signaldvy
|
Buy signalrsp
|
|||||||||
|
Sell signalief
|
Buy signalagg
|
Buy signaluso
|
Buy signalIJH
|
Buy signalgcc
|
|||||||
|
Sell signaltlt
|
Buy signalfxe
|
Buy signalhyg
|
Sell signaldx/y
|
Buy signalSPY
|
|||||||
|
Buy signalshy
|
Buy signallqd
|
Buy signalicf
|
Buy signalefa
|
Buy signalgsg
|
Buy signaldia
|
Buy signaleem
|
|||||
| < - -100 | -100 - -80 | -80 - -60 | -60 - -40 | -40 - -20 | -20 - 0 | 0 - 20 | 20 - 40 | 40 - 60 | 60 - 80 | 80 - 100 | 100 - > |
| AGG | iShares US Core Bond ETF |
| USO | United States Oil Fund |
| DIA | SPDR Dow Jones Industrial Average ETF |
| DVY | iShares Dow Jones Select Dividend Index ETF |
| DX/Y | NYCE U.S.Dollar Index Spot |
| EFA | iShares MSCI EAFE ETF |
| FXE | Invesco CurrencyShares Euro Trust |
| GLD | SPDR Gold Trust |
| GSG | iShares S&P GSCI Commodity-Indexed Trust |
| HYG | iShares iBoxx $ High Yield Corporate Bond ETF |
| ICF | iShares Cohen & Steers Realty ETF |
| IEF | iShares Barclays 7-10 Yr. Tres. Bond ETF |
| LQD | iShares iBoxx $ Investment Grade Corp. Bond ETF |
| IJH | iShares S&P 400 MidCap Index Fund |
| ONEQ | Fidelity Nasdaq Composite Index Track |
| QQQ | Invesco QQQ Trust |
| RSP | Invesco S&P 500 Equal Weight ETF |
| IWM | iShares Russell 2000 Index ETF |
| SHY | iShares Barclays 1-3 Year Tres. Bond ETF |
| IJR | iShares S&P 600 SmallCap Index Fund |
| SPY | SPDR S&P 500 Index ETF Trust |
| TLT | iShares Barclays 20+ Year Treasury Bond ETF |
| GCC | WisdomTree Continuous Commodity Index Fund |
| VOOG | Vanguard S&P 500 Growth ETF |
| VOOV | Vanguard S&P 500 Value ETF |
| EEM | iShares MSCI Emerging Markets ETF |
| XLG | Invesco S&P 500 Top 50 ETF |

| Symbol | Company | Sector | Current Price | Action Price | Target | Stop | Notes |
|---|---|---|---|---|---|---|---|
| GTES | Gates Industrial Corporation plc | Business Products | $17.43 | 16-18 | 23.50 | 15 | 5 TA rating, top 25% of BUSI sector matrix, LT RS buy, shakeout pattern buy point, R-R > 3, Earn. 11/1 |
| WPM | Wheaton Precious Metals Corp | Precious Metals | $59.49 | 52 - hi 50s | 85 | 43 | 5 TA rating, top 33% of PREC sector matrix, buy-on-pullback, R-R > 2.5, Earn. 11/7 |
| LAZ | Lazard Inc. | Wall Street | $49.50 | low-to-mid 40s | 76 | 36 | 4 for 5'er, top 20% of WALL sector matrix, one box from peer RS buy, spread quad top, R-R>3.0, 4.6% yield |
| ESNT | Essent Group Ltd | Insurance | $63.21 | mid-to-hi 50s | 66 | 50 | 4 for 5'er, top half of favored INSU sector matrix, bullish triangle, LT pos peer RS, 1.9% yield |
| PH | Parker-Hannifin Corporation | Machinery and Tools | $632.79 | 550s - 580s | 744 | 488 | 5 for 5'er, top 20% of MACH sector matrix, LT pos mkt RS, spread quintuple top, R-R>2.0, 1.15% yield, Earn. 10/31 |
| BR | Broadridge Financial Solutions Inc. | Wall Street | $219.71 | 200s - 210s | 268 | 174 | 5 for 5'er, top third of WALL sector matrix. LT pos mkt RS, spread triple top, 1.7% yield, Earn. 10/31 |
| VERX | Vertex, Inc. Class A | Software | $41.01 | mid-hi 30s | 50 | 27 | 5 TA rating, top 25% of SOFT sector matrix, consec. buy signals, LT pos trend & mkt RS buy, buy-on-pullback, Earn. 11/7 |
| HOLX | Hologic Incorporated | Healthcare | $80.12 | hi 70s - lo 80s | 111 | 64 | 4 TA rating, top half of HEAL sector matrix, LT RS buy, buy on pullback, Earn. 11/4 |
| CBT | Cabot Corp | Chemicals | $110.90 | hi 90s - mid 100s | 129 | 86 | 5 for 5'er, top 10% of CHEM sector matrix, LT pos mkt RS, spread quintuple top, Earn. 11/4 |
| TJX | The TJX Companies, Inc. | Retailing | $113.98 | lo 110s - lo 120s | 155 | 92 | 5 TA rating, top 33% of RETA sector matrix, LT pos. trend, pos. wkly mom., recent consolidation |
| CHD | Church & Dwight Company | Household Goods | $100.63 | hi-90 to mid-100 | 123 | 90 | 4 for 5'er, buy and pos. trend since Nov. '23; ATH June 2024; top half of HOUS matrix, Earn. 11/1 |
| TOL | Toll Brothers, Inc. | Building | $151.08 | lo 130s - hi 140s | 198 | 108 | 5 TA rating, top 10% of BUIL sector, LT RS buy, buy-on-pullback |
| ACVA | ACV Auctions, Inc. Class A | Autos and Parts | $18.73 | 19 - 21 | 24.50 | 16 | 5 for 5'er, top 20% of AUTO sector matrix, pos trend flip, spread quintuple top, Earn. 11/4 |
| EXPE | Expedia Group Inc. | Leisure | $152.79 | mid 130s - hi 140s | 204 | 110 | 4 TA rating, top 33% of LEIS sector matrix, consec. buy signals, LT RS buy, recent breakout, Earn. 11/7 |
| AJG | Arthur J. Gallagher & Co. | Insurance | $294.94 | 260s - 280s | 316 | 228 | 4 for 5'er, top half of favored INSU sector matrix, LT pos mkt RS, pullback from ATH, Earn. 10/24 |
| EHC | Encompass Health Corp. | Healthcare | $94.19 | 90s | 107 | 82 | 4 for 5'er, top third of HEAL sector matrix, quad top breakout, Earn. 10/24 |
| OKE | ONEOK, Inc. | Gas Utilities | $94.75 | 89 - 93 | 126 | 76 | 5 for 5'er, top 20% of GUTI sector matrix, LT pos mkt RS, pullback from ATH, 4.2%y yield, Earn. 10/29 |
| MA | Mastercard Incorporated Class A | Finance | $499.95 | 460s - 490s | 560 | 424 | 4 for 5'er, top half of favored FINA sector matrix, LT pos mkt RS, Earn. 10/24 |
| RSG | Republic Services, Inc. | Waste Management | $204.84 | mid 190s - lo 210s | 250 | 158 | 5 TA rating, top half of WAST sector matrix, LT RS buy, LT pos trend, consec. buy signals, pullback from ATH, Earn. 10/29 |
| ATGE | Adtalem Global Education Inc. | Business Products | $73.14 | low-to-mid 70s | 94 | 63 | 5 for 5'er, top quintile of BUSI sector matrix, spread quintuple top, Earn. 10/29 |
| BBY | Best Buy Co., Inc. | Retailing | $98.64 | hi 90s - low 100s | 149 | 78 | 4 for 5'er, top 20% of favored RETA sector matrix, bullish triangle, R-R>2.0, 3.7% yield |
| DRI | Darden Restaurants, Inc. | Restaurants | $158.56 | mid 150s - lo 170s | 198 | 130 | 4 TA rating, top half REST sector matrix, LT RS buy, buy-on-pullback, 3% yield. |
| ROL | Rollins, Inc. | Business Products | $49.83 | hi 40s - low 50s | 67 | 40 | 4 for 5'er, top half of BUSI sector matrix, LT pos trend, one box from mkt RS buy, Earn. 10/23 |
| DVA | DaVita, Inc. | Healthcare | $159.30 | 148-lo 160s | 206 | 124 | 5 TA rating, top 25% of HEAL sector matrix, LT pos trend, buy-on-pullback, Earn. 11/5 |
| SHOO | Madden Steven LTD | Textiles/Apparel | $46.97 | mid-hi 40s | 71 | 37 | 4 TA rating, top 50% of TEXT sector matrix, LT RS buy, recent pullback, Earn. 11/6 |
| Symbol | Company | Sector | Current Price | Action Price | Target | Stop | Notes |
|---|---|---|---|---|---|---|---|
| WDAY | Workday Inc. | Software | $240.77 | (240s - 230s) | 200 | 268 | 2 for 5'er, bottom half of SOFT sector matrix, LT negative mkt RS, |
| Symbol | Company | Sector | Current Price | Action Price | Target | Stop | Notes |
|---|---|---|---|---|---|---|---|
| GD | General Dynamics Corporation | Aerospace Airline | $298.69 | 290s - low 300s | 352 | 252 | Removed for upcoming earnings (10/23). |
| RDNT | Radnet, Inc. | Healthcare | $66.40 | 54 | Moved to a sell sign. Current exposure may maintain the $54 stop. |
| Comment | |||||||
|---|---|---|---|---|---|---|---|
|
|
|||||||
SHOO Madden Steven LTD ($47.04) R - Textiles/Apparel - SHOO has a 4 for 5 TA rating and sits in the top half of the textiles/apparel sector RS matrix. The stock has been on an RS buy signal against the market since 2021 and moved to a new multi-year high earlier this month before pulling back to the current chart position at $47. The stock maintains a strong long-term technical picture, allowing the near-term pullback to offer a more ideal entry point for potential long investors. Exposure may be considered in the mid-to-upper $40s. Our initial stop will be positioned at $37, which would violate multiple support levels and move the stock to a negative trend. The bullish price objective of $71 will serve as our price target, offering a reward-to-risk ratio north of 2-to-1. Note that earnings are expected on 11/6.
| 23 | 24 | ||||||||||||||||||||||||||||
| 50.00 | A | 50.00 | |||||||||||||||||||||||||||
| 49.00 | X | O | 49.00 | ||||||||||||||||||||||||||
| 48.00 | • | X | O | 48.00 | |||||||||||||||||||||||||
| 47.00 | X | • | X | O | 47.00 | ||||||||||||||||||||||||
| 46.00 | X | O | 9 | 46.00 | |||||||||||||||||||||||||
| 45.00 | X | 6 | 7 | X | O | X | Mid | 45.00 | |||||||||||||||||||||
| 44.00 | • | X | X | O | X | O | X | O | X | 8 | X | 44.00 | |||||||||||||||||
| 43.00 | • | X | O | X | X | O | X | O | X | O | X | O | X | 43.00 | |||||||||||||||
| 42.00 | • | X | O | X | O | X | O | X | O | O | O | X | 42.00 | ||||||||||||||||
| 41.00 | • | X | 1 | X | O | X | O | X | • | O | X | • | 41.00 | ||||||||||||||||
| 40.00 | X | • | X | O | 2 | 4 | X | • | O | • | 40.00 | ||||||||||||||||||
| 39.00 | 6 | O | • | C | O | X | • | • | 39.00 | ||||||||||||||||||||
| 38.00 | X | O | • | X | 5 | • | 38.00 | ||||||||||||||||||||||
| 37.00 | X | O | X | • | X | • | Bot | 37.00 | |||||||||||||||||||||
| 36.00 | X | O | 2 | O | • | X | X | • | 36.00 | ||||||||||||||||||||
| 35.00 | X | O | 7 | C | X | O | X | • | 8 | O | X | • | 35.00 | ||||||||||||||||
| 34.00 | X | O | X | O | X | O | X | O | X | O | 7 | O | B | • | 34.00 | ||||||||||||||
| 33.00 | O | X | O | X | O | X | 5 | 6 | O | X | 9 | X | • | 33.00 | |||||||||||||||
| 32.00 | O | O | X | O | X | O | X | O | X | O | X | • | 32.00 | ||||||||||||||||
| 31.00 | 8 | B | 1 | O | X | O | • | O | • | 31.00 | |||||||||||||||||||
| 30.00 | O | A | O | • | • | • | 30.00 | ||||||||||||||||||||||
| 29.00 | 9 | X | • | • | 29.00 | ||||||||||||||||||||||||
| 28.00 | O | X | • | 28.00 | |||||||||||||||||||||||||
| 27.00 | O | • | 27.00 | ||||||||||||||||||||||||||
| 23 | 24 |
| ARCH Arch Resources Inc ($144.16) - Oil - ARCH completed a fourth consecutive buy signal and returned to a positive trend on Thursday when it broke a double top at $144. The positive trend change will promote ARCH to a still unfavorable 1 for 5'er. From here, the next level of overhead resistance sits at $148. Meanwhile, support can be found at $136. |
| BA The Boeing Company ($146.62) - Aerospace Airline - Another week, another deconstructive comment on BA. The stock continues to move lower, falling to new 2024 lows in the process. It remains a technically weak name and should be avoided until serious technical improvement is seen. Bottom fishers beware, the stock has yet to put in a definitive bottom. Best to avoid catching a falling knife if possible rather than trying to play near term bounces. |
| DKS Dick's Sporting Goods, Inc. ($201.50) - Retailing - DKS broke a triple bottom at $200 to return to a sell signal. The 5 for 5'er has alternated signals since August and has been unable to rally back to highs from then during October's trading, as the stock has placed a lower top here with the breakdown. DKS remains a 5 for 5'er, but the stock is now within one box of reversing into Os on both the peer and market RS charts. Additionally, DKS has fallen into the bottom half of the Retailing sector matrix. From here, those who hold DKS should monitor support at $194, while multiple additional support can be found in the $180s. |
| SHAK Shake Shack Inc ($109.34) - Restaurants - SHAK broke a spread quadruple top at $112 as the stock clear resistance dating back to March of this year and rallied to its highest level since early 2021. The stock is a 5 for 5'er that ranks in the top half of the Restaurants sector matrix and it trades just above the middle of the 10-week trading band. Okay to consider here on the breakout or on a pullback to $106 on the chart. Initial support lies at $102, while additional can be found in the mid to low $90s. |
| WFRD Weatherford International Plc ($94.34) - Oil Service - WFRD returned to a buy signal on Thursday when it broke a double top at $93. The technical outlook for the stock remains decidedly negative, however, as WFRD is a 1 for 5'er that ranks 56th out of 64 names in the oil service sector matrix. From here, overhead resistance sits at $98, while support can now be found at $89. |

| Name | Option Symbol | Action | Stop Loss |
|---|---|---|---|
| Exxon Mobil Corporation - $123.48 | XOM2517A125 | Buy the January 125.00 calls at 5.50 | 116.00 |
| Name | Option | Action |
|---|---|---|
|
|
||
| Name | Option Symbol | Action | Stop Loss |
|---|---|---|---|
| Bristol-Myers Squibb Company - $52.37 | BMY2517M52.5 | Buy the January 52.50 puts at 2.88 | 57.00 |
| Name | Option | Action |
|---|---|---|
| ProLogis ( PLD) | Nov. 125.00 Puts | Raise the option stop loss to 6.00 (CP: 8.00) |
| Name | Option Sym. | Call to Sell | Call Price | Investment for 500 Shares | Annual Called Rtn. | Annual Static Rtn. | Downside Protection |
|---|---|---|---|---|---|---|---|
| Tesla Inc. $ 241.05 | TSLA2517A245 | Jan. 245.00 | 26.75 | $ 108,221.35 | 44.55% | 41.01% | 10.01% |
| Name | Action |
|---|---|
| The Gap, Inc. ( GAP) - 20.72 | Sell the December 23.00 Calls. |
| Victoria's Secret & Company ( VSCO) - 24.59 | Sell the December 24.00 Calls. |
| Shopify Inc ( SHOP) - 83.41 | Sell the December 80.00 Calls. |
| Robinhood Markets, Inc. Class A ( HOOD) - 25.65 | Sell the January 23.00 Calls. |
| Affirm Holdings, Inc. Class A ( AFRM) - 43.25 | Sell the January 42.50 Calls. |
| KeyCorp ( KEY) - 16.87 | Sell the January 17.00 Calls. |
| Capital One Financial Corporation ( COF) - 151.80 | Sell the December 150.00 Calls. |
| Palantir Technologies Inc. Class A ( PLTR) - 43.13 | Sell the January 40.00 Calls. |
| NVIDIA Corporation ( NVDA) - 132.65 | Sell the January 125.00 Calls. |
| Broadcom Ltd ( AVGO) - 185.95 | Sell the January 180.00 Calls. |
| Stanley Black & Decker, Inc. ( SWK) - 106.61 | Sell the January 110.00 Calls. |
| Semtech Corporation ( SMTC) - 41.14 | Sell the January 42.00 Calls. |
| Name | Covered Write |
|---|---|
|
|
|
Daily Equity & Market Analysis
Loading, Please Wait...
