Most Requested Symbols

April was a fantastic month for equity markets. The Invesco QQQ Trust ([QQQ]) had its best calendar month since October 2002 with a gain of 15.69%.
Today we continue our three part series breaking down three common arguments against trend following. Today's topic- the idea that momentum "chases winners", inefficiently buying high and selling low.
Weekly Rundown Video – May 6, 2026
Weekly rundown with NDW analyst team covering all major asset classes.
Weekly rundown with NDW analyst team covering all major asset classes.
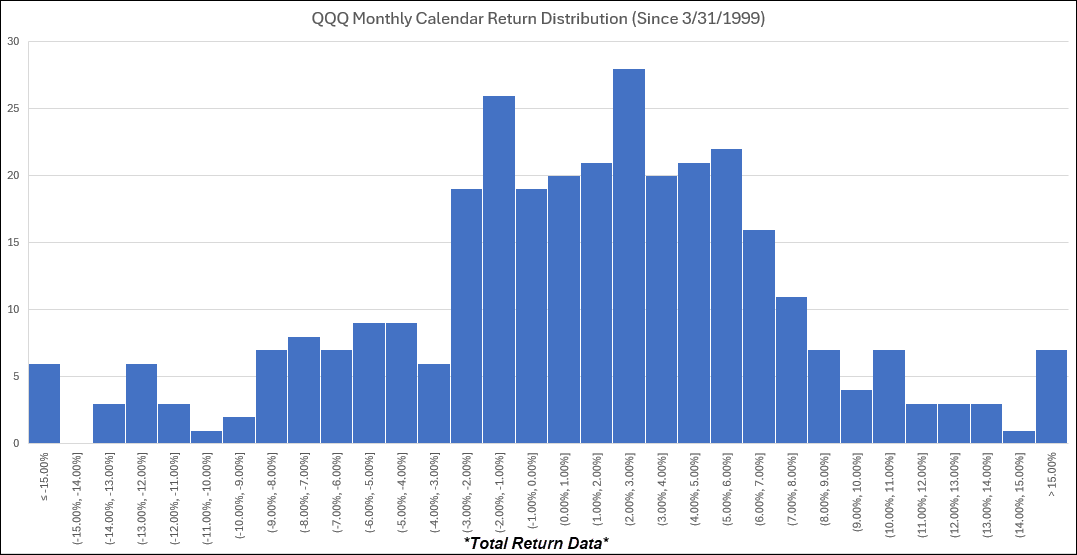
April was a fantastic month for equity markets. The Invesco QQQ Trust (QQQ) had its best calendar month since October 2002 with a gain of 15.69%. The rally comes following four negative months over the prior six months for QQQ. While it was an uneasy few months for the tech-heavy index, it gave the index time to build up enough energy for a major push higher. The combination of high volatility heading into April, multi-month consolidation, and earnings season was the perfect recipe for a rally if enough fear came out of the market. The feat is more spectacular given the mature nature of the Nasdaq-100 Index as compared to the other six times (1999-2002) it was able to gain +15% in a calendar month. The table below shows the frequency of monthly calendar returns with April breaking a tie between positive and negative 15% months. However, the return distribution is still negatively skewed as the average monthly return is less than the median monthly return for QQQ. On the bright side, the average and median returns are 1.07% and 1.45%, respectively, and nearly half of the calendar months since March 1999 have had a return of 2% or greater. In fact, the 2%-3% bucket is the most frequent monthly return for QQQ with a count of 28 months.
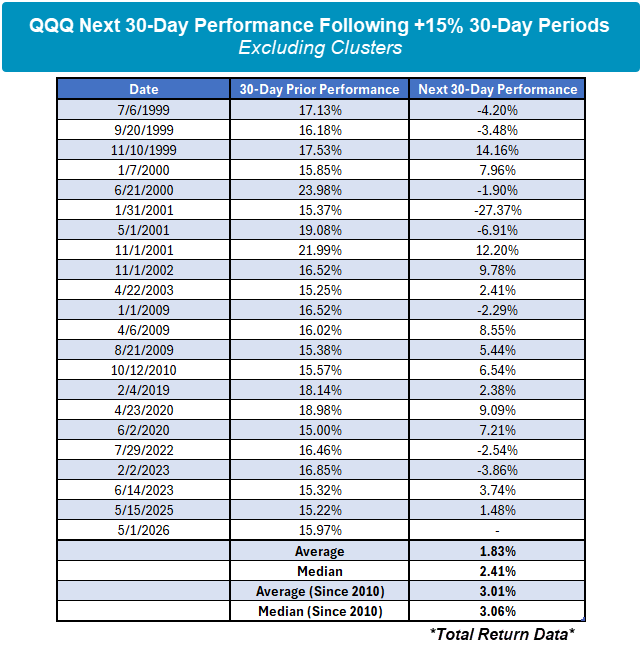
April’s historic return was clearly helped by timing as the market bottomed out on the last day of March. On a rolling 30-day basis, there have been many more +15% periods, even when excluding clusters. QQQ has been able to put together a handful of +15% 30-day periods just this decade whereas it happened only twice in the 2010s. For investors, there are natural concerns that arise following such a strong run in a short time. What goes up, must come down, right? Well, that’s not always the case. We see average and median returns over the next 30 days tend to also be strong at 1.83% and 2.41%, respectively. The next 30-day returns have been even better looking at data just since 2010 with average and median returns north of 3%. There are of course a few negative instances in the data set, but overall, these positive outlier periods tend to be a good sign over the next 30 days.

Note- this is the second edition of a larger study detailing how you can answer several frequently asked questions your clients might have when considering the broader momentum factor. Click here to read part 1, addressing the idea that momentum investing is “streaky” in comparison to other factors. Next Wednesday, we will address the final FAQ, the idea that momentum is tax inefficient. We will also include all three pieces together to make it easy to reference going forwards. With any questions/concerns, email miles.clark@nasdaq.com
Like any investment process, trend following is not without its share of ups and downs. Over time, buying winners and cutting losers can foster a strong point‑to‑point return stream, but the inter‑period experience of momentum investing can be difficult to stomach as natural rotation occurs and trends change. Time and time again, shifts in leadership create uncomfortable situations that often run counter to our natural “gut” instincts, causing even the most loyal trend follower to consider deviating from the rules. These untimely breakdowns in systematic rule‑following allow emotion to creep in at precisely the wrong moment, potentially erasing years’ worth of discipline- either psychologically, monetarily, or quite often, both.
With that in mind, we have taken the opportunity to break down several of the major roadblocks and common arguments that inevitably arise for trend followers. Our hope is that by better understanding the typical pitfalls of momentum investing, we can more appropriately contextualize returns over time.
Major arguments commonly raised against the momentum factor typically include:
Buying High, Selling Higher?
Momentum typically doesn’t adhere to the classic adage, “buy low, sell high”. Instead, the factor targets securities that have already established strong relative strength, essentially aiming to “buy high, sell higher” based on attractive performance metrics. This methodology sits at odds with other widely followed factors- a stock can reasonably become “too expensive” for a value investor or produce an “insufficient growth trajectory” for a growth investor. Since a stock can almost never “outprice” itself to the upside for a momentum strategy, a common critique is the factor’s perceived tendency to chase names that have already exhausted their upside, otherwise “buying high and selling low”.
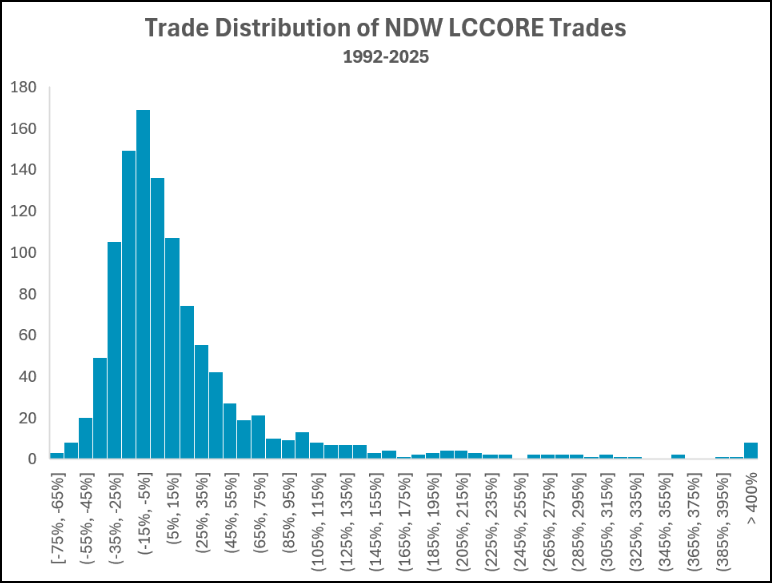
To evaluate how significant this concern may be, we examined the trade distribution of the NDW Large Cap Core model, which seeks to hold high relative strength securities within the top 500 stocks by market cap over time. Since the start of 1992, the model has continuously rotated to RS winners, trading (if needed) on a monthly basis. Before proceeding, it is worth noting an important statistical caveat: equity returns are inherently non‑normal. Upside returns are theoretically unbounded, while downside outcomes are limited to a maximum loss of 100%. Despite this asymmetry, a trade distribution remains useful for visualizing how frequently the model captures extreme positive outcomes.
Across the full dataset, eight trades produced returns in excess of 400% before exiting the model- effectively placing them more than three standard deviations above the average trade outcome. As of August 2025, these eight observations represent 0.73% of the 1,090 total trades executed since 1992. Under a normally distributed framework, only 0.135% of observations would be expected to fall beyond three standard deviations above the mean. Put differently, the model captures extreme right-tail outcomes at a substantially higher rate than what would be considered statistically “normal.”
While the histogram illustrates the frequency of these outcomes, it fails to depict their importance to a model’s return stream over time. The single largest observed trade generated a return just shy of 2,775%, a magnitude that is difficult to contextualize using a standard distribution alone. Across all trades, the average return is 22.29%. Removing only the eight aforementioned right‑tail winners reduces that average nearly in half, to 14.57%. While still attractive, this sharp decline indicates that a small number of exceptional winners account for a disproportionate share of total returns.
This dynamic becomes even clearer when examining median outcomes. Unlike the mean, the median dampens the influence of extreme outliers. On this basis, the median trade return falls to –1.17%, implying that more than half of all trades are actually modest losers. This suggests that the model’s return profile is positively skewed: a handful of very large winners are the featured drivers of long-term returns, while the majority of trades reflect routine turnover as the model systematically removes positions that fail to demonstrate sustained leadership.
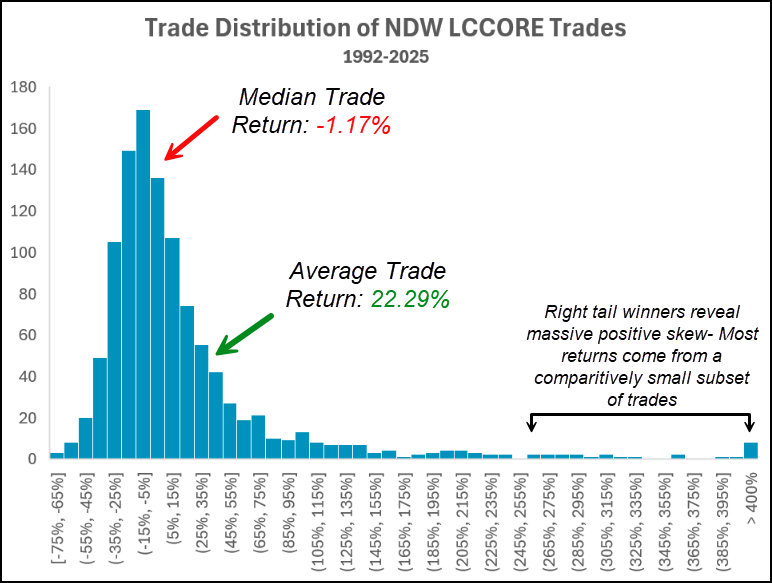
All this to say, this evidence suggests that constant rotation of “buying high” is not necessarily a liability for momentum strategies, but rather the defining feature that drives long‑term results. To realize a return on the order of ~2,800%, a security would almost certainly have violated the selection criteria of even the most flexible value or growth frameworks along the way. While trend following may involve periods of whipsaw as it searches for these comparatively exceptional winners, its systematic ability to remain invested in “golden ticket” securities longer than other approaches is ultimately the hallmark of the factor over time.
Each week the analysts at NDW review and comment on all major asset classes in the global markets. Shown below is the summary or snapshot of the primary technical indicators we follow for multiple areas. Should there be changes mid-week we will certainly bring these to your attention via the report.
| Universe | BP Col & Level (actual) | BP Rev Level | PT Col & Level (actual) | PT Rev Level | HiLo Col & Level (actual) | HiLo Rev Level | 10 Week Col & Level (actual) | 10 Week Rev Level | 30 Week Col & Level (actual) | 30 Week Rev Level |
|---|---|---|---|---|---|---|---|---|---|---|
| ALL |
|
40% |
|
42% |
|
80% |
|
56% |
|
44% |
| NYSE |
|
52% |
|
48% |
|
88% |
|
56% |
|
60% |
| OTC |
|
36% |
|
38% |
|
76% |
|
54% |
|
40% |
| World |
|
40% |
|
40% |
|
|
|
50% |
|
42% |

Remember, these are technical comments only. Just as you must be aware of fundamental data for the stocks we recommend based on technical criteria in the report, so too must you be aware of important data regarding delivery, market moving government releases, and other factors that may influence commodity pricing. We try to limit our technical comments to the most actively traded contracts in advance of delivery, but some contracts trade actively right up to delivery while others taper off well in advance. Be sure you check your dates before trading these contracts. For questions regarding this section or additional coverage of commodities email james.west@nasdaq.com.
Data represented in the table below is through 05/05/2026:
| Symbol | Name | Price | PnF Trend | RS Signal | RS Col. | 200 Day MA | Weekly Mom |
|---|---|---|---|---|---|---|---|
| CL/ | Crude Oil Continuous | 102.27 | Positive | Sell | X | 69.28 | - 5W |
| DBLCIX | Deutsche Bank Liquid Commodities Index | 468.52 | Positive | Sell | O | 460.74 | - 43W |
| DWACOMMOD | NDW Continuous Commodity Index | 1212.68 | Positive | Buy | X | 1062.73 | + 2W |
| GC/ | Gold Continuous | 4555.80 | Positive | Buy | O | 4267.47 | + 2W |
| HG/ | Copper Continuous | 5.94 | Positive | Sell | X | 5.32 | + 4W |
| ZG/ | Corn (Electronic Day Session) Continuous | 465.50 | Negative | Sell | O | 429.18 | + 1W |
Average Level
29.68
| < - -100 | -100 - -80 | -80 - -60 | -60 - -40 | -40 - -20 | -20 - 0 | 0 - 20 | 20 - 40 | 40 - 60 | 60 - 80 | 80 - 100 | 100 - > |
|---|---|---|---|---|---|---|---|---|---|---|---|
|
Buy signalUSO
|
|||||||||||
|
Buy signalIJH
|
|||||||||||
|
Buy signalshy
|
Buy signalicf
|
Buy signalijr
|
|||||||||
|
Sell signalief
|
Buy signaldvy
|
Buy signalVOOV
|
Buy signalSPY
|
Buy signalVOOG
|
|||||||
|
Sell signaltlt
|
Sell signalgld
|
Sell signaldx/y
|
Buy signalfxe
|
Buy signalrsp
|
Buy signalGSG
|
Buy signaliwm
|
Buy signalGCC
|
||||
|
Sell signalagg
|
Sell signallqd
|
Buy signalhyg
|
Buy signalefa
|
Sell signaldia
|
Buy signalEEM
|
Buy signalXLG
|
Buy signalONEQ
|
Buy signalQQQ
|
|||
| < - -100 | -100 - -80 | -80 - -60 | -60 - -40 | -40 - -20 | -20 - 0 | 0 - 20 | 20 - 40 | 40 - 60 | 60 - 80 | 80 - 100 | 100 - > |
| AGG | iShares US Core Bond ETF |
| USO | United States Oil Fund |
| DIA | SPDR Dow Jones Industrial Average ETF |
| DVY | iShares Dow Jones Select Dividend Index ETF |
| DX/Y | NYCE U.S.Dollar Index Spot |
| EFA | iShares MSCI EAFE ETF |
| FXE | Invesco CurrencyShares Euro Trust |
| GLD | SPDR Gold Trust |
| GSG | iShares S&P GSCI Commodity-Indexed Trust |
| HYG | iShares iBoxx $ High Yield Corporate Bond ETF |
| ICF | iShares Cohen & Steers Realty ETF |
| IEF | iShares Barclays 7-10 Yr. Tres. Bond ETF |
| LQD | iShares iBoxx $ Investment Grade Corp. Bond ETF |
| IJH | iShares S&P 400 MidCap Index Fund |
| ONEQ | Fidelity Nasdaq Composite Index Track |
| QQQ | Invesco QQQ Trust |
| RSP | Invesco S&P 500 Equal Weight ETF |
| IWM | iShares Russell 2000 Index ETF |
| SHY | iShares Barclays 1-3 Year Tres. Bond ETF |
| IJR | iShares S&P 600 SmallCap Index Fund |
| SPY | SPDR S&P 500 Index ETF Trust |
| TLT | iShares Barclays 20+ Year Treasury Bond ETF |
| GCC | WisdomTree Continuous Commodity Index Fund |
| VOOG | Vanguard S&P 500 Growth ETF |
| VOOV | Vanguard S&P 500 Value ETF |
| EEM | iShares MSCI Emerging Markets ETF |
| XLG | Invesco S&P 500 Top 50 ETF |

| Symbol | Company | Sector | Current Price | Action Price | Target | Stop | Notes |
|---|---|---|---|---|---|---|---|
| COST | Costco Wholesale Corporation | Retailing | $1016.42 | 944-1050s | 1296 | 832 | 4 TA rating, top 33% of retail sector matrix, LT mkt RS buy, LT pos trend, consec buy signals, Earn. 5/28 |
| DRI | Darden Restaurants, Inc. | Restaurants | $194.50 | 190s - low 200s | 226 | 168 | 4 for 5'er, LT pos peer & mkt RS, pos trend flip, triple top, 3% yield |
| TJX | The TJX Companies, Inc. | Retailing | $154.96 | 150s - 160s | 186 | 136 | 5 for 5'er. top third of RETA sector matrix, LR pos peer & mkt RS, triple top, Earn. 5/20 |
| BPOP | Popular, Inc. | Banks | $148.37 | hi 130s - low 150s | 200 | 120 | 5 for 5'er, 18 of 174 in favored BANK sector matrix, LT pos peer & mkt RS, triple top, good R-R, 2% yield |
| HAS | Hasbro, Inc. | Leisure | $94.75 | lo-hi 90s | 122 | 79 | 5 TA rating, top 33% of LEIS sector matrix, LT pos trend, pos wkly mom, Earn. 5/20 |
| GRMN | Garmin Ltd. | Leisure | $234.64 | mid 230s - mid 260s | 364 | 196 | 5 TA rating, LT pos trend and mkt RS buy, top 33% of LEIS sector matrix, buy-on-pullback |
| SBUX | Starbucks Corporation | Restaurants | $104.94 | hi 90s - mid 100s | 1296 | 85 | 4 for 5'er, top 20% of REST sector matrix, mkt RS reversal to Xs, triple top, 2.35% yield |
| OSW | OneSpaWorld Holdings Ltd. | Leisure | $24.04 | 22 - 24 | 30.50 | 19 | 5 for 5'er, top half of LEIS sector matrix, LT pos peer & mkt RS, spread quintuple top |
| FIVE | Five Below Inc | Retailing | $226.72 | hi 220s - hi 240s | 316 | 190 | 5/5'er since 6/25; top quintile of Retail matrix; R-R Ratio > 4; Earnings 6/3. |
| Symbol | Company | Sector | Current Price | Action Price | Target | Stop | Notes |
|---|---|---|---|---|---|---|---|
| CPRT | Copart Incorporated | Autos and Parts | $33.15 | hi 30s | 28 | 42 | 1 TA rating, bottom 50% of AUTO sector matrix, NT and mkt RS sell last month, consec sell signals,Earn. 5/21 |
| ADBE | Adobe Systems Incorporated | Software | $255.62 | 240s - 250s | 168 | 288 | 0 for 5'er, bottom third of SOFT sector, LT neg mkt & peer RS, sell on rally, R-R>2.0 |
| Symbol | Company | Sector | Current Price | Action Price | Target | Stop | Notes |
|---|---|---|---|---|---|---|---|
| DT | Dynatrace, Inc. | Software | $38.62 | mid-30s | 23 | 41 | Removed for earnings. Earn. 5/13 |
| IBKR | Interactive Brokers Group, Inc. | Wall Street | $83.88 | 70s | 100 | 63 | IBKR has moved into heavily overbought territory. OK to hold here. Raise stop to $74 |
| Comment | |||||||
|---|---|---|---|---|---|---|---|
|
|
|||||||
ADBE Adobe Systems Incorporated R ($250.19) - Software - ADBE is a 0 for 5'er that ranks in the bottom third of the software sector matrix and has been on market and peer RS sell signals since 2021 and 2024, respectively. After giving five consecutive sell signals between January and March, ADBE gave an initial buy signal but quickly reversed down and returned to a sell signal with a double bottom break at $244. ADBE has climbed back to the middle of its of its trading band and now sits against resistance at $256, offering an entry point for short exposure. Positions may be added in the $240s to $250s and we will set our initial stop at $288. We will use the bearish price objective, $168, as our target price. giving us a reward-to-risk ratio north of 2.0.
| 26 | |||||||||||||||||||||||||||||
| 364.00 | O | • | • | • | 364.00 | ||||||||||||||||||||||||
| 360.00 | O | X | • | • | X | • | X | • | • | 360.00 | |||||||||||||||||||
| 356.00 | O | X | O | X | • | X | O | • | X | O | X | • | 356.00 | ||||||||||||||||
| 352.00 | O | X | O | X | O | X | O | • | X | O | X | O | • | 352.00 | |||||||||||||||
| 348.00 | O | A | X | O | X | O | X | O | X | O | • | 348.00 | |||||||||||||||||
| 344.00 | O | O | X | O | X | O | 1 | • | 344.00 | ||||||||||||||||||||
| 340.00 | O | X | O | X | X | O | X | • | 340.00 | ||||||||||||||||||||
| 336.00 | O | X | O | X | O | X | O | X | O | • | 336.00 | ||||||||||||||||||
| 332.00 | O | X | B | X | O | X | O | X | O | • | 332.00 | ||||||||||||||||||
| 328.00 | O | • | O | X | O | C | O | • | O | • | 328.00 | ||||||||||||||||||
| 324.00 | • | O | O | X | • | O | • | 324.00 | |||||||||||||||||||||
| 320.00 | O | X | • | O | • | 320.00 | |||||||||||||||||||||||
| 316.00 | O | X | • | O | • | 316.00 | |||||||||||||||||||||||
| 312.00 | O | • | O | • | 312.00 | ||||||||||||||||||||||||
| 308.00 | • | O | • | 308.00 | |||||||||||||||||||||||||
| 304.00 | O | X | • | Top | 304.00 | ||||||||||||||||||||||||
| 300.00 | O | X | O | 300.00 | |||||||||||||||||||||||||
| 296.00 | O | X | O | 296.00 | |||||||||||||||||||||||||
| 292.00 | O | O | 292.00 | ||||||||||||||||||||||||||
| 288.00 | O | 288.00 | |||||||||||||||||||||||||||
| 284.00 | 2 | X | 284.00 | ||||||||||||||||||||||||||
| 280.00 | O | X | X | O | 280.00 | ||||||||||||||||||||||||
| 276.00 | O | X | O | X | O | 276.00 | |||||||||||||||||||||||
| 272.00 | O | X | O | X | O | 272.00 | |||||||||||||||||||||||
| 268.00 | O | O | X | X | O | 268.00 | |||||||||||||||||||||||
| 264.00 | O | X | O | 3 | O | 264.00 | |||||||||||||||||||||||
| 260.00 | O | X | O | X | O | 260.00 | |||||||||||||||||||||||
| 256.00 | O | X | O | X | O | X | X | 256.00 | |||||||||||||||||||||
| 252.00 | O | O | X | O | X | O | X | 252.00 | |||||||||||||||||||||
| 248.00 | O | O | X | O | 5 | Mid | 248.00 | ||||||||||||||||||||||
| 244.00 | O | X | O | X | 244.00 | ||||||||||||||||||||||||
| 240.00 | O | X | O | X | 240.00 | ||||||||||||||||||||||||
| 236.00 | O | X | O | 236.00 | |||||||||||||||||||||||||
| 232.00 | 4 | X | 232.00 | ||||||||||||||||||||||||||
| 228.00 | O | 228.00 | |||||||||||||||||||||||||||
| 26 |
| ARM ARM Holdings PLC ADR ($237.55) - Semiconductors - ARM moved higher Wednesday to complete a bullish triangle at $220 before rising to match its all-time high at $236. This 4 for 5'er moved to a positive trend in March and just moved back to an RS buy signal against the market at the end of April. The weight of the technical evidence is favorable and improving, however, ARM is now in a heavily overbought position. Initial support is seen at $200 with further support seen at $194. |
| AU AngloGold Ashanti Limited (South Africa) ADR ($98.39) - Precious Metals - AU was up more than 8% on Wednesday and returned to a buy signal when it broke a double top at $95 and continued higher to $99 where it now sits against its bearish resistance line. Wednesday's move adds to a modestly positive technical picture as AU is a 3 for 5'er that ranks in the top quintile of the precious metals sector matrix. |
| BIDU Baidu, Inc. (China) ADR ($140.59) - Internet - BIDU advanced Wednesday to break a double top at $132 before climbing over 11% intraday to return to a positive trend at $140. This promotes the stock to a 3 for 5 TA rating. The stock has maintained an RS buy signal against the market since last September, and is once again showing near-term improvement. The technical picture is mixed but improving. Initial support is seen at $120 with further support seen at $116. Note that there is the potential for further overhead resistance seen at $148. Earnings are expected on 5/18. |
| HWM Howmet Aerospace Inc. ($256.71) - Aerospace Airline - Nice break today for HWM, as the perfect 5/5'er was up as much as 6% for the day. Although its broad sector has weakened a touch off 2026 highs, the stock still ranks strongly within its respective aerospace and defense matrix, coming in at 15th out of 58. If there was one negative, it would be that the name is inbound on a range of resistance between current levels and all-time highs sitting at $264, but the weight of the evidence is still positive. To boot, HWM has some support offered just below current levels for those of you looking for a solid base to work on to attack those previously mentioned highs. |
| LYV Live Nation Entertainment Inc. ($169.00) - Leisure- LYV broke a double top at $160 to return to a buy signal as shares rallied to match resistance at $168. The stock has been a 4 for 5'er since moving back into a positive trend in April and currently ranks in the top half of the Leisure sector matrix. Beyond current resistance - which dates back to September of last year - the stock's all-time chart high resides at $174. Initial support lies at $152, the bullish support line, while additional can be found at $144. |
| RIO Rio Tinto PLC (United Kingdom) ADR ($105.75) - Metals Non Ferrous - RIO gave a second consecutive buy signal and reached a new multi-year high Wednesday when it broke a spread quintuple top at $102, taking out resistance that had been in place since February. Despite Wednesday's breakout, the outlook for RIO remains unfavorable as the stock is a 2 for 5'er. From here, the first level of support sits at $97. |
| UTHR United Therapeutics Corporation ($596.62) - Biomedics/Genetics - UTHR reversed back up and completed a bullish triangle at $600, marking its third consecutive buy signal and a new all-time. The 5 for 5'er sits in the top third of the biomedics/genetics sector matrix. Long exposure can be made here, given the weight of the evidence. Initial support is at $568, with additional support at $552. |
| Name | Option Symbol | Action | Stop Loss |
|---|---|---|---|
| American Express Company - $322.54 | O: 26I320.00D18 | Buy the September 320.00 calls at 27.15 | 288.00 |
| Name | Option | Action |
|---|---|---|
| DuPont de Nemours Inc. ( DD) | Jul. 45.00 Calls | Raise the option stop loss to 3.80 (CP: 5.80) |
| UBS AG (Switzerland) ADR ( UBS) | Aug. 40.00 Calls | Raise the option stop loss to 4.50 (CP: 6.50) |
| Altria Group Inc. ( MO) | Jul. 65.00 Calls | Stopped at 6.40 (CP: 5.95) |
| Johnson Controls International PLC ( JCI) | Jul. 140.00 Calls | Stopped at 10.30 (CP: 8.70) |
| McKesson Corporation ( MCK) | Aug. 830.00 Calls | Stopped at 752.00 (CP: 740.85) |
| Name | Option Symbol | Action | Stop Loss |
|---|---|---|---|
| Novo Nordisk A/S (Denmark) ADR - $46.09 | O: 26T45.00D21 | Buy the August 45.00 puts at 3.80 | 52.00 |
| Name | Option | Action |
|---|---|---|
| 3M Company ( MMM) | Sep. 145.00 Puts | Stopped at 8.95 (CP: 8.30) |
| Name | Option Sym. | Call to Sell | Call Price | Investment for 500 Shares | Annual Called Rtn. | Annual Static Rtn. | Downside Protection |
|---|---|---|---|---|---|---|---|
| Amkor Technology, Inc. $ 76.71 | O: 26G80.00D17 | Jul. 80.00 | 9.80 | $ 34,236.00 | 79.62% | 66.10% | 11.53% |
| Name | Action |
|---|---|
| Palantir Technologies Inc. Class A ( PLTR) - 135.91 | Sell the July 150.00 Calls. |
| V.F. Corporation ( VFC) - 18.32 | Sell the August 22.00 Calls. |
| Delta Air Lines Inc. ( DAL) - 70.86 | Sell the July 72.50 Calls. |
| Starbucks Corporation ( SBUX) - 104.94 | Sell the September 110.00 Calls. |
| Citigroup, Inc. ( C) - 128.01 | Sell the July 130.00 Calls. |
| Name | Covered Write |
|---|---|
| General Motors ( GM - 76.15 ) | September 77.50 covered write. |
| Invesco PLC ( IVZ - 26.83 ) | July 27.00 covered write. |
Daily Equity & Market Analysis
LISTEN TO PODCAST
Apr 30, 2026
Loading, Please Wait...
