Most Requested Symbols

Emerging markets have seen an impressive run over the past few months, but how long should we expect that run to last?
NDW Morning Update Video - June 23, 2026
Morning Highlights:
Below are highlights from the NDW Morning Update Video for the morning of 6/23. Access the the video on the NDW Morning Update Video page.

Emerging markets have exploded higher over the past several months. The iShares MSCI Emerging Markets ETF (EEM) gained over 30% from the end of 2025 through June 22. The fund notched a sixth consecutive buy signal Monday at another new all-time high. We have seen that impressive appreciation outpace the Nasdaq-100 Index by over 10%, triple the return of the S&P 500 Index, and nearly quadruple the return of the iShares MSCI EAFE ETF (EFA) (through 6/22).
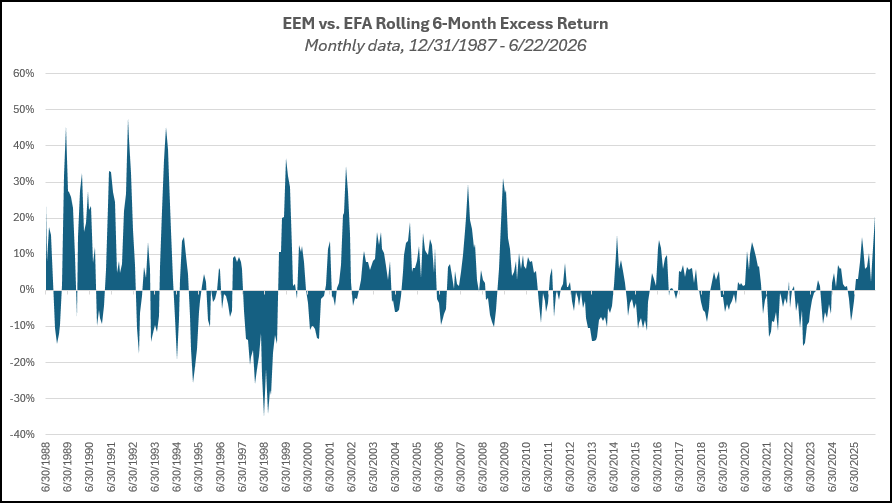
The difference in performance between emerging markets and developed markets has been stark. One way to measure this is by examining the rolling six-month return spread between EEM and EFA, which just breached the 20% mark for the first time in over 15 years. Looking at data back to 1987, there have been many other instances where we saw the spread get notably larger. If we continue to see outperformance through the end of June, we will have experienced 12 consecutive months of positive six-month excess returns in favor of EEM. There have been six other periods that saw longer environments favoring emerging markets, with the longest being a 22 month stretch that ended in December 2010. While the current run for emerging markets is the sharpest we have seen in more than 15 years, there is precedent for longer stretches of major divergence in the international equity space.
This strength has been one of the major reasons international equities remained at the top of the DALI rankings during the technology-led rebound in US equities. Looking underneath the hood at the emerging markets space reveals more similarities to US markets than we might expect. Over the past year, we have seen the electronic technology industry group, as classified by FactSet, go from just under 22% of the EEM portfolio to over 43% (through 6/22). Meanwhile, finance has dropped from 26% of the allocation to just over 20%. It should not come as a shock that this swap in exposure in the broad emerging markets benchmark has led to more growth than we have seen in years, like the concentration we have seen in US markets.

The technology allocation increase has been essentially focused on just three names; Taiwan Semiconductor Mfg Co (Taiwan) (TSM), Samsung Electronics (South Korea), and Hynix Semi (South Korea). TSM rose from about 10% of EEM to nearly 15% of the fund. Samsung went from about 2% to over 8%, and Hynix Semi went from 1.3% to nearly 8%. The allocation toward those three names expanded from roughly 13.6% to nearly 31% in the past year (through 6/22). This concentration leaves a major portion of capital invested in emerging markets concentrated in just a few names.

So, we have a major equity index that has seen rapid price appreciation due to sharp increases from a few names. Ring any bells? While the numbers behind these moves are unique, this feels like some of the movements we saw during the Magnificent 7 run over the past few years. Concentration does carry risk, but we have not seen that produce major drawdowns for US equities yet. In fact, we have seen most areas broaden out, with other names benefiting from AI-induced price appreciation while some Mag 7 names have been more stagnant.
With that said, we have certainly seen pullbacks, like we are experiencing on Tuesday (6/23). Most major AI-related names are down sharply intraday on Tuesday, including US and international representatives. The iShares MSCI Emerging Markets ETF is down over 5% at the time of this writing, which would mark the second time this month we saw an intraday drop of that magnitude (-6.5% on 6/5). Today’s drop marks the fourth 5% pullback so far in 2026. That is still lower than the annual average number of 5% pullbacks for EEM, which is just under five per year. Volatility is much more frequent in emerging markets, and we typically see many more 5% declines in the major EM benchmark than we are used to in US markets.
Volatility rarely feels good, especially when we see increased volatility in the strongest area of the strongest asset class across most of our rankings. However, increased volatility does not mean we are bound for weakness from emerging markets moving forward. We can overlay the annual price returns for EEM on the historical pullback counts to see if an increased frequency of pullbacks produces weaker years for EEM. In short, that does not seem to be the case. We do see more years of gains arise from years that show a lower-than-average pullback count, occurring in 14 out of the 39 years examined. However, we still see nine years with a higher-than-average pullback count that still resulted in positive years for EEM. This includes a four-year stretch from 2004 – 2007, and another two years from 2009 – 2010.

Tuesday’s drop led EEM to reverse down into a column of Os to $68, a simple three-box reversal from all-time highs. The fund still sits on multiple consecutive buy signals and is in a clearly defined positive trend. Based on the market action through Monday, EEM was nearing overbought territory at about 62% (north of 75% is typically the line for identifying extended names). The current pullback has led to an intraday OBOS reading of about 16%, at the time of this writing Tuesday, leaving the fund in a more actionable range if the decline stabilizes.
Average Level
1.89
| < - -100 | -100 - -80 | -80 - -60 | -60 - -40 | -40 - -20 | -20 - 0 | 0 - 20 | 20 - 40 | 40 - 60 | 60 - 80 | 80 - 100 | 100 - > |
|---|---|---|---|---|---|---|---|---|---|---|---|
|
Buy signaldvy
|
Buy signalIJH
|
||||||||||
|
Buy signalXLG
|
Buy signalicf
|
Buy signalVOOG
|
Buy signalijr
|
||||||||
|
Buy signalfxe
|
Sell signalagg
|
Buy signaltlt
|
Buy signalSPY
|
Buy signaldia
|
|||||||
|
Sell signalgsg
|
Sell signaluso
|
Sell signallqd
|
Buy signalefa
|
Buy signalVOOV
|
Buy signaliwm
|
Buy signalEEM
|
|||||
|
Buy signalGCC
|
Sell signalgld
|
Sell signalshy
|
Sell signalief
|
Buy signalhyg
|
Buy signalONEQ
|
Buy signalrsp
|
Buy signalQQQ
|
Buy signaldx/y
|
|||
| < - -100 | -100 - -80 | -80 - -60 | -60 - -40 | -40 - -20 | -20 - 0 | 0 - 20 | 20 - 40 | 40 - 60 | 60 - 80 | 80 - 100 | 100 - > |
| AGG | iShares US Core Bond ETF |
| USO | United States Oil Fund |
| DIA | SPDR Dow Jones Industrial Average ETF |
| DVY | iShares Dow Jones Select Dividend Index ETF |
| DX/Y | NYCE U.S.Dollar Index Spot |
| EFA | iShares MSCI EAFE ETF |
| FXE | Invesco CurrencyShares Euro Trust |
| GLD | SPDR Gold Trust |
| GSG | iShares S&P GSCI Commodity-Indexed Trust |
| HYG | iShares iBoxx $ High Yield Corporate Bond ETF |
| ICF | iShares Cohen & Steers Realty ETF |
| IEF | iShares Barclays 7-10 Yr. Tres. Bond ETF |
| LQD | iShares iBoxx $ Investment Grade Corp. Bond ETF |
| IJH | iShares S&P 400 MidCap Index Fund |
| ONEQ | Fidelity Nasdaq Composite Index Track |
| QQQ | Invesco QQQ Trust |
| RSP | Invesco S&P 500 Equal Weight ETF |
| IWM | iShares Russell 2000 Index ETF |
| SHY | iShares Barclays 1-3 Year Tres. Bond ETF |
| IJR | iShares S&P 600 SmallCap Index Fund |
| SPY | SPDR S&P 500 Index ETF Trust |
| TLT | iShares Barclays 20+ Year Treasury Bond ETF |
| GCC | WisdomTree Continuous Commodity Index Fund |
| VOOG | Vanguard S&P 500 Growth ETF |
| VOOV | Vanguard S&P 500 Value ETF |
| EEM | iShares MSCI Emerging Markets ETF |
| XLG | Invesco S&P 500 Top 50 ETF |

| Symbol | Company | Sector | Current Price | Action Price | Target | Stop | Notes |
|---|---|---|---|---|---|---|---|
| GRMN | Garmin Ltd. | Leisure | $236.34 | mid 230s - mid 260s | 364 | 196 | 5 TA rating, LT pos trend and mkt RS buy, top 33% of LEIS sector matrix, buy-on-pullback |
| IBOC | International Bancshares Corporation | Banks | $75.08 | low-to-mid 70s | 93 | 63 | 4 for 5'er, favored BANK sector, LT pos peer & mkt RS, bearish signal reversal, R-R~2.0, 1.95% yield |
| LYV | Live Nation Entertainment Inc. | Leisure | $170.56 | low 160s to mid 170s | 202 | 142 | 4 for 5'er; Pos. Trend; Top Half of Leisure Matrix; Within one box of ATH. |
| MO | Altria Group Inc. | Food Beverages/Soap | $69.51 | low-to-mid 70s | 91 | 62 | 4 for 5'er, top quartile of FOOD sector matrix, one box from RS buy, bullish triangle, 5.9% yield |
| CTRE | CareTrust REIT Inc | Real Estate | $37.49 | $38 - $43 | 62.50 | 34 | 5/5'er since Apr. '25, top quintile of Real Estate Matrix, pos. trend and buy signal since Jul. '23. |
| BTI | British American Tobacco Sp-Adr (United Kingdom) ADR | Food Beverages/Soap | $58.90 | hi 50s - low 60s | 92 | 51 | 4 for 5'er, top 25% of FOOD sector matrix, one box from mkt RS buy, buy on pullback, R-R~3.0, 5.3% yield |
| LAMR | Lamar Advertising Company | Media | $151.71 | mid 140 to mid 150 | 228 | 122 | 5 for 5'er, top third of Media Matrix, pos. trend, Reward-Risk > 11, current yield > 4%. |
| CM | Canadian Imperial Bank of Commerce | Banks | $114.00 | 100s | 165 | 90 | 5 for 5'er, top 10% of favored BANK sector matrix, LT pos peer RS, bearish signal reversal, R-R>3.0, 2.9% yield |
| JCI | Johnson Controls International PLC | Building | $148.21 | upper 130s to lower 150s | 182 | 124 | 4 for 5'er since Apr. '25, top 25% of Building sector matrix, pos. trend, ATH on 6/3. |
| EBAY | eBay Inc. | Retailing | $104.94 | mid 100s - low 110s | 161 | 93 | 5 for 5'er, top 10% of RETA sector matrix, buy on pullback, R-R~3.0 |
| F | Ford Motor Company | Autos and Parts | $14.11 | 14.50 - 16 | 27 | 12.50 | 5 for 5'er, top 20% of AUTO sector matrix, RS buy signal, spread triple top, R-R~5, 3.9% yield |
| HLT | Hilton Worldwide Holdings Inc | Leisure | $342.93 | low 320 - low 340 | 452 | 284 | 5 for 5'er since Nov. '23, top half of Leisure sector matrix, pos. trend since Nov. '23, buy since April. |
| CFG | Citizens Financial Group Inc | Banks | $67.99 | low to hi 60s | 87 | 54 | 5 for 5'er, top quintile of Banks matrix, LT pos. trend, Reward-Risk > 4, Earn. 7/16. |
| SPHR | Sphere Entertainment Co. | Leisure | $157.24 | 140s - 150s | 204 | 122 | 5 for 5'er, top 20% of LEIS sector matrix, spread quintuple top, good R-R |
| USFD | US Foods Holding Corp. | Food Beverages/Soap | $92.76 | 90s | 123 | 79 | 4 for 5'er, top half of FOOD sector matrix, LT pos peer & mkt RS, pos trend flip, R-R~2.0 |
| IRM | Iron Mountain Inc. | Business Products | $131.86 | mid 120s to mid 130s | 167 | 108 | 5 for 5'er, top quintile of Bus. Prod. matrix, Mkt RS buy since 6/24, pos. trend, Reward-Risk > 9. |
| BVN | Minas Buenaventura (Peru) ADR | Precious Metals | $32.41 | mid 30s | 492 | 296 | 4 for 5'er, top 20% of PREC sector matrix, LT pos peer & mkt RS, 3.3% yield |
| ESI | Element Solutions Inc. | Chemicals | $49.09 | low to mid 40s | 66 | 38 | 5 for 5'er, top decile of the Chemicals matrix, buy signal since 1/26, Reward-Risk > 3. |
| MFC | Manulife Financial Corporation | Insurance | $40.34 | 37 - 42 | 63 | 32 | 5 for 5'er since 1/26, top quintile of Insurance matrix, 3rd buy and ATH on 6/16. |
| Symbol | Company | Sector | Current Price | Action Price | Target | Stop | Notes |
|---|
| Symbol | Company | Sector | Current Price | Action Price | Target | Stop | Notes |
|---|---|---|---|---|---|---|---|
| AFRM | Affirm Holdings, Inc. Class A | Finance | $72.20 | low 70s | 108 | 59 | Sell signal at $71. Maintain $59 stop. |
| Comment | |||||||
|---|---|---|---|---|---|---|---|
|
|
|||||||
MFC Manulife Financial Corporation ($40.09) - Insurance - MFC has been at least a 3 for 5’er for more than 12 months and possessed a 5 TA rating since January this year. While the peer relative strength buy signal, suggesting long-term strength, flipped to favor MFC earlier this year, the stock has shown it positive long-term market relative strength for more than two years. On the default trend chart, MFC has maintained a positive trend since early 2023 and a buy signal since October 2025. Recent trading brought about a third buy signal and new all-time chart high at $41. Okay to consider here on the breakout or on a pullback to upper $30s. MFC’s current bullish price objective of $63 will serve as the price target, giving the stock a reward to risk ratio greater than 5. The initial stop loss point for MFC will be set for $32.
| 23 | 24 | 25 | 26 | ||||||||||||||||||||||||||
| 41.00 | X | 41.00 | |||||||||||||||||||||||||||
| 40.00 | 5 | 6 | 40.00 | ||||||||||||||||||||||||||
| 39.00 | X | O | X | 39.00 | |||||||||||||||||||||||||
| 38.00 | X | X | O | X | Mid | 38.00 | |||||||||||||||||||||||
| 37.00 | 1 | O | X | O | 37.00 | ||||||||||||||||||||||||
| 36.00 | C | O | 4 | 36.00 | |||||||||||||||||||||||||
| 35.00 | X | 3 | X | 35.00 | |||||||||||||||||||||||||
| 34.00 | B | O | X | Bot | 34.00 | ||||||||||||||||||||||||
| 33.00 | X | A | O | 33.00 | |||||||||||||||||||||||||
| 32.00 | X | O | X | 4 | X | 32.00 | |||||||||||||||||||||||
| 31.00 | B | O | X | O | X | O | 5 | 31.00 | |||||||||||||||||||||
| 30.00 | A | C | X | O | X | O | X | 30.00 | |||||||||||||||||||||
| 29.00 | X | 2 | 3 | O | X | 29.00 | |||||||||||||||||||||||
| 28.00 | 9 | O | X | 28.00 | |||||||||||||||||||||||||
| 27.00 | 7 | X | O | X | • | 27.00 | |||||||||||||||||||||||
| 26.00 | 5 | O | X | O | • | 26.00 | |||||||||||||||||||||||
| 25.00 | 3 | O | X | • | 25.00 | ||||||||||||||||||||||||
| 24.00 | X | 8 | • | 24.00 | |||||||||||||||||||||||||
| 23.00 | 2 | • | 23.00 | ||||||||||||||||||||||||||
| 22.00 | • | X | • | 22.00 | |||||||||||||||||||||||||
| 21.00 | O | • | X | • | 21.00 | ||||||||||||||||||||||||
| 20.00 | O | • | 2 | 5 | 7 | C | • | 20.00 | |||||||||||||||||||||
| 19.50 | 3 | • | X | O | X | O | X | O | X | X | • | 19.50 | |||||||||||||||||
| 19.00 | 5 | X | • | X | O | 4 | O | X | O | 9 | O | B | • | 19.00 | |||||||||||||||
| 18.50 | O | X | 8 | O | 1 | 3 | X | O | 8 | X | O | X | • | 18.50 | |||||||||||||||
| 18.00 | O | X | O | 7 | O | X | O | X | O | X | A | X | • | 18.00 | |||||||||||||||
| 17.50 | O | X | O | X | O | X | O | O | • | O | • | 17.50 | |||||||||||||||||
| 17.00 | O | 6 | X | 9 | B | • | • | • | 17.00 | ||||||||||||||||||||
| 16.50 | O | O | X | • | 16.50 | ||||||||||||||||||||||||
| 16.00 | O | X | • | 16.00 | |||||||||||||||||||||||||
| 15.50 | O | X | • | 15.50 | |||||||||||||||||||||||||
| 15.00 | A | • | 15.00 | ||||||||||||||||||||||||||
| 23 | 24 | 25 | 26 |
| AMZN Amazon.com Inc. ($234.56) - Retailing - AMZN broke a double bottom at $232 for a second sell signal since peaking in May. The stock continues to maintain a 4 technical attribute rating, but both the market and peer RS charts are within one box of reversing into Os, leaving two potential attributes at risk. From here, the stock maintains support at $220, the bullish support line, while additional can be found at $200 and $196. |
| BHP BHP Group Ltd. ($82.25) - Metals Non Ferrous - BHP fell to a sell signal Tuesday when it broke a double bottom at $82. The outlook for the stock remains modestly positive as BHP is a 3 for 5'er and ranks in the top half of the non-ferrous metals sector matrix. From here, the next level of support sits at $81. |
| EQIX Equinix, Inc. ($1,115.93) - Real Estate - EQIX moved higher Tuesday to break a double top at $1120, matching its all-time high from April. This 4 for 5'er moved to a positive trend in January and sits in the top quintile of the real estate sector RS matrix. The weight of the technical evidence continues to be favorable. Exposure may be considered at current levels or upon a breakout to $1136. Initial support is seen at $1040. |
| MSGE Madison Square Garden Entertainment Corp. ($76.06) - Leisure - MSGE broke a double top at $76 for a fourth buy signal and to mark a new all-time chart high. The stock has been a 5 for 5'er since November of 2025 and currently ranks within the top quartile of the Leisure sector matrix. Okay to consider here on the breakout. Initial support lies in the lower $70s, while additional can be found at $63. |
| ORCL Oracle Corporation ($165.25) - Software - ORCL reversed down to break a double bottom, marking a second consecutive sell signal. The 3 for 5’er moved down from a 4 over the past two weeks and now sits in hold territory. The stock is testing its positive trend line and shows mixed relative strength, moving into a column of O’s against the market last week, while its peer strength remains on a buy signal in a column of X’s. Initial support is at $164 with additional support at $162. |
| QCOM QUALCOMM Incorporated ($204.13) - Semiconductors - QCOM reversed down to break a double bottom, giving a sell signal. The 1 for 5'er fell from a 2 last week and remains in sell area. The stock remains in a positive trend but is showing continued relative weakness, with market RS in a column of O’s for two weeks and peer RS reversing into O’s last week. Initial support may be seen at $192. |
| TECK Teck Resources Limited ($59.62) - Oil Service - TECK was down more than 6% on Tuesday and fell to a sell signal when it broke a double bottom at $59, where it now sits against support. The outlook for the stock remains positive as TECK is a 4 for 5'er that ranks in the top decile of the oil service sector matrix. |
| TSLA Tesla Inc. ($381.57) - Autos and Parts - TSLA broke a double bottom at $384 for a fourth sell signal as shares fell to $380. The move violates the bullish support line, which will drop the stock down to 3 for 5'er trading in a negative trend. From here, support lies at $368, while the April 2026 chart lows reside at $340. |

The option suggestions featured here are pulled from the NDW Options Ideas tool. These are just a sample of the ideas that can be found there. The Options Idea tool contains numerous additional income and speculative plays. It also offers relative strength-based screens targeting the highest (and lowest) relative strength stocks and ETFs that have recently moved counter to their longer-term trend. To access or subscribe to the Options Ideas tool, click here.
Call
Charles Schwab Corp (SCHW) September 18 $92.50 Call

| Additional Data: | |
| Bid/Ask Spread | 6.60% |
| Delta | 57.18 |
| Gamma | 3.27 |
| Implied Volatility | 27.85% |
| Expiry Date | 87 |
| Earnings Date | 7/16/2026 |
Put
CBOE Global Markets Inc (CBOE) September 18 $260 Put

| Additional Data: | |
| Bid/Ask Spread | 4.28% |
| Delta | -48.75 |
| Gamma | 0.89 |
| Implied Volatility | 37.80% |
| Expiry Date | 87 |
| Earnings Date | 7/31/2026 |
Income (Short Put)
JP Morgan Chase & Co (JPM) July 24 $315 Short Put

| Additional Data: | |
| Ann. Static Return | 16.34% |
| Bid/Ask Spread | 11.84% |
| Delta | 22.74 |
| Gamma | -1.03 |
| Implied Volatility | 26.38% |
| Expiry Date | 31 |
| Earnings Date | 7/14/2026 |
Daily Equity & Market Analysis
Loading, Please Wait...
