With last week’s market action, the technology sector continues to stand out as one of the hardest-hit areas. Since the end of last month, technology has fallen from first to fourth in our DALI relative sector rankings, underscoring a meaningful deterioration in its technical picture.
Beginners Series Webinar: Join us on Monday, February 9th at 2 PM (ET) for our NDW Beginners Series Webinar. This week's topic is: Fund Score Composition and the Asset Class Group Scores Page Register Here
With last week’s market action, the technology sector continues to stand out as one of the hardest-hit areas. Since the end of last month, technology has fallen from first to fourth in our DALI relative sector rankings, underscoring a meaningful deterioration in its technical picture. The broader technology space is composed of four NDW sub-sectors—Software, Semiconductors, Computers, and Internet—and understanding the relative strength within these groups is essential. Identifying which areas of tech are weakening helps guide underweights, while recognizing which areas remain resilient supports more targeted overweight exposure as the sector undergoes rotation.
Over the past week, the iShares North American Software ETF (IGV), a proxy for the software space, declined more than 10%. The fund is now down over 20% year‑to‑date and carries a fund score of 1.18 with a sharp negative score direction of –4.44. IGV holds roughly 112 software names, and the weakness is broad-based rather than concentrated.
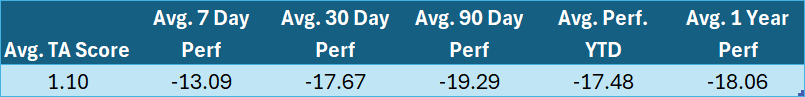
As shown in the chart, the average constituent has a Technical Attribute (TA) score of just 1.1, highlighting the weakness through the software space. Performance metrics at various intervals also show that the average stock is down 19.29% year‑to‑date and 13.09% in the last seven days alone. This degree of downside suggests that the downturn is sector-wide rather than driven by a handful of names.
IGV’s 30% pullback, beginning at the end of 2025, marks the 17th instance of a +20% decline. Historical pullbacks following similar drawdowns offer helpful context:
- Peak-to-trough declines of 20% or more have averaged a loss of ~35%.
- After the initial 20% pullback, IGV typically falls an additional 17.78% before bottoming.
- The average peak‑to‑trough duration is approximately 121 days.
- Once a 20% decline occurs, troughs are historically reached in around 40 days.
- On average, IGV experiences a 10% drawdown roughly once every 590 days.

Takeaway: Even with the pullback, history shows that software pullbacks rarely stop at the first leg down. The software space remains under pressure, and you should be prepared for continued volatility as IGV continues to move lower. As you remain invested in technology, you can continue to overweight other sub-technology sectors that are still showing strength.
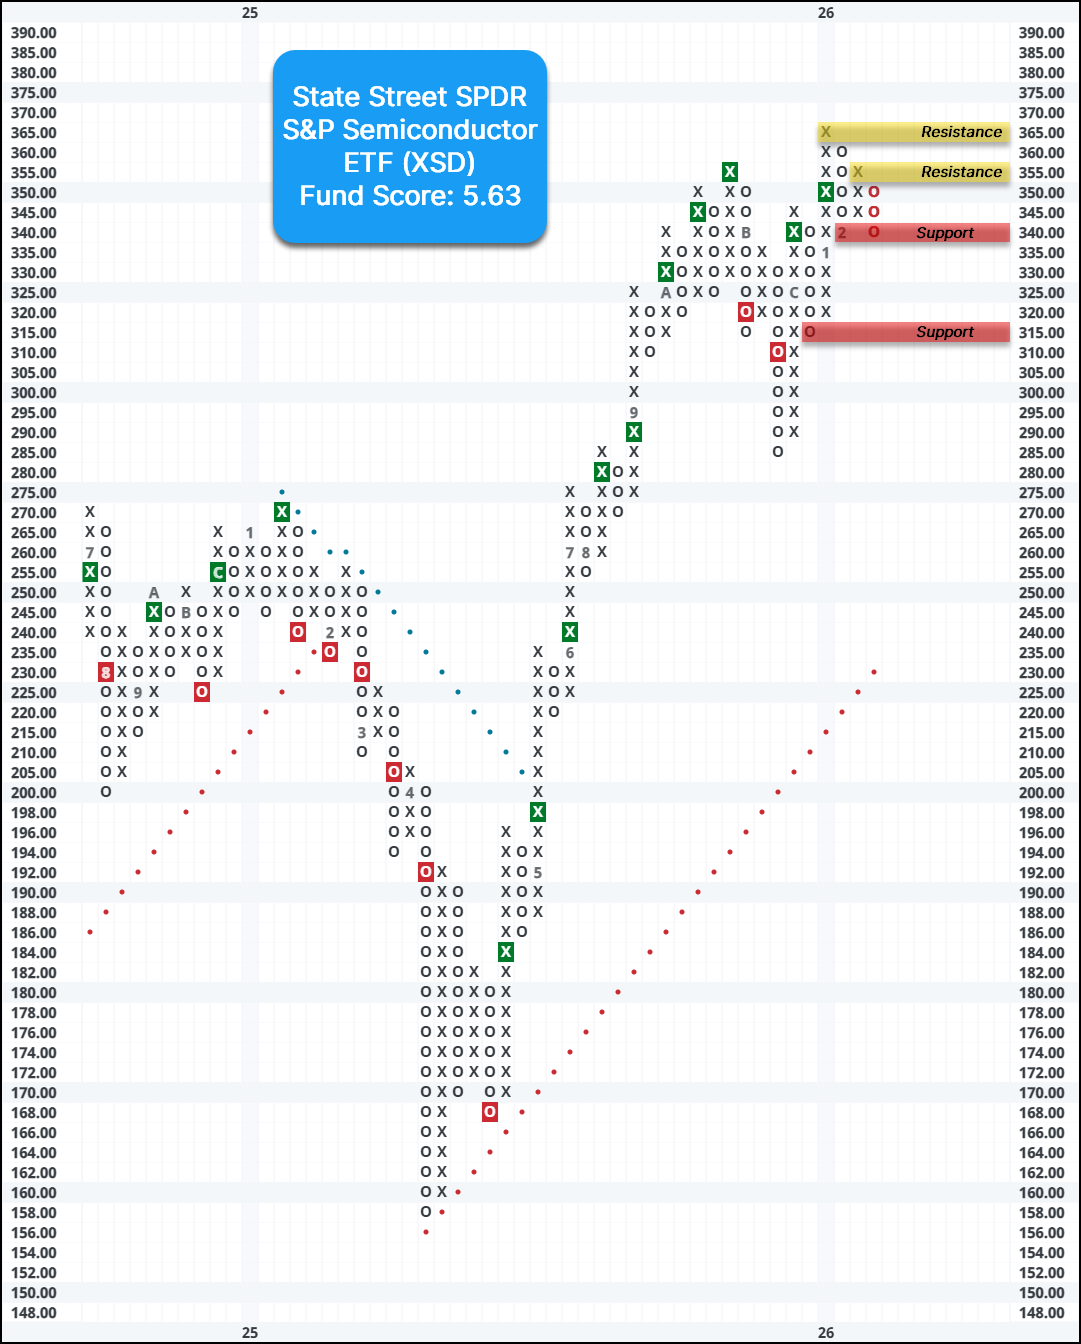
The State Street SPDR S&P Semiconductor ETF (XSD) provides exposure to names in the semiconductor space. Unlike several other semiconductor ETFs, XSD is less top heavy, with the top position only holding a weight of ~3.3%. XSD reversed back into Xs against the market in December of last year and holds a fund score of 5.63 with a score direction of 1.03. Year-to-date, the fund is up ~9%, building on its 29% gain in 2025. Additionally, XSD sits on two consecutive buy signals after completing a double top break at $350. Long exposure can be considered here, given the normalization of the 10-week trading band. Initial support can be seen at $340, with additional support at $315. Resistance can be seen at $355 and $365.