Most Requested Symbols

Monday's (3/2) trading marked a 99th percentile day for crude oil and drove changes in relative strength in favor of commodities.
Volatility picks up across markets, let's see where we stand.
Weekly Rundown Video – Feb 25, 2026
Weekly rundown with NDW analyst team covering all major asset classes.
Weekly rundown with NDW analyst team covering all major asset classes.
Geopolitical conflict in the Middle East over the weekend and into the start of the week sent energy prices sharply higher, with crude oil (CL/) gaining more than 6% during Monday’s (3/2) trading—its strongest single-day performance since June 2025. Monday’s move ranked in the 99th percentile of daily positive returns when examining crude oil prices back to early 1983.
On the default point‑and‑figure chart, crude oil generated a third consecutive buy signal with a double top at $68 as prices rallied to $75, clearing the July 2025 resistance level at $70 and pushing the chart to its highest level since June. Prices settled in the low $70s overnight before early Tuesday trading carried crude above $77, placing the chart within a potential resistance band in the upper‑$70s to $80 range. The chart is also in overbought territory—above the top of its 10‑week trading band— potentially prompting some short‑term holders of crude‑related exposure to consider locking in profits.

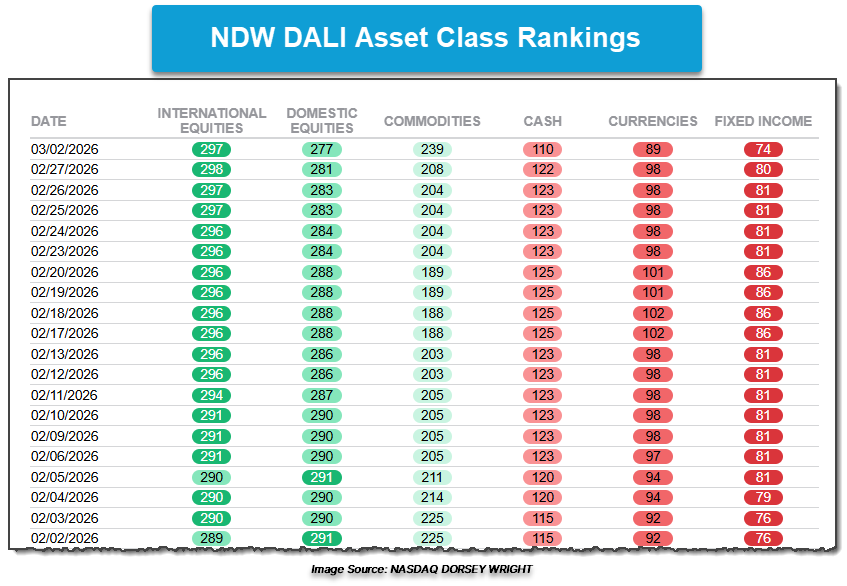
Those tracking the broader impact of the crude oil breakout may have noted the 31 signal jump within the NDW DALI Asset Class Rankings following Monday’s action. Commodities, while still holding the third position in the rankings, gained signals from all five other asset classes, most notably currencies, cash, and fixed income. International equities lost one tally signal, and domestic equities fell to their lowest signal count since early October 2025.
Examples of some of the signal movement appear on relative strength charts for the Invesco DB Oil Fund (DBO) and Invesco DB Energy Fund (DBE). Much of the recent increase in relative strength buy signals for crude‑focused exposure, like DBO, came at the expense of weaker assets such as currencies, cash, and fixed income. A notable shift occurred in oil (DBO) versus small caps represented by the iShares Russell 2000 ETF (IWM), where Monday’s trading produced an RS buy signal—the first since December 2023—establishing long‑term relative leadership for oil over small caps. With crude’s rally, the broader energy complex has also gained ground relative to large‑cap domestic equities with DBE versus SPY returning to an RS buy signal after Monday’s session.

Although Monday’s trading did not cause a change in the NDW DALI Asset Class Rankings, volatile days with significant asset divergence can lead to meaningful shifts in signal counts and potentially foreshadow ranking changes. To stay informed about any updates to the NDW DALI Asset Class Rankings, click the “Set Alerts” button in the upper‑right corner of the DALI page.

It has been a news heavy week, to say the least. The conflict in Iran remains ongoing with not much clarity into what’s next. While there is a clear push to have US forces there for as little as possible, it’s an extremely fluid situation. Whenever these types of events happen, it’s good practice to take a step back from the news and look through charts to get a better idea where we stand. US equity markets dove lower Sunday evening into Monday morning but were able to retrace the entire move during regular trading hours. The first half of the playbook was run again as equities fell into the open on Tuesday. At the time of this writing, it is yet to be seen if there will be another quick retracement during the day.
Nonetheless, let’s look at the trend chart for the S&P 500 Index (SPX) to see where we stand and areas of interest. The SPX did break a quadruple bottom during Tuesday’s action to mark its first sell signal since November and dropped to its lowest level this year. However, the large cap benchmark has been very choppy over the last few months, so the sell signal is not a major concern unless the bottom of the chop area is taken out around 6550. The SPX is trading well above its bullish support line, so there is not a trend break to keep a close eye on for now. The overall technical picture is still strong, but a break to 6500 or below could spell plenty of trouble with untested support levels sparsely laid out below. After a quick run up in the second half of last year and consolidation this year, this is the primary concern for bulls from a price action standpoint. However, until the bottom of the range at 6550 (or the top at 7000) is taken out, we could still see more chop moving forward before the market chooses the direction for its next big move.

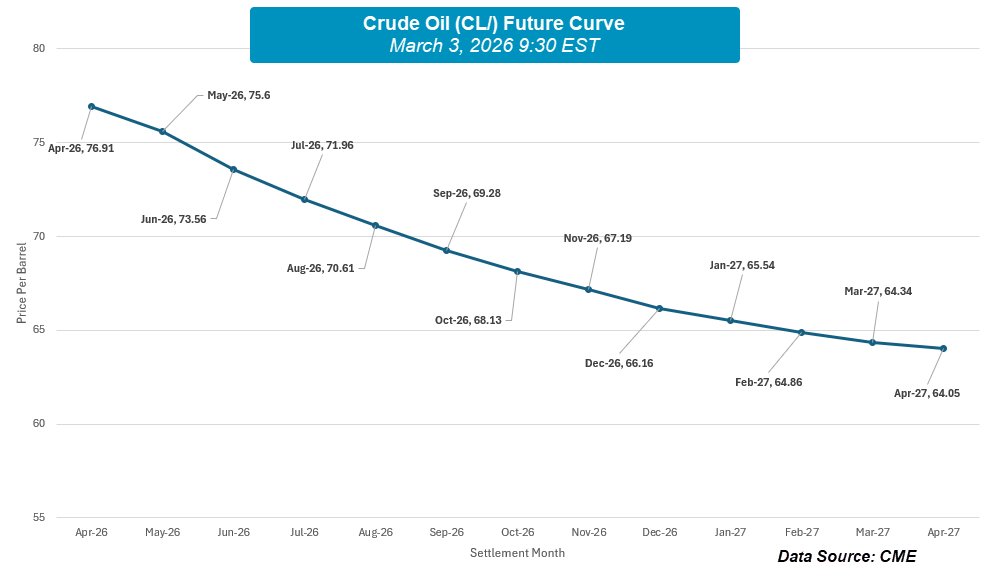
Volatility has perked higher in equity markets, but commodities, particularly Crude Oil (CL/), have had violent moves this week. Crude oil has been showing signs of strength over the last month and change as the chances of conflict in Iran increase. The commodity returned to a positive trend in January and with today’s action tested the highs from 2025 which have acted as resistance so far during the trading day. Anytime there is a shock to the oil market, one of the first places I look at is the forward future curve for oil. For those unfamiliar, the forward futures curve just shows the price of each futures contract at each settlement date. Normally, the futures contract closest to settlement is cheaper than those further out as there is some uncertainty premium priced into the dates further away from today. However, in times of uncertainty like today, we can see the price for oil in the front month be higher than the price of oil six months from now. This is usually a sign of short-term panic or lack of supply while the expectation is that prices will come back down once the dust begins to settle. With technical resistance holding and the market’s expectation of lower prices in the future, investors should be wary of adding direct oil exposure at this time.
Average Level
26.96
| < - -100 | -100 - -80 | -80 - -60 | -60 - -40 | -40 - -20 | -20 - 0 | 0 - 20 | 20 - 40 | 40 - 60 | 60 - 80 | 80 - 100 | 100 - > |
|---|---|---|---|---|---|---|---|---|---|---|---|
|
Buy signaltlt
|
|||||||||||
|
Buy signalief
|
|||||||||||
|
Buy signalfxe
|
Buy signalgcc
|
||||||||||
|
Buy signalXLG
|
Buy signalIJH
|
||||||||||
|
Sell signalVOOG
|
Buy signalQQQ
|
Sell signallqd
|
Buy signalVOOV
|
Buy signalefa
|
|||||||
|
Sell signalONEQ
|
Buy signaldia
|
Buy signaliwm
|
Buy signalijr
|
Buy signalEEM
|
Buy signaldvy
|
Buy signaluso
|
|||||
|
Buy signalhyg
|
Buy signalshy
|
Buy signalSPY
|
Sell signaldx/y
|
Buy signalagg
|
Buy signalrsp
|
Buy signalGLD
|
Buy signalicf
|
Buy signalgsg
|
|||
| < - -100 | -100 - -80 | -80 - -60 | -60 - -40 | -40 - -20 | -20 - 0 | 0 - 20 | 20 - 40 | 40 - 60 | 60 - 80 | 80 - 100 | 100 - > |
| AGG | iShares US Core Bond ETF |
| USO | United States Oil Fund |
| DIA | SPDR Dow Jones Industrial Average ETF |
| DVY | iShares Dow Jones Select Dividend Index ETF |
| DX/Y | NYCE U.S.Dollar Index Spot |
| EFA | iShares MSCI EAFE ETF |
| FXE | Invesco CurrencyShares Euro Trust |
| GLD | SPDR Gold Trust |
| GSG | iShares S&P GSCI Commodity-Indexed Trust |
| HYG | iShares iBoxx $ High Yield Corporate Bond ETF |
| ICF | iShares Cohen & Steers Realty ETF |
| IEF | iShares Barclays 7-10 Yr. Tres. Bond ETF |
| LQD | iShares iBoxx $ Investment Grade Corp. Bond ETF |
| IJH | iShares S&P 400 MidCap Index Fund |
| ONEQ | Fidelity Nasdaq Composite Index Track |
| QQQ | Invesco QQQ Trust |
| RSP | Invesco S&P 500 Equal Weight ETF |
| IWM | iShares Russell 2000 Index ETF |
| SHY | iShares Barclays 1-3 Year Tres. Bond ETF |
| IJR | iShares S&P 600 SmallCap Index Fund |
| SPY | SPDR S&P 500 Index ETF Trust |
| TLT | iShares Barclays 20+ Year Treasury Bond ETF |
| GCC | WisdomTree Continuous Commodity Index Fund |
| VOOG | Vanguard S&P 500 Growth ETF |
| VOOV | Vanguard S&P 500 Value ETF |
| EEM | iShares MSCI Emerging Markets ETF |
| XLG | Invesco S&P 500 Top 50 ETF |

| Symbol | Company | Sector | Current Price | Action Price | Target | Stop | Notes |
|---|---|---|---|---|---|---|---|
| ABBV | AbbVie Inc. | Drugs | $234.26 | 210s - low 230s | 284 | 188 | 5 for 5'er, favored DRUG sector, LT pos peer & mkt RS, breakout from consec sell signals, 2.9% yield |
| AB | AllianceBernstein Holding LP | Wall Street | $39.09 | low 40s | 64 | 32 | 3 TA rating, LT mkt RS buy, LT pos trend, top 50% of WALL sector matrix, consec buy signals, buy-on-pullback, yield > 8% |
| PKG | Packaging Corp of America | Forest Prods/Paper | $231.21 | hi 200s - mid 230s | 358 | 184 | 4 TA rating, top 20% of FORE sector RS matrix, LT RS buy, buy-on-pullback |
| ZWS | Zurn Elkay Water Solutions Corp. | Machinery and Tools | $50.96 | hi 40s - lo 50s | 95 | 42 | 5 TA rating, LT pos trend, LT mkt RS buy, consec buy signals, buy-on-pullback |
| CACI | CACI International Inc. | Computers | $624.96 | 570s - 600s | 672 | 528 | 5 for 5'er, top 25% of COMP sector matrix, LT pos mkt RS, triple top breakout |
| CAKE | The Cheesecake Factory Incorporated | Restaurants | $62.95 | low-to-mid 60s | 96 | 52 | 5 for 5'er, top 20% of REST sector matrix, LT pos mkt RS, multiple buy signals, R-R>2.5, 1.8% yield |
| Symbol | Company | Sector | Current Price | Action Price | Target | Stop | Notes |
|---|---|---|---|---|---|---|---|
| CPRT | Copart Incorporated | Autos and Parts | $38.31 | hi 30s | 28 | 42 | 1 TA rating, bottom 50% of AUTO sector matrix, NT and mkt RS sell last month, consec sell signals |
| Symbol | Company | Sector | Current Price | Action Price | Target | Stop | Notes |
|---|---|---|---|---|---|---|---|
| PHM | PulteGroup, Inc. | Building | $133.72 | 110 | Moved to a sell signal. Current exposure may maintain the $110 stop. |
| Comment | |||||||
|---|---|---|---|---|---|---|---|
|
|
|||||||
CPRT Copart Incorporated ($38.75) R- Autos and Parts - CPRT has a 1 for 5 TA rating and sits in the bottom half of the unfavored autos and parts sector RS matrix. The stock moved to a negative trend and gave an RS sell signal against the market last month, showing long-term technical weakness. This came alongside three consecutive sell signals experienced since last summer, speaking to the near-term deterioration. CPRT bounced from oversold territory toward the middle of its trading band at the end of February, offering a entry point for short-seekers. The weight of the technical evidence is negative and deteriorating. Shorts may be initiated in the upper $30s. Our initial stop will be positioned at $42, which would move the stock back to a buy signal. The bearish price objective of $28 will serve as our price target, offering a reward-to-risk north of 2-to-1.
| 24 | 25 | 26 | |||||||||||||||||||||||||||
| 64.00 | X | • | 64.00 | ||||||||||||||||||||||||||
| 63.00 | X | O | 5 | • | 63.00 | ||||||||||||||||||||||||
| 62.00 | X | O | X | O | • | 62.00 | |||||||||||||||||||||||
| 61.00 | X | C | X | O | • | 61.00 | |||||||||||||||||||||||
| 60.00 | X | O | X | X | O | • | 60.00 | ||||||||||||||||||||||
| 59.00 | X | O | 2 | O | X | O | • | 59.00 | |||||||||||||||||||||
| 58.00 | X | X | O | X | O | X | X | O | • | 58.00 | |||||||||||||||||||
| 57.00 | X | O | X | 1 | X | O | 4 | O | X | O | 57.00 | ||||||||||||||||||
| 56.00 | X | O | X | 7 | X | X | O | O | X | O | X | O | 56.00 | ||||||||||||||||
| 55.00 | X | 4 | X | O | 6 | O | X | O | B | O | X | O | X | O | 55.00 | ||||||||||||||
| 54.00 | 3 | O | X | O | X | O | 9 | X | O | X | 3 | X | O | X | O | 54.00 | |||||||||||||
| 53.00 | X | O | 5 | X | O | X | O | A | O | X | O | X | O | X | O | 53.00 | |||||||||||||
| 52.00 | X | O | O | X | O | X | O | O | O | O | 52.00 | ||||||||||||||||||
| 51.00 | X | X | O | X | O | X | O | 51.00 | |||||||||||||||||||||
| 50.00 | X | O | 2 | 8 | O | X | 6 | 9 | 50.00 | ||||||||||||||||||||
| 49.00 | X | O | X | O | O | 8 | O | 49.00 | |||||||||||||||||||||
| 48.00 | X | C | X | O | X | O | 48.00 | ||||||||||||||||||||||
| 47.00 | X | 1 | 7 | X | O | 47.00 | |||||||||||||||||||||||
| 46.00 | O | B | O | O | 46.00 | ||||||||||||||||||||||||
| 45.00 | O | X | O | Top | 45.00 | ||||||||||||||||||||||||
| 44.00 | O | X | A | 44.00 | |||||||||||||||||||||||||
| 43.00 | O | O | 43.00 | ||||||||||||||||||||||||||
| 42.00 | O | 42.00 | |||||||||||||||||||||||||||
| 41.00 | B | X | 41.00 | ||||||||||||||||||||||||||
| 40.00 | O | X | O | 40.00 | |||||||||||||||||||||||||
| 39.00 | O | X | O | Mid | 39.00 | ||||||||||||||||||||||||
| 38.00 | 1 | • | 2 | X | 38.00 | ||||||||||||||||||||||||
| 37.00 | • | O | X | 37.00 | |||||||||||||||||||||||||
| 36.00 | • | O | X | 36.00 | |||||||||||||||||||||||||
| 35.00 | • | O | X | 35.00 | |||||||||||||||||||||||||
| 34.00 | • | O | 34.00 | ||||||||||||||||||||||||||
| 24 | 25 | 26 |
| AEO American Eagle Outfitters, Inc. ($22.25) - Retailing - AEO broke a double bottom at $22 for a second sell signal since peaking at $28 in December 2025. The stock continues to maintain a 4 TA rating, but the market RS chart recently returned to Os and the peer RS chart now resides within on box of a reversal. Support on the more sensitive 0.50 point per box chart can be found at $20, while the default chart maintains support at $15. |
| BUD Anheuser-Busch InBev NV (Belgium) ADR ($76.56) - Food Beverages/Soap - Shares of BUD had rallied in recent weeks, but action today saw the name break a double bottom at $77 to move to a sell signal. However, the 4 for 5'er was previously in overbought territory and it continues to trade in a positive trend, remaining more of a buy. Additionally, a reversal into a column of Xs would mark the start of a shakeout pattern. Initial support lies at $60 but prior resistance in the low $70s could serve as a bounce point as well. |
| DHI D.R. Horton, Inc. ($154.33) - Building - DHI broke a double bottomat $152 to return the stock to a sell signal as shares fell to $150. The move violates the bullish support line, which will drop the stock down to a 2 for 5'er trading in a negative trend. From here, support lies at $146, while additional can be found in the upper $130s. |
| NVDA NVIDIA Corporation ($180.05) - Semiconductors - NVDA fell this week to break a double bottom at $178 before moving lower to $176. This drops the stock to a 2 for 5 TA rating as it moved back to a negative trend. The stock is still in a clearly defined range between $170 and $200-$212. The technical picture remains mixed but is weakening. We will likely need to see movement outside of this range before further technical developments can occur. Support is seen at $172 and $170. Overhead resistance is seen initially at $196. |
| PM Philip Morris International Inc. ($178.55) - Food Beverages/Soap - Shares of PM broke a double bottom at $180 for its first sell signal since October. However, the stock remains a solid 4 for 5'er given its positive trend and relative strength. Additionally, a reversal into Xs would initiate the start of a shakeout pattern. Those with exposure should continue to hold but should watch for further deterioration such as a violation of its bullish support line at $158. |
| TGT Target Corporation ($120.80) - Retailing - TGT reversed into Xs and broke a double top at $120 for a sixth buy signal as shares rallied to $122, a 52-week high. The stock has improved to a 3 for 5'er through early 2026 and currently ranks within the top quartile of the Retailing sector matrix. Okay to consider here on the breakout or on a pullback to the mid $110s. Initial support lies at $112, while additional can be found at $102. |
| URBN Urban Outfitters, Inc. ($65.79) - Retailing - URBN broke a double bottom at $63 for a second sell signal and to bring the chart down to its lowest level since November. The stock has fallen to a 2 for 5'er following a reversal into Os on the market RS chart in the latter half of February and ranks within the bottom half of the Retailing sector matrix. From here, support lies at $60, and a move below support would bring the chart to its lowest level since May last year. |

| Name | Option Symbol | Action | Stop Loss |
|---|---|---|---|
| RTX Corp. - $206.83 | O: 26E210.00D15 | Buy the May 210.00 calls at 13.00 | 192.00 |
| Name | Option | Action |
|---|---|---|
| Deutsche Bank AG (Germany) ADR ( DB) | Apr. 38.00 Calls | Stopped at 33.00 (CP: 33.16) |
| Albemarle Corp ( ALB) | May. 180.00 Calls | Stopped at 164.00 (CP: 164.71) |
| Pan American Silver Corp ( PAAS) | May. 65.00 Calls | Stopped at 62.00 (CP: 61.15) |
| Name | Option Symbol | Action | Stop Loss |
|---|---|---|---|
| CBRE Group, Inc. - $143.66 | O: 26P145.00D17 | Buy the April 145.00 puts at 8.40 | 152.00 |
| Name | Option | Action |
|---|---|---|
| Best Buy Co., Inc. ( BBY) | Apr. 67.50 Puts | Stopped at 5.70 (CP: 4.45) |
| ARM Holdings PLC ADR ( ARM) | Apr. 130.00 Puts | Raise the option stop loss to 11.50 (CP: 13.50) |
| Name | Option Sym. | Call to Sell | Call Price | Investment for 500 Shares | Annual Called Rtn. | Annual Static Rtn. | Downside Protection |
|---|---|---|---|---|---|---|---|
| Bunge Limited $ 120.61 | O: 26G120.00D17 | Jul. 120.00 | 7.90 | $ 55,203.05 | 20.33% | 16.16% | 5.68% |
| Name | Action |
|---|---|
| Intel Corporation ( INTC) - 45.50 | Sell the May 49.00 Calls. |
| The Gap, Inc. ( GAP) - 28.15 | Sell the March 29.00 Calls. |
| Freeport-McMoRan Inc. ( FCX) - 68.29 | Sell the June 65.00 Calls. |
| Kinross Gold Corporation ( KGC) - 36.79 | Sell the April 36.00 Calls. |
| Micron Technology, Inc. ( MU) - 412.67 | Sell the June 420.00 Calls. |
| Moderna, Inc. ( MRNA) - 52.85 | Sell the April 55.00 Calls. |
| Name | Covered Write |
|---|---|
| Target Corporation ( TGT - 113.17 ) | May 115.00 covered write. |
Daily Equity & Market Analysis
LISTEN TO PODCAST
Feb 26, 2026
Loading, Please Wait...
