
Monday's (3/2) trading marked a 99th percentile day for crude oil and drove changes in relative strength in favor of commodities.
Geopolitical conflict in the Middle East over the weekend and into the start of the week sent energy prices sharply higher, with crude oil (CL/) gaining more than 6% during Monday’s (3/2) trading—its strongest single-day performance since June 2025. Monday’s move ranked in the 99th percentile of daily positive returns when examining crude oil prices back to early 1983.
On the default point‑and‑figure chart, crude oil generated a third consecutive buy signal with a double top at $68 as prices rallied to $75, clearing the July 2025 resistance level at $70 and pushing the chart to its highest level since June. Prices settled in the low $70s overnight before early Tuesday trading carried crude above $77, placing the chart within a potential resistance band in the upper‑$70s to $80 range. The chart is also in overbought territory—above the top of its 10‑week trading band— potentially prompting some short‑term holders of crude‑related exposure to consider locking in profits.

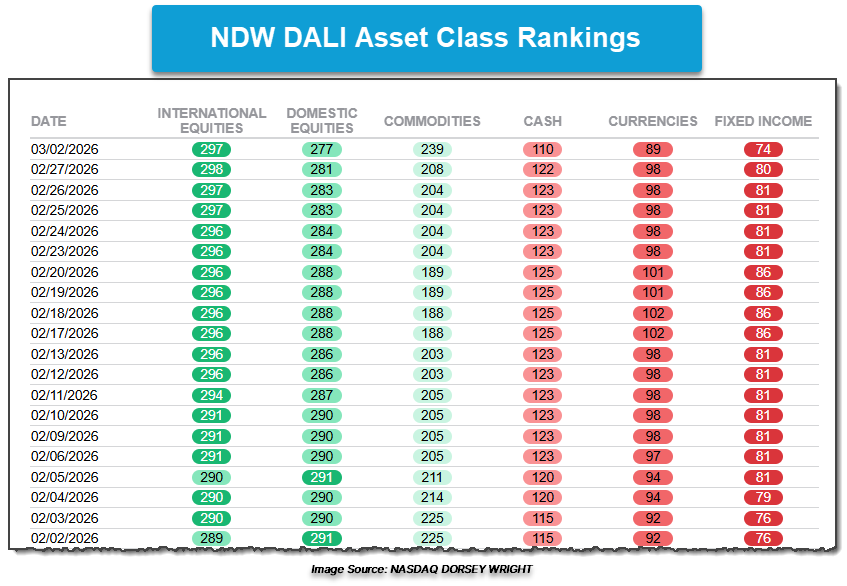
Those tracking the broader impact of the crude oil breakout may have noted the 31 signal jump within the NDW DALI Asset Class Rankings following Monday’s action. Commodities, while still holding the third position in the rankings, gained signals from all five other asset classes, most notably currencies, cash, and fixed income. International equities lost one tally signal, and domestic equities fell to their lowest signal count since early October 2025.
Examples of some of the signal movement appear on relative strength charts for the Invesco DB Oil Fund (DBO) and Invesco DB Energy Fund (DBE). Much of the recent increase in relative strength buy signals for crude‑focused exposure, like DBO, came at the expense of weaker assets such as currencies, cash, and fixed income. A notable shift occurred in oil (DBO) versus small caps represented by the iShares Russell 2000 ETF (IWM), where Monday’s trading produced an RS buy signal—the first since December 2023—establishing long‑term relative leadership for oil over small caps. With crude’s rally, the broader energy complex has also gained ground relative to large‑cap domestic equities with DBE versus SPY returning to an RS buy signal after Monday’s session.

Although Monday’s trading did not cause a change in the NDW DALI Asset Class Rankings, volatile days with significant asset divergence can lead to meaningful shifts in signal counts and potentially foreshadow ranking changes. To stay informed about any updates to the NDW DALI Asset Class Rankings, click the “Set Alerts” button in the upper‑right corner of the DALI page.
