Most Requested Symbols

Momentum strategies showed a strong start to the year in comparison to broader benchmarks.
NDW Morning Pulse - July 1, 2026
Below are highlights from the NDW Morning Update Video for the morning of 6/30/2026. Access the the video on the NDW Morning Update Video page.

Momentum strategies had a productive first half of the year in comparison to broader benchmarks. This was particularly evident for large cap equities, where the Invesco Dorsey Wright Momentum ETF (PDP) tripled the return of the Russell 1000 ETF benchmark (IWB) for the first half (12/31/25-6/30/26). Small cap momentum was also strong, as the Invesco Dorsey Wright SmallCap Momentum ETF (DWAS)outpaced the large-mid counterpart, although it posted outperformance of a smaller magnitude against the Russell 2000 ETF benchmark (IWM).
The performance table below compares the price return of the Invesco Dorsey Wright Momentum ETF (PDP) and the Invesco Dorsey Wright SmallCap Momentum ETF (DWAS) to their respective benchmarks through the first half, while the two bottom tables zoom out to broader, calendar year performance from 2001 to 2026 (through 6/30/2026).

Our approach toward momentum through relative strength analysis looks to capitalize on consistent trends across the market. Changing trends cause the portfolios to readjust to maintain exposure to the strongest areas. Underperformance is typical during those environments as areas that had demonstrated relative strength fall in our rankings. The most important step in our approach comes next – those areas that have declined in strength are sold to make room for the new leaders. Any investment process is going to produce a portfolio of winners and losers. Relative strength analysis gives us a systematic way to cull the losers and constantly push the portfolio toward the strongest areas of the market.
In the most recent quarter, we saw 53 changes (out of 100 holdings) in PDP and 123 changes (out of 200 holdings) in DWAS, repositioning both portfolios toward areas of leadership as we enter the second quarter. Both portfolios saw more turnover at this evaluation than either strategy saw last quarter.
Below you'll find an update about the specific changes made in both strategies with the most recent index reconstitution. Keep in mind that removed positions likely no longer maintain characteristics of superior relative strength; meanwhile, additions have improved to a place of leadership and could be ideas to consider.
Invesco Dorsey Wright Momentum ETF (PDP)
The stock-selection process behind the Invesco Dorsey Wright Momentum ETF (PDP) is simple yet robust. Every quarter, we apply the relative strength process to compare approximately 1,000 large- and mid-cap US stocks and select the strongest 100 names. The quarterly reconstitution process's goal is to weed out the weak names and realign the portfolio toward strength. As mentioned before, with this most recent reconstitution and rebalance, we removed 53 stocks and added 53 new stocks, which we've compiled in the tables below. Several observations:


Invesco Dorsey Wright SmallCap Momentum ETF (DWAS)
The stock-selection process used in DWAS is like PDP. Every quarter, we apply the relative strength process to compare approximately 2,000 US-listed small-cap stocks and select the strongest 200 names. With this most recent reconstitution and rebalance we pushed the portfolio towards strength by removing 123 stocks and adding 123 new stocks, which we've outlined in the table below. However, and perhaps unique to DWAS, not all stocks that were removed are technically weak. We have received this question in the past, so we want to address it here.
One reason for these removals is due to stocks exceeding the market cap filter. High-momentum stocks should, ideally, increase in market cap which means that sometimes a name will exceed the small-cap maximum at the end of a quarter. This is not the norm, but worth keeping in mind when reviewing the changes. Several takeaways:


Disclosures:
This article is intended for Financial Professional Use Only.
Management and other expenses can have a material impact on performance when compounded over time. Past performance, hypothetical or actual, does not guarantee future results. In all securities trading there is a potential for loss as well as profit. It should not be assumed that recommendations made in the future will be profitable or will equal the performance as shown.
Click here for more information from Invesco on the Invesco DWA Momentum ETF (PDP): https://www.invesco.com/us/financial-products/etfs/product-detail?audienceType=Investor&ticker=PDP
Click here for more information from Invesco on the Invesco DWA SmallCap Momentum ETF (DWAS): https://www.invesco.com/us/financial-products/etfs/product-detail?audienceType=Investor&productId=ETF-DWAS
Dorsey, Wright & Associates, LLC is owned by Nasdaq, Inc. and we have affiliates who also provide financial services, research, information, and act as Brokers/Dealers to a wide variety of clients. Our affiliates use the information we create to create indexes, which are then used to create Exchange Traded Funds. These things create a potential conflict of interest in that we may have an incentive to promote or use the products and services of our affiliates and business partners. A number of Dorsey Wright representatives are registered with and hold securities licenses with the affiliate broker-dealers. In this capacity, they assist with the marketing and distribution of Exchange Traded Products.
Average Level
4.84
| < - -100 | -100 - -80 | -80 - -60 | -60 - -40 | -40 - -20 | -20 - 0 | 0 - 20 | 20 - 40 | 40 - 60 | 60 - 80 | 80 - 100 | 100 - > |
|---|---|---|---|---|---|---|---|---|---|---|---|
|
Buy signalefa
|
Buy signalicf
|
||||||||||
|
Buy signalhyg
|
Buy signalQQQ
|
Buy signalIJH
|
|||||||||
|
Buy signalVOOG
|
Buy signalagg
|
Buy signaltlt
|
|||||||||
|
Buy signalEEM
|
Buy signalief
|
Buy signaliwm
|
|||||||||
|
Sell signalgsg
|
Sell signaluso
|
Buy signalONEQ
|
Buy signalSPY
|
Sell signallqd
|
Buy signalrsp
|
Buy signaldx/y
|
|||||
|
Buy signalgcc
|
Sell signalgld
|
Sell signalfxe
|
Buy signalXLG
|
Sell signalshy
|
Buy signalVOOV
|
Buy signaldvy
|
Buy signaldia
|
Buy signalijr
|
|||
| < - -100 | -100 - -80 | -80 - -60 | -60 - -40 | -40 - -20 | -20 - 0 | 0 - 20 | 20 - 40 | 40 - 60 | 60 - 80 | 80 - 100 | 100 - > |
| AGG | iShares US Core Bond ETF |
| USO | United States Oil Fund |
| DIA | SPDR Dow Jones Industrial Average ETF |
| DVY | iShares Dow Jones Select Dividend Index ETF |
| DX/Y | NYCE U.S.Dollar Index Spot |
| EFA | iShares MSCI EAFE ETF |
| FXE | Invesco CurrencyShares Euro Trust |
| GLD | SPDR Gold Trust |
| GSG | iShares S&P GSCI Commodity-Indexed Trust |
| HYG | iShares iBoxx $ High Yield Corporate Bond ETF |
| ICF | iShares Cohen & Steers Realty ETF |
| IEF | iShares Barclays 7-10 Yr. Tres. Bond ETF |
| LQD | iShares iBoxx $ Investment Grade Corp. Bond ETF |
| IJH | iShares S&P 400 MidCap Index Fund |
| ONEQ | Fidelity Nasdaq Composite Index Track |
| QQQ | Invesco QQQ Trust |
| RSP | Invesco S&P 500 Equal Weight ETF |
| IWM | iShares Russell 2000 Index ETF |
| SHY | iShares Barclays 1-3 Year Tres. Bond ETF |
| IJR | iShares S&P 600 SmallCap Index Fund |
| SPY | SPDR S&P 500 Index ETF Trust |
| TLT | iShares Barclays 20+ Year Treasury Bond ETF |
| GCC | WisdomTree Continuous Commodity Index Fund |
| VOOG | Vanguard S&P 500 Growth ETF |
| VOOV | Vanguard S&P 500 Value ETF |
| EEM | iShares MSCI Emerging Markets ETF |
| XLG | Invesco S&P 500 Top 50 ETF |

| Symbol | Company | Sector | Current Price | Action Price | Target | Stop | Notes |
|---|---|---|---|---|---|---|---|
| GRMN | Garmin Ltd. | Leisure | $233.76 | mid 230s - mid 260s | 364 | 196 | 5 TA rating, LT pos trend and mkt RS buy, top 33% of LEIS sector matrix, buy-on-pullback |
| IBOC | International Bancshares Corporation | Banks | $76.16 | low-to-mid 70s | 93 | 63 | 4 for 5'er, favored BANK sector, LT pos peer & mkt RS, bearish signal reversal, R-R~2.0, 1.95% yield |
| LYV | Live Nation Entertainment Inc. | Leisure | $182.56 | low 160s to mid 170s | 202 | 142 | 4 for 5'er; Pos. Trend; Top Half of Leisure Matrix; Within one box of ATH. |
| MO | Altria Group Inc. | Food Beverages/Soap | $74.05 | low-to-mid 70s | 91 | 62 | 4 for 5'er, top quartile of FOOD sector matrix, one box from RS buy, bullish triangle, 5.9% yield |
| CTRE | CareTrust REIT Inc | Real Estate | $40.47 | $38 - $43 | 62.50 | 34 | 5/5'er since Apr. '25, top quintile of Real Estate Matrix, pos. trend and buy signal since Jul. '23. |
| BTI | British American Tobacco Sp-Adr (United Kingdom) ADR | Food Beverages/Soap | $62.74 | hi 50s - low 60s | 92 | 51 | 4 for 5'er, top 25% of FOOD sector matrix, one box from mkt RS buy, buy on pullback, R-R~3.0, 5.3% yield |
| LAMR | Lamar Advertising Company | Media | $156.35 | mid 140 to mid 150 | 228 | 122 | 5 for 5'er, top third of Media Matrix, pos. trend, Reward-Risk > 11, current yield > 4%. |
| CM | Canadian Imperial Bank of Commerce | Banks | $113.57 | 100s | 165 | 90 | 5 for 5'er, top 10% of favored BANK sector matrix, LT pos peer RS, bearish signal reversal, R-R>3.0, 2.9% yield |
| JCI | Johnson Controls International PLC | Building | $140.47 | upper 130s to lower 150s | 182 | 124 | 4 for 5'er since Apr. '25, top 25% of Building sector matrix, pos. trend, ATH on 6/3. |
| EBAY | eBay Inc. | Retailing | $110.80 | mid 100s - low 110s | 161 | 93 | 5 for 5'er, top 10% of RETA sector matrix, buy on pullback, R-R~3.0 |
| F | Ford Motor Company | Autos and Parts | $14.02 | 14.50 - 16 | 27 | 12.50 | 5 for 5'er, top 20% of AUTO sector matrix, RS buy signal, spread triple top, R-R~5, 3.9% yield |
| HLT | Hilton Worldwide Holdings Inc | Leisure | $332.54 | low 320 - low 340 | 452 | 284 | 5 for 5'er since Nov. '23, top half of Leisure sector matrix, pos. trend since Nov. '23, buy since April. |
| CFG | Citizens Financial Group Inc | Banks | $70.43 | low to hi 60s | 87 | 54 | 5 for 5'er, top quintile of Banks matrix, LT pos. trend, Reward-Risk > 4, Earn. 7/16. |
| IRM | Iron Mountain Inc. | Business Products | $129.97 | mid 120s to mid 130s | 167 | 108 | 5 for 5'er, top quintile of Bus. Prod. matrix, Mkt RS buy since 6/24, pos. trend, Reward-Risk > 9. |
| ESI | Element Solutions Inc. | Chemicals | $46.30 | low to mid 40s | 66 | 38 | 5 for 5'er, top decile of the Chemicals matrix, buy signal since 1/26, Reward-Risk > 3. |
| MFC | Manulife Financial Corporation | Insurance | $40.68 | 37 - 42 | 63 | 32 | 5 for 5'er since 1/26, top quintile of Insurance matrix, 3rd buy and ATH on 6/16. |
| AVBP | ArriVent BioPharma, Inc. | Biomedics/Genetics | $34.37 | low 30s | 55 | 25 | 5 for 5'er, top third of Biotech matrix, pos. L-T Peer and Mkt RS, pos. trend. |
| DLR | Digital Realty Trust, Inc. | Real Estate | $190.58 | 190 - 200 | 230 | 172 | 4 for 5'er, top third of REAL sector matrix, bearish signal reversal, good R-R, 2.5% yield, Earn. 7/23 |
| AFL | AFLAC Incorporated | Insurance | $120.08 | hi 110s - low 120s | 136 | 104 | 4 for 5'er, top half of INSU sector matrix, LT pos mkt & peer RS, spread triple top, 2.1% yield |
| BUD | Anheuser-Busch InBev NV (Belgium) ADR | Food Beverages/Soap | $83.84 | low to mid 80s | 109 | 67 | 4 for 5'er, top decile of Food/Bev. matrix, pos. trend since Apr. '25, one box from Mkt RS buy, Earnings on 7/30. |
| Symbol | Company | Sector | Current Price | Action Price | Target | Stop | Notes |
|---|
| Symbol | Company | Sector | Current Price | Action Price | Target | Stop | Notes |
|---|---|---|---|---|---|---|---|
| SPHR | Sphere Entertainment Co. | Leisure | $172.34 | 140s - 150s | 204 | 122 | Rallied into overbought territory, actionable within the $160 range, raise stop to $152. |
| BVN | Minas Buenaventura (Peru) ADR | Precious Metals | $28.58 | mid 30s | 49 | 29 | Sell signal and negative trend change on 6/29 at $29. |
| APH | Amphenol Corporation | Electronics | $166.42 | 150s - 160s | 196 | 132 | Rallied to ATHs and overbought territory on 6/30. Raise stop to $146. |
| Comment | |||||||
|---|---|---|---|---|---|---|---|
|
|
|||||||
BUD Anheuser-Busch InBev NV (Belgium) ADR ($82.67) - Food Beverages/Soap - BUD has had at least a 3 technical attribute rating for more than 12 months and maintained a 4 TA rating since February. The stock maintains positive near- and long-term peer relative strength and ranks within the top decile of the Food Beverages/Soap sector matrix. BUD also shows positive near-term against the market, while sitting within one box of a potential RS buy signal. BUD has traded within a positive trend since April 2025 and returned to a buy signal in May by breaking a double top at $77. Last week’s trading brought a second buy signal at $85 and multi-year high on the chart, while this week has seen shares dial back to the lower $80s. Okay to consider in the lower to mid $80s. The bullish price objective of $109 will serve as the price target, giving the stock a reward to risk ratio greater than 3.5. The initial stop loss will be set for $67, which would violate multiple levels of support and bring the chart down below the March 2026 chart low.
| 25 | 26 | ||||||||||||||||||||||||||||
| 85.00 | X | 85.00 | |||||||||||||||||||||||||||
| 84.00 | X | X | 84.00 | ||||||||||||||||||||||||||
| 83.00 | X | O | X | 83.00 | |||||||||||||||||||||||||
| 82.00 | X | O | X | 82.00 | |||||||||||||||||||||||||
| 81.00 | X | X | X | O | X | 81.00 | |||||||||||||||||||||||
| 80.00 | X | O | X | O | X | O | X | 80.00 | |||||||||||||||||||||
| 79.00 | X | O | X | O | X | 6 | X | Mid | 79.00 | ||||||||||||||||||||
| 78.00 | X | O | 3 | X | O | 78.00 | |||||||||||||||||||||||
| 77.00 | X | O | X | 77.00 | |||||||||||||||||||||||||
| 76.00 | X | O | X | 5 | 76.00 | ||||||||||||||||||||||||
| 75.00 | X | O | X | O | X | 75.00 | |||||||||||||||||||||||
| 74.00 | X | O | X | O | X | 74.00 | |||||||||||||||||||||||
| 73.00 | X | O | X | O | X | 73.00 | |||||||||||||||||||||||
| 72.00 | X | 2 | O | X | O | 72.00 | |||||||||||||||||||||||
| 71.00 | 6 | O | X | O | 4 | 71.00 | |||||||||||||||||||||||
| 70.00 | X | O | X | X | O | X | 70.00 | ||||||||||||||||||||||
| 69.00 | X | O | X | O | X | O | X | 69.00 | |||||||||||||||||||||
| 68.00 | • | 5 | O | X | O | X | O | Bot | 68.00 | ||||||||||||||||||||
| 67.00 | X | A | • | X | 7 | O | X | 67.00 | |||||||||||||||||||||
| 66.00 | X | O | X | O | • | X | O | 1 | 66.00 | ||||||||||||||||||||
| 65.00 | X | O | X | O | • | X | O | X | X | 65.00 | |||||||||||||||||||
| 64.00 | X | O | X | O | X | O | X | O | X | • | 64.00 | ||||||||||||||||||
| 63.00 | O | X | O | X | 9 | O | X | X | O | X | B | O | X | • | 63.00 | ||||||||||||||
| 62.00 | O | X | 6 | 8 | O | X | O | X | O | X | O | X | O | X | O | X | • | 62.00 | |||||||||||
| 61.00 | O | 5 | O | 7 | O | X | O | 3 | O | X | O | X | O | A | O | X | • | 61.00 | |||||||||||
| 60.00 | O | X | O | X | O | • | O | X | 4 | X | O | X | 9 | X | C | • | 60.00 | ||||||||||||
| 59.00 | 4 | X | O | X | • | B | X | O | X | O | X | O | X | • | 59.00 | ||||||||||||||
| 58.00 | O | • | O | • | O | X | O | O | X | O | • | 58.00 | |||||||||||||||||
| 57.00 | • | • | O | X | 8 | • | 57.00 | ||||||||||||||||||||||
| 56.00 | O | X | • | 56.00 | |||||||||||||||||||||||||
| 55.00 | O | X | • | 55.00 | |||||||||||||||||||||||||
| 54.00 | O | X | • | 54.00 | |||||||||||||||||||||||||
| 53.00 | C | X | • | 53.00 | |||||||||||||||||||||||||
| 52.00 | O | X | • | 52.00 | |||||||||||||||||||||||||
| 51.00 | O | 2 | • | 51.00 | |||||||||||||||||||||||||
| 50.00 | O | X | • | 50.00 | |||||||||||||||||||||||||
| 49.00 | 1 | X | • | 49.00 | |||||||||||||||||||||||||
| 48.00 | O | X | • | 48.00 | |||||||||||||||||||||||||
| 47.00 | O | X | • | 47.00 | |||||||||||||||||||||||||
| 46.00 | O | • | 46.00 | ||||||||||||||||||||||||||
| 25 | 26 |
| AEM Agnico-Eagle Mines Ltd. ($154.29) - Precious Metals - AEM fell to a sell signal Tuesday when it broke a triple bottom at $150. Tuesday's break adds to an already negative technical picture as AEM is a 1 for 5'er that ranks in the bottom half of the precious metals sector matrix. AEM now sits against support at $150 that dates back to September 2025. Beyond that level, it shows no further support until $114. |
| AMT American Tower REIT ($163.57) - Real Estate - AMT fell Tuesday to break a spread triple bottom at $166 before falling to $164 intraday. This marks the third consecutive sell signal for the 0 for 5'er that moved to a negative trend at the end of June. The stock has also been on an an RS sell signal against the market since 2022, highlighting the weak technical picture. The weight of the current evidence is negative and deteriorating. Long exposure should be avoided. Overhead resistance may be seen at $176 and $180. |
| CCI Crown Castle Inc ($75.73) - Real Estate - CCI fell Tuesday to break a double bottom at $78, marking a second consecutive sell signal. This 0 for 5'er moved to a negative trend earlier this month and sits in the bottom quintile of the real estate sector RS matrix. The stock has a weak technical picture, however, it is at support from March and in oversold territory. This highlights a potential sell-on-rally candidate for those with lingering long exposure. Overhead resistance may be seen at $82. Note that earnings are expected on 7/22. |
| DASH DoorDash, Inc. Class A ($185.37) - Restaurants - DASH broke a double top at $188 for a fourth buy signal and to bring the stock up to test notable resistance in the $190 range. DASH has improved to a 4 for 5'er following a reversal back into Xs on the market RS chart earlier this week. Initial support lies at $180, while additional can be found at $174 and $166. |
| GEV GE Vernova Inc. ($1,163.27) - Utilities/Electricity - GEV broke a double top at $1120 to complete a bullish catapult for a second buy signal as shares rallied to $1152. The stock has improved to a 4 for 5'er following a reversal back into Xs on the market RS chart, and it currently ranks 2nd (out of 55) within the Electric Utilities sector matrix. Initial support lies at $1056 and $1024, while additional lies in the upper $800 range. |
| H Hyatt Hotels Corp. ($194.14) - Leisure - H broke a double bottom at $194 to initiate a shakeout pattern. The stock has been a 5 for 5'er since early April and currently ranks within the top third of the Leisure sector matrix. Okay to consider on a reversal back into Xs at $200, while the pattern would be complete upon the triple top break at $208. Support now lies at $190, while additional can be found in the lower $180s. |
| NEM Newmont Corp ($93.63) - Precious Metals - NEM fell to a sell signal Tuesday when it broke a triple bottom at $92. The move adds to an already weak technical picture as NEM is a 1 for 5'er. From here, the next level of support, which dates to November 2025, sits at $89. |
| TSLA Tesla Inc. ($422.69) - Autos and Parts - TSLA broke a double top at $416 to return to a buy signal and flip the trend back to positive. Along with positive near- and long-term peer relative strength, the trend change will increase the stock up to a 4 for 5'er. Note resistance at current prices along with additional in the $440 range. Initial support lies at $372, the bullish support line. |

The option suggestions featured here are pulled from the NDW Options Ideas tool. These are just a sample of the ideas that can be found there. The Options Idea tool contains numerous additional income and speculative plays. It also offers relative strength-based screens targeting the highest (and lowest) relative strength stocks and ETFs that have recently moved counter to their longer-term trend. To access or subscribe to the Options Ideas tool, click here.
Call
Ford Motor Company (F) September 18 $13 Call

| Additional Data: | |
| Bid/Ask Spread | 9.09% |
| Delta | 68.27 |
| Gamma | 14.28 |
| Implied Volatility | 40.69% |
| Expiry Date | 80 |
| Earnings Date | 7/29/2026 |
Put
IREN Ltd (IREN) September 18 $46 Put

| Additional Data: | |
| Bid/Ask Spread | 4.32% |
| Delta | -39.65 |
| Gamma | 1.61 |
| Implied Volatility | 111.70% |
| Expiry Date | 80 |
| Earnings Date | 8/27/2026 |
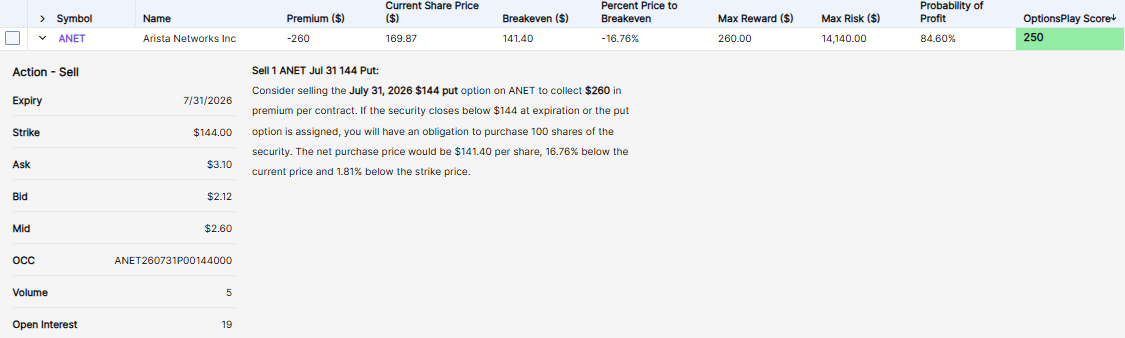
Income (Short Put)
Arista Networks Inc (ANET) July 31 $144 Short Put
| Additional Data: | |
| Ann. Static Return | 24.03% |
| Bid/Ask Spread | 46.23% |
| Delta | 15.19 |
| Gamma | -0.77 |
| Implied Volatility | 56.20% |
| Expiry Date | 30 |
| Earnings Date | 8/4/2026 |
Daily Equity & Market Analysis
Loading, Please Wait...
