Most Requested Symbols

Big stocks have done the majority of the heavy lifting so far coming off of 2026 lows. We explore just how intense this has been in today's report.
The market is overbought even by NDW standards, raising worries that much of the upside has been realized while the market is more vulnerable to pullbacks and declines. Should investors be worried about these concerns?
Weekly Rundown Video – May 6, 2026
Weekly rundown with NDW analyst team covering all major asset classes.
Weekly rundown with NDW analyst team covering all major asset classes.
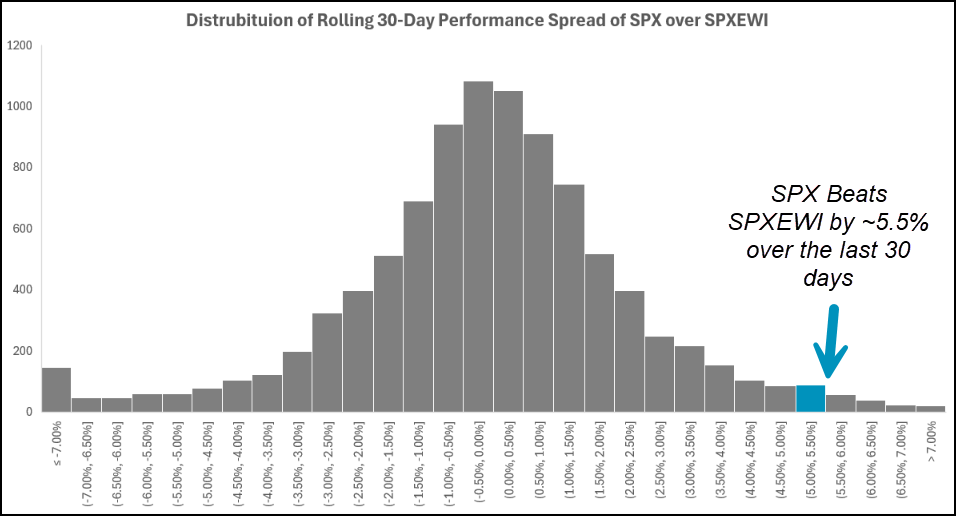
There has been no question that large names have been the featured leaders off of 2026 lows. Markets have been ushered to new-highs at the hands of semiconductors, which while historically overbought, have been stalwarts of relative strength over the last few months (or years, for that matter). All that to say, the rotation back towards the core of the market has led to somewhat significant near-term price appreciation, more heavily discussed on today’s featured article below. This article will focus primarily on the spread of performance in favor of the big names over the last month or so, which has reached somewhat significant levels as we sit roughly halfway through May. The cap weighted S&P 500 (SPX) has outperformed the equal weighted S&P 500 (SPXEWI) by nearly 5.50% over the last 30 days (9.10% vs. 3.74%, respectively) as major markets have quickly pushed to new highs off 2026 lows. This roughly 5.5% spread sits in the 98th percentile of all rolling 30-day spreads since 1990, as detailed in the table below. Some context- the “average” 30-day spread sits at -.13% signaling a slight historical preference for equal weighted assets over the last few decades. All this to say, cap weighted names have been doing a lot of the heavy lifting recently, and a bit of a cooldown wouldn’t be out of the question. Before moving further, it’s important to remember one key footnote about a possible “cooldown.” This spread can tighten in two distinct ways: equal weight assets “catching-up” or cap weighted assets slowing down. Furthermore, either of these scenarios can play out without major absolute depreciation from either asset as we sit around highs.
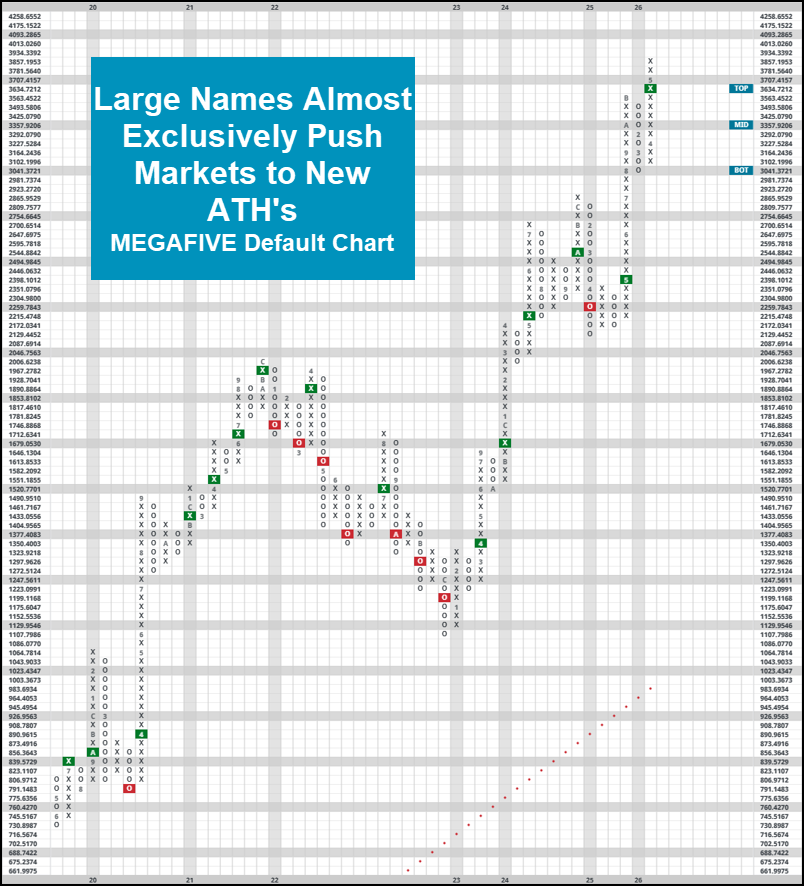
Expanding on this idea even further, we can look at a hypothetical portfolio of the top five largest names by market cap through the lens of ticker (MEGAFIVE). This hypothetical basket of stocks is reconstituted on an annual basis, and is a frequent help for the analyst team when we want to analyze the health of the market’s biggest contenders. MEGAFIVE currently consists of AAPL, MSFT, GOOGL, AMZN, & NVDA as mega-cap tech still dominates the market landscape. It is also worth mentioning that NDW also offers (MEGATEN), which consists of the top-ten largest names each year. MEGAFIVE is up over 18% for the last 30 days, highlighting the magnitude of strength from the top members of the market during this most recent rally. This 18% move is a 98.4 percentile move for any individual month, and the 9.08% spread between (MEGAFIVE) and SPX is a similarly strong 97 percentile relative performance for our larger names against the rest of the market. Although this certainly sounds stretched, the technical picture for MEGAFIVE (or [MEGATEN for that matter) are similarly strong. MEGAFIVE moved to new highs over the last few months, posting its second consecutive buy signal after some large stems of X’s on its default chart. There certainly is something to say about the magnitude of how overbought the backet is (note the 155% weekly OBOS reading as of 5/11) or the lack of support nearby (the next level of support is just over 20% away from current levels.) These items will undoubtedly be important points to watch as we move through the first half of the year, but markets are certainly telling us that the big guys are prepared to do the heavy lifting as they continue to push markets to new highs.

Everyone appreciates a good rally, but a natural question after such positive movement is whether those gains will continue, hold, or reverse, especially if most indices are trading in extended territory. The S&P 500 index funds group within the Asset Class Group Scores page, which NDW views as the “core” of the market, holds an average overbought/oversold (OBOS) reading of 104%. Levels above 75% are considered elevated territory, with readings above 100% being more significantly overbought, and this is denoted by the green line on the chart below. Investors tend to fear overbought markets because prices have advanced abnormally quickly, raising concerns that much of the upside has already been realized while the market is more vulnerable to pullbacks and declines. Given that the market is overbought even by NDW standards, should investors be worried about these concerns?

Is an Overbought Market Abnormal?
Before addressing the outlook of an overbought market, let’s focus on whether it’s really that rare to see one in the first place. While the S&P 500 group is undoubtedly in extended territory, the group sees OBOS readings above 100% more than one might expect. There have been 38 instances since 2004 in which the S&P 500 group had an OBOS reading above 100%, excluding clusters within ten weeks. Said differently, investors should expect two distinct overbought periods in any given year. Additionally, the market can remain overbought for significant periods of time. As a result, the group has experienced an OBOS reading above 100% roughly one eighth of the time since 2004. In fact, our current reading of 104% doesn’t even rank in the top 10% of trading days, underscoring that we shouldn’t view things as too unusual just yet. Readings above 150% are be much rarer, as they occur only 1.3% of the time, making that a more significant level to watch for.

Do Overbought Markets Perform Worse?
That said, just because something is common doesn’t mean it can’t have a big impact. Many investors assume that rapid upside leaves the market with less room to run, but does the data actually support that view? Looking at the previous 37 times the core was this overbought, the market wasn’t always due for a bad year, even if the next month wasn’t great. Historically, those overbought periods have seen negative to muted returns over the next one to two weeks, which is consistent with the near-term nature of the OBOS metric. As a result, we might want to temper our expectations for the next couple of weeks or the next month. However, overbought periods have typically seen solid returns across longer horizons, as the average one-year return was 10.8%. Additionally, those instances generated positive returns at a higher rate than usual, as more than 86% of those instances were higher over the next year.

Do Overbought Markets See Sharper Declines?
While the market technically performs better in overbought environments, some may argue those environments are due to higher levels of volatility, often seeing sharper declines before rallying. However, even those claims fail to hold up when examined more closely.
Previous instances saw limited downside over longer periods, with the worst one-year return being a decline of 6.5%, which is low in comparison to the maximum one-year return of 32.4%. Meanwhile, the average peak-to-trough decline of the S&P 500 during those examples was lower than usual. The S&P 500 averages a maximum drawdown of 14.7% at some point during the typical year since 2004. Meanwhile, overbought environments averaged a maximum drawdown of 12.7% over the next year from when they first became 100% overbought. In fact, overbought periods saw less extreme drawdowns on average than non-overbought periods across each timeframe from the next one-week to the next year. Meanwhile, there was usually an extended period without an overbought market (marked in green) before some of the sharpest declines (e.g., 2008 & 2022), as seen in the graph below. That isn't to say things couldn't decline sharply from here, but regardless of how you slice it, overbought periods were less likely to decline than standard markets over the last 20 years, which comes in stark contrast to expectations.

Recent research has shown that you shouldn’t be afraid to go all-in or buy at all-time highs, and the same appears to be true about buying in overbought conditions. If anything, an overbought market has been a positive signal for the broader health of the market, serving as a sign of confidence in its long-term relative strength, even if the next couple of weeks are slower than normal. After all, a strong market is usually required to push things into extended territory, which helps explain why performance and downside were better than normal. It might be tempting to fade an extended environment, but history has shown the market’s long-term strength tends to be unfazed by overbought conditions. Meanwhile, an overbought market can always become more overbought in the near term.
Average Level
37.60
| < - -100 | -100 - -80 | -80 - -60 | -60 - -40 | -40 - -20 | -20 - 0 | 0 - 20 | 20 - 40 | 40 - 60 | 60 - 80 | 80 - 100 | 100 - > |
|---|---|---|---|---|---|---|---|---|---|---|---|
|
Sell signallqd
|
|||||||||||
|
Buy signaldvy
|
Sell signaldia
|
Buy signalEEM
|
|||||||||
|
Sell signaldx/y
|
Sell signaltlt
|
Sell signalUSO
|
Buy signalefa
|
Buy signalicf
|
Buy signalijr
|
Buy signalSPY
|
|||||
|
Buy signalshy
|
Sell signalagg
|
Buy signalhyg
|
Buy signalfxe
|
Buy signalIJH
|
Buy signalGCC
|
Buy signalXLG
|
Buy signalONEQ
|
||||
|
Sell signalief
|
Sell signalgld
|
Buy signalGSG
|
Buy signalrsp
|
Buy signalVOOV
|
Buy signaliwm
|
Buy signalVOOG
|
Buy signalQQQ
|
||||
| < - -100 | -100 - -80 | -80 - -60 | -60 - -40 | -40 - -20 | -20 - 0 | 0 - 20 | 20 - 40 | 40 - 60 | 60 - 80 | 80 - 100 | 100 - > |
| AGG | iShares US Core Bond ETF |
| USO | United States Oil Fund |
| DIA | SPDR Dow Jones Industrial Average ETF |
| DVY | iShares Dow Jones Select Dividend Index ETF |
| DX/Y | NYCE U.S.Dollar Index Spot |
| EFA | iShares MSCI EAFE ETF |
| FXE | Invesco CurrencyShares Euro Trust |
| GLD | SPDR Gold Trust |
| GSG | iShares S&P GSCI Commodity-Indexed Trust |
| HYG | iShares iBoxx $ High Yield Corporate Bond ETF |
| ICF | iShares Cohen & Steers Realty ETF |
| IEF | iShares Barclays 7-10 Yr. Tres. Bond ETF |
| LQD | iShares iBoxx $ Investment Grade Corp. Bond ETF |
| IJH | iShares S&P 400 MidCap Index Fund |
| ONEQ | Fidelity Nasdaq Composite Index Track |
| QQQ | Invesco QQQ Trust |
| RSP | Invesco S&P 500 Equal Weight ETF |
| IWM | iShares Russell 2000 Index ETF |
| SHY | iShares Barclays 1-3 Year Tres. Bond ETF |
| IJR | iShares S&P 600 SmallCap Index Fund |
| SPY | SPDR S&P 500 Index ETF Trust |
| TLT | iShares Barclays 20+ Year Treasury Bond ETF |
| GCC | WisdomTree Continuous Commodity Index Fund |
| VOOG | Vanguard S&P 500 Growth ETF |
| VOOV | Vanguard S&P 500 Value ETF |
| EEM | iShares MSCI Emerging Markets ETF |
| XLG | Invesco S&P 500 Top 50 ETF |

| Symbol | Company | Sector | Current Price | Action Price | Target | Stop | Notes |
|---|---|---|---|---|---|---|---|
| COST | Costco Wholesale Corporation | Retailing | $1008.79 | 944-1050s | 1296 | 832 | 4 TA rating, top 33% of retail sector matrix, LT mkt RS buy, LT pos trend, consec buy signals, Earn. 5/28 |
| DRI | Darden Restaurants, Inc. | Restaurants | $196.23 | 190s - low 200s | 226 | 168 | 4 for 5'er, LT pos peer & mkt RS, pos trend flip, triple top, 3% yield |
| BPOP | Popular, Inc. | Banks | $149.03 | hi 130s - low 150s | 200 | 120 | 5 for 5'er, 18 of 174 in favored BANK sector matrix, LT pos peer & mkt RS, triple top, good R-R, 2% yield |
| HAS | Hasbro, Inc. | Leisure | $97.78 | lo-hi 90s | 122 | 79 | 5 TA rating, top 33% of LEIS sector matrix, LT pos trend, pos wkly mom, Earn. 5/20 |
| GRMN | Garmin Ltd. | Leisure | $240.09 | mid 230s - mid 260s | 364 | 196 | 5 TA rating, LT pos trend and mkt RS buy, top 33% of LEIS sector matrix, buy-on-pullback |
| SBUX | Starbucks Corporation | Restaurants | $104.93 | hi 90s - mid 100s | 1296 | 85 | 4 for 5'er, top 20% of REST sector matrix, mkt RS reversal to Xs, triple top, 2.35% yield |
| OSW | OneSpaWorld Holdings Ltd. | Leisure | $24.83 | 22 - 24 | 30.50 | 19 | 5 for 5'er, top half of LEIS sector matrix, LT pos peer & mkt RS, spread quintuple top |
| IMO | Imperial Oil Limited | Oil | $126.98 | mid 120s to mid 130s | 164 | 112 | 5 for 5'er; top quartile of Oil matrix; long term mkt and peer RS; Pos. Trend since May '25. |
| SKT | Tanger Inc. | Real Estate | $36.37 | mid-to-hi 30s | 48 | 31 | 5 for 5'er, top 25% of REAL sector matrix, LT pos peer & mkt RS, R-R~2.0, 3.2% yield |
| IBOC | International Bancshares Corporation | Banks | $73.27 | low-to-mid 70s | 93 | 63 | 4 for 5'er, favored BANK sector, LT pos peer & mkt RS, bearish signal reversal, R-R~2.0, 1.95% yield |
| Symbol | Company | Sector | Current Price | Action Price | Target | Stop | Notes |
|---|---|---|---|---|---|---|---|
| ADBE | Adobe Systems Incorporated | Software | $253.04 | 240s - 250s | 168 | 288 | 0 for 5'er, bottom third of SOFT sector, LT neg mkt & peer RS, sell on rally, R-R>2.0 |
| Symbol | Company | Sector | Current Price | Action Price | Target | Stop | Notes |
|---|---|---|---|---|---|---|---|
| CPRT | Copart Incorporated | Autos and Parts | $33.94 | hi 30s | 28 | 42 | Removed for earnings. Lower stop to $39. Earn. 5/21 |
| FIVE | Five Below Inc | Retailing | $223.24 | hi 220s - hi 240s | 316 | 190 | FIVE has fallen to a sell signal. OK to hold here. Maintain $190 stop. Earnings 6/3. |
| Comment | |||||||
|---|---|---|---|---|---|---|---|
|
|
|||||||
IBOC International Bancshares Corporation R ($73.13) - Banks - IBOC is a 4 for 5'er and member of the favored banks sector matrix that has been on peer and market RS buy signals since 2009 and 2021, respectively. After giving two consecutive sell signals and falling to a negative trend, IBOC rallied, returning to a buy signal and a positive trend when it completed a bearish signal reversal at $70. Long exposure may be added in the low to mid $70s and we will set our initial stop at $63. We will use the bullish price objective, $93, as our target price, giving us a reward-to-risk ratio of roughly 2.0. IBOC also carries a 1.95% yield.
| 26 | |||||||||||||||||||||||||||||
| 75.00 | X | • | 75.00 | ||||||||||||||||||||||||||
| 74.00 | • | X | O | • | 5 | 74.00 | |||||||||||||||||||||||
| 73.00 | X | • | X | X | O | • | X | 73.00 | |||||||||||||||||||||
| 72.00 | X | O | • | X | O | X | X | O | X | • | X | 72.00 | |||||||||||||||||
| 71.00 | X | X | X | O | • | X | O | X | O | 2 | O | X | O | • | X | 71.00 | |||||||||||||
| 70.00 | X | O | X | O | X | 9 | • | • | X | O | X | O | X | O | X | O | 4 | 70.00 | |||||||||||
| 69.00 | X | O | X | O | X | O | X | • | X | • | X | O | 1 | O | X | O | X | 3 | X | X | Mid | 69.00 | |||||||
| 68.00 | 7 | O | X | O | O | X | O | X | B | O | C | O | X | O | • | O | • | O | X | O | X | 68.00 | |||||||
| 67.00 | X | 8 | A | X | O | X | O | X | O | X | O | X | • | • | O | X | O | X | 67.00 | ||||||||||
| 66.00 | X | X | O | • | O | X | O | X | O | X | O | • | O | O | X | 66.00 | |||||||||||||
| 65.00 | O | 6 | O | X | • | O | O | • | O | X | • | O | • | 65.00 | |||||||||||||||
| 64.00 | O | X | O | X | • | • | O | • | • | 64.00 | |||||||||||||||||||
| 63.00 | O | X | O | X | • | • | 63.00 | ||||||||||||||||||||||
| 62.00 | O | O | • | 62.00 | |||||||||||||||||||||||||
| 26 |
| AEO American Eagle Outfitters, Inc. ($15.69) - Retailing - AEO broke a double bottom at $15.50 to return to a sell signal. The break also violates the bullish support line, which will drop the stock down to a 2 for 5'er trading in a negative trend. From here, support lies at $14.50. |
| B Barrick Mining Corporation ($47.00) - Precious Metals - B returned to a buy signal Monday when it broke a double top at $45 and continued higher to $47, where it now sits against resistance. The moved adds to a modestly positive technical picture as B is a 3 for 5'er. From here, the first level of support sits at $39. |
| BA The Boeing Company ($238.21) - Aerospace Airline - Up just under 10% for the year, BA posted its second consecutive buy signal on its default chart with action on 5/11. However, buyer beware- the stock remains a low attribute option and is encroaching on a level of significant resistance from late 2025/early 2026. With that in mind, you may be best suited limiting exposure where at all possible. |
| ISRG Intuitive Surgical, Inc. ($420.42) - Healthcare - ISGR moved down lower to complete a double bottom break at $440, marking its fifth consecutive sell signal. The 1 for 5'er moved down from a 3 earlier this month after giving a sell signal against the market and reversing back into Os against its peers. Additionally, the stock sits in the bottom half of the healthcare sector matrix. The weekly OBOS indicates that the stock is near oversold territory, so wait for a slight pullback towards the middle of the trading band before selling your position. Initial strong resistance is at $488, with additional resistance at $504. |
| RL Ralph Lauren ($343.12) - Textiles/Apparel - RL broke a double bottom at $348 to complete a bearish catapult as shares fell to $344. This follows a negative trend reversal earlier in May, which dropped the stock down to a 4 for 5'er trading in a negative trend. From here, support lies at current chart levels, while addtional can be found at $328 and $320. |
| TMO Thermo Fisher Scientific Inc. ($450.02) - Healthcare - TMO reversed lower to complete a double bottom break at $448, marking its second consecutive sell signal. The 1 for 5'er moved down from a 2 last month after reversing back into Os against its peers. A sell can be considered here, given the weight of the evidence. Initial resistance is at $480, with additional resistance at $536. |
| WPM Wheaton Precious Metals Corp ($143.80) - Precious Metals - WPM returned to a buy signal Monday when it broke a double top at $140. Monday's move adds to a moderately positive technical picture as WPM is a 3 for 5'er that ranks in the top half of the precious metals sector matrix. From here, the next level of overhead resistance sits at $154. Meanwhile, support can be found at $132. |

| Name | Option Symbol | Action | Stop Loss |
|---|---|---|---|
| J.P. Morgan Chase & Co. - $300.00 | O: 26G300.00D17 | Buy the July 300.00 calls at 14.95 | 276.00 |
| Name | Option | Action |
|---|---|---|
| DuPont de Nemours Inc. ( DD) | Jul. 45.00 Calls | Raise the option stop loss to 4.50 (CP: 6.50) |
| Walmart Inc. ( WMT) | Jul. 125.00 Calls | Stopped at 9.30 (CP: 7.50) |
| Fortinet Inc. ( FTNT) | Jul. 85.00 Calls | Raise the option stop loss to 27.15 (CP: 29.15) |
| Name | Option Symbol | Action | Stop Loss |
|---|---|---|---|
| Fidelity National Financial, Inc. - $48.29 | O: 26S50.00D17 | Buy the July 50.00 puts at 4.00 | 52.00 |
| Name | Option | Action |
|---|---|---|
| Abbott Laboratories ( ABT) | Aug. 115.00 Puts | Raise the option stop loss to 28.80 (CP: 30.80) |
| Zoetis Inc. ( ZTS) | Jul. 120.00 Puts | Raise the option stop loss to 39.30 (CP: 41.30) |
| Cognizant Technology Solutions ( CTSH) | Sep. 62.50 Puts | Raise the option stop loss to 10.20 (CP: 12.20) |
| Accenture PLC ( ACN) | Aug. 200.00 Puts | Raise the option stop loss to 30.90 (CP: 32.90) |
| Otis Worldwide Corporation ( OTIS) | Sep. 77.50 Puts | Initiate an option stop loss of 3.60 (CP: 5.60) |
| The Walt Disney Company ( DIS) | Jul. 110.00 Puts | Raise the option stop loss to 5.40 (CP: 7.40) |
| Name | Option Sym. | Call to Sell | Call Price | Investment for 500 Shares | Annual Called Rtn. | Annual Static Rtn. | Downside Protection |
|---|---|---|---|---|---|---|---|
| Synchrony Financial $ 73.14 | O: 26I72.50D18 | Sep. 72.50 | 4.60 | $ 33,461.85 | 20.43% | 16.14% | 5.43% |
| Name | Action |
|---|---|
| Palantir Technologies Inc. Class A ( PLTR) - 137.80 | Sell the July 150.00 Calls. |
| V.F. Corporation ( VFC) - 18.98 | Sell the August 22.00 Calls. |
| Delta Air Lines Inc. ( DAL) - 73.33 | Sell the July 72.50 Calls. |
| Starbucks Corporation ( SBUX) - 104.93 | Sell the September 110.00 Calls. |
| Citigroup, Inc. ( C) - 125.55 | Sell the July 130.00 Calls. |
| Amkor Technology, Inc. ( AMKR) - 76.61 | Sell the July 80.00 Calls. |
| On Semiconductor Corp. ( ON) - 103.20 | Sell the July 105.00 Calls. |
| eBay Inc. ( EBAY) - 107.69 | Sell the July 110.00 Calls. |
| Name | Covered Write |
|---|---|
|
|
|
Daily Equity & Market Analysis
Loading, Please Wait...
