Most Requested Symbols

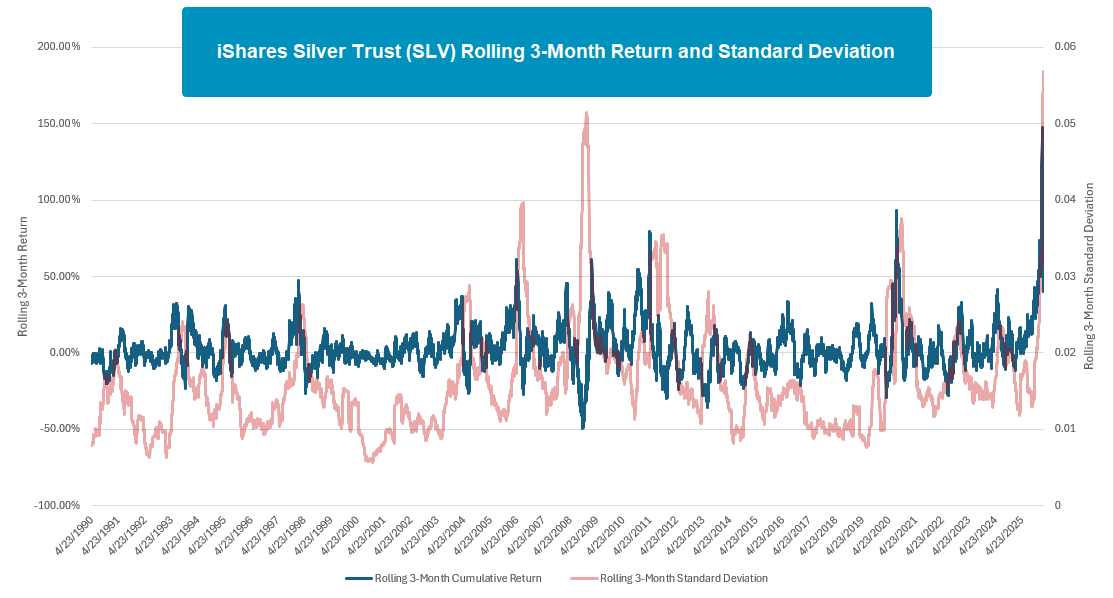
The iShares Silver Trust ([SLV]) has pulled back more than 35% from its closing high of $105.57.
Weekly Rundown Video – Feb 18, 2026
Weekly rundown with NDW analyst team covering all major asset classes.
Weekly rundown with NDW analyst team covering all major asset classes.
The iShares Silver Trust (SLV) has pulled back more than 35% from its closing high of $105.57. However, SLV is still up nearly 50% over the last three months. In fact, SLV’s rolling 3-month return peaked at 144% at the end of January, its best 3-month return with data going back to 1990. Volatility has continued to stay elevated with SLV’s rolling 3-month standard deviation hitting a new all-time high in our dataset. The previous all-time for the 3-month standard deviation was in December 2008, so current moves in silver are unprecedented over the last 35 years. This amount of daily movement is usually associated with a top or a bottom, at least for the next few months. In any case, it’s extremely likely that silver continues to move like it has over the past few months, and that usually relates to a retrace of the move that caused the volatility. While we have already seen that play out over the last two weeks, SLV’s bullish support line and next area big support is down at $45, another 32% lower.
Digging into the SLV’s chart, it trades on four consecutive sell signals but is barely trading in oversold territory which speaks to the level of volatility in recent months. Perhaps the most glaring feature of the chart is the support area being built in the mid-60s. This was initially established in the run-up phase when 2025 bled into 2026. The support area has been tested twice this month and held both times, so its importance has been emphasized. As mentioned earlier, below the mid-60s, there is no established support until $45, so a break could quickly bring on more downside. Daily swings remain volatile, but the tide has shifted to favor sellers in the short-term, so holders should be wary of any further deterioration.


The “sort by YTD performance” buttons on the models page is one of the most clicked features on the NDW platform. While most of us agree that simply using models that are working right now isn’t part of a prudent investment process… it can certainly be quite tempting to “take a peak” at which of the models are doing the best. After all, as trend followers, we are taught to follow what is working, so keeping tabs on different models and their performance can seem quite relevant. With the understanding that it might not be the best practice to sort by performance (but many of us do it anyway…) we will take today’s feature to discuss models that are doing quite well so far this year. Do note, this commentary doesn’t consider client suitability, nor does it intend to focus on any specific universe (or fund provider) in particular. It’s also worth mentioning that just because a model had a strong start to the year does not guarantee further dominance in 2026. Trends are always shifting which could impact performance.
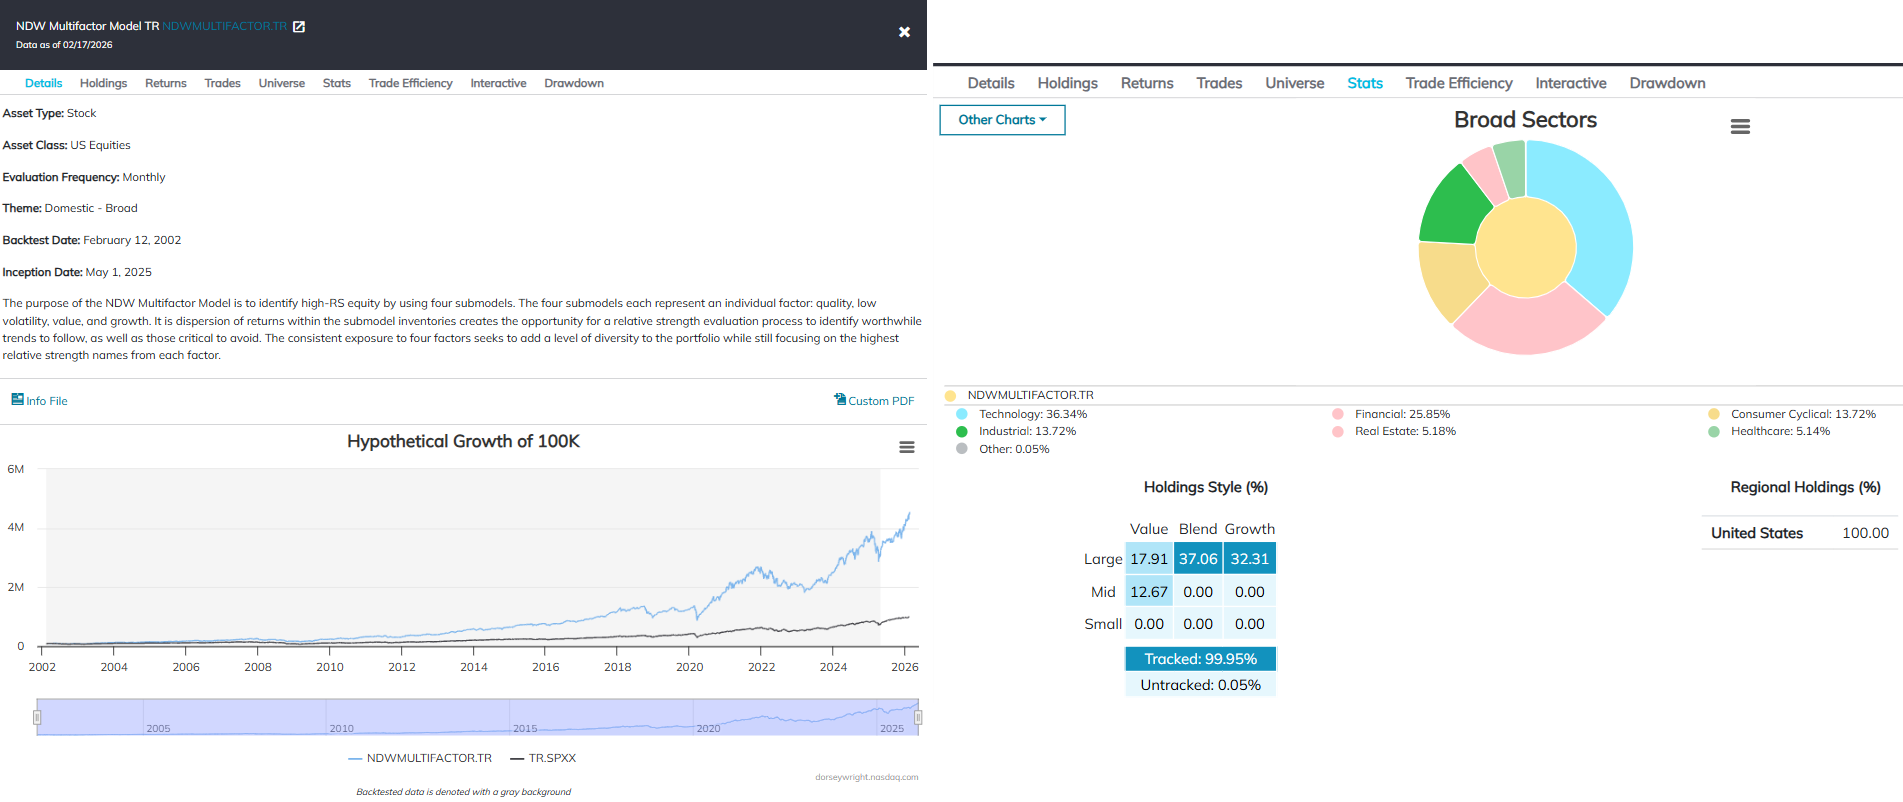
While they might be some of the better performing models this year, we will skip over some of the more “niche” options that focus on individual sectors or countries. Do note, however, that these narrower models can present what we call around the office “high-octane” performance profiles… out/under performance can expand quickly as relative strength trend shift. Regardless, the first of these “non-narrow” options we will highlight is the NDW Multifactor Model, included below. Up nearly 12% so far this year, the model bests its benchmark (TR.SPXX) handily, as the market is roughly flat at the time of this writing. In terms of overall methodology/strategy, the model offers a unique combination of four other factor models discussed in more detail here. In short, the 20 holding model brings in relative strength names from the quality, low vol., value, & growth factors (five from each factor) in an equal weighted fashion. The model maintains heavy allocations towards technology (MU, STX), financials (BK) and industrials (HWM) but the underlying matrix methodology remains flexible to adjust to other areas as needed. It is also worth noting that those of you looking to focus more on any specific factor are welcome to blend together each respective underlying model via the custom modeler static allocation tool. All in all, the multi-factor model presents an opportunity to maintain exposure to growth oriented areas while expanding allocation into other factors in the event of continued core/growth focused relative weakness in 2026.
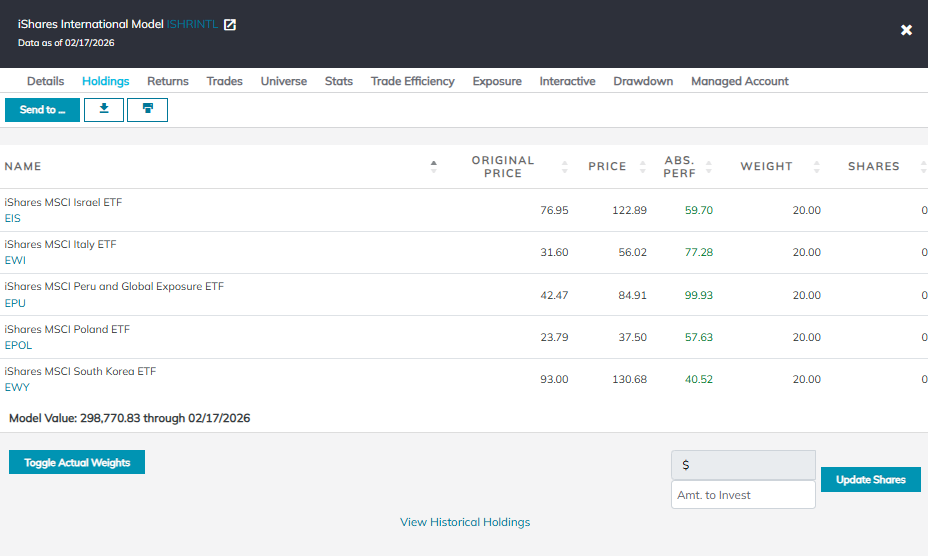
International models remain standouts as the group continues to improve within the NDW rankings. Momentum strategies across the globe remain quite strong as leadership trends appear somewhat consistent, evidenced by the iShares International Model. Up nearly 15% this year, ISHRINTL is nearly doubling its benchmark so far in 2026. The model looks to build off an exceptional 2025, during which it gained ~54% (+27% over its EFA benchmark). In terms of overall methodology, the model utilizes a suite of iShares country specific funds and looks to own the top-five relative strength names until they fall sufficiently out of favor within the matrix. Underneath the hood, holdings include Israel EIS, Italy EWI, Peru EPU, Poland EPOL & South Korea EWY. The model has yet to make a trade in 2026, speaking to the rather persistent strength from international leaders this year. Do keep in mind some of the holdings are somewhat extended… a point to keep in mind when considering near-term exposure.
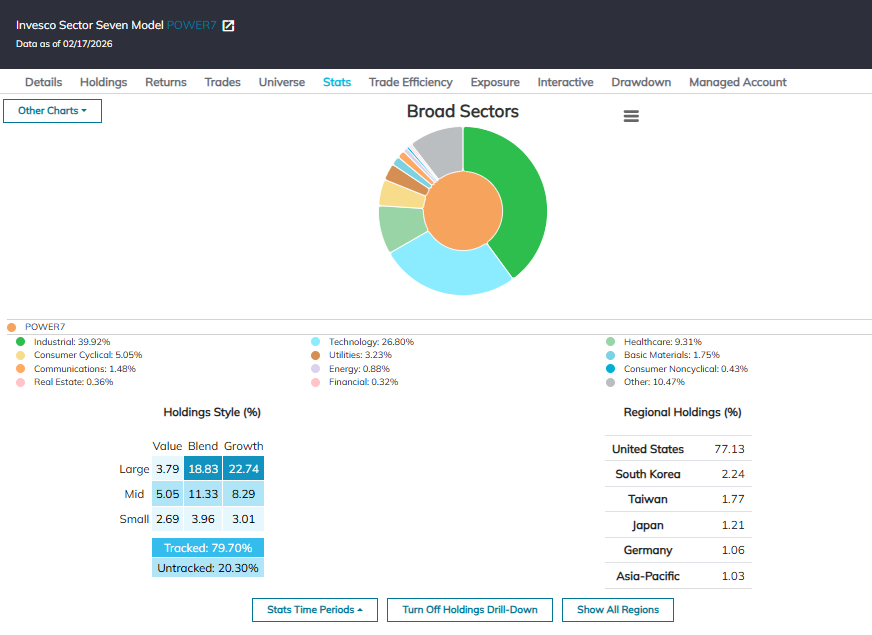
Our last highlight will call out the strong start for the year for the Invesco Sector Seven Model. While the jury is still out on whether or not there is a sustained shift from the likes of technology and communication services leadership underway, the growing number of sectors outperforming the broad market does lead to more interest in sector rotation strategies. The model uses a matrix methodology to select the top seven relative strength leaders from an Invesco sector lineup. Having gained roughly 12.5%, POWER7 is beating the S&P 500 which is roughly flat for the year. Underneath the hood, the model is focused on Aerospace & Defense, Building and Construction, Clean Energy, Next Gen Connectivity, Semiconductors and Pharmaceuticals. Trades this year include moves away from both internet and media & gaming, adding to the weight of the evidence for a larger rotation away from tech focused areas. Further statistics are included below.
While trends could always shift, momentum strategies seem to (largely) be on strong footing right now. Domestically, other areas besides the core doing well should continue to be a tailwind for areas which can properly tilt to new strength as it emerges. On the international front, a continuously weakening dollar remains a major boost for global names- a plus for momentum strategies which can focus on major points of strength. If you have questions about how models can fit into your overall portfolio, feel free to reach out to miles.clark@nasdaq.com
Each week the analysts at NDW review and comment on all major asset classes in the global markets. Shown below is the summary or snapshot of the primary technical indicators we follow for multiple areas. Should there be changes mid-week we will certainly bring these to your attention via the report.
| Universe | BP Col & Level (actual) | BP Rev Level | PT Col & Level (actual) | PT Rev Level | HiLo Col & Level (actual) | HiLo Rev Level | 10 Week Col & Level (actual) | 10 Week Rev Level | 30 Week Col & Level (actual) | 30 Week Rev Level |
|---|---|---|---|---|---|---|---|---|---|---|
| ALL |
|
42% |
|
38% |
|
66% |
|
56% |
|
48% |
| NYSE |
|
56% |
|
54% |
|
80% |
|
68% |
|
62% |
| OTC |
|
36% |
|
34% |
|
56% |
|
50% |
|
50% |
| World |
|
46% |
|
44% |
|
|
|
60% |
|
54% |

Remember, these are technical comments only. Just as you must be aware of fundamental data for the stocks we recommend based on technical criteria in the report, so too must you be aware of important data regarding delivery, market moving government releases, and other factors that may influence commodity pricing. We try to limit our technical comments to the most actively traded contracts in advance of delivery, but some contracts trade actively right up to delivery while others taper off well in advance. Be sure you check your dates before trading these contracts. For questions regarding this section or additional coverage of commodities email james.west@nasdaq.com.
Data represented in the table below is through 2/17/26:
| Symbol | Name | Price | PnF Trend | RS Signal | RS Col. | 200 Day MA | Weekly Mom |
|---|---|---|---|---|---|---|---|
| CL/ | Crude Oil Continuous | 62.26 | Positive | Sell | O | 62.30 | + 8W |
| DBLCIX | Deutsche Bank Liquid Commodities Index | 468.52 | Positive | Sell | O | 460.74 | - 32W |
| DWACOMMOD | NDW Continuous Commodity Index | 1059.84 | Positive | Buy | O | 1018.94 | - 2W |
| GC/ | Gold Continuous | 4889.00 | Positive | Buy | X | 3860.28 | + 7W |
| HG/ | Copper Continuous | 5.64 | Positive | Buy | X | 5.08 | - 4W |
| ZG/ | Corn (Electronic Day Session) Continuous | 426.25 | Positive | Sell | O | 424.18 | - 8W |

Average Level
31.38
| < - -100 | -100 - -80 | -80 - -60 | -60 - -40 | -40 - -20 | -20 - 0 | 0 - 20 | 20 - 40 | 40 - 60 | 60 - 80 | 80 - 100 | 100 - > |
|---|---|---|---|---|---|---|---|---|---|---|---|
|
Buy signaliwm
|
Buy signalijr
|
||||||||||
|
Buy signaldia
|
Buy signalshy
|
||||||||||
|
Buy signalgsg
|
Buy signalVOOV
|
||||||||||
|
Buy signalXLG
|
Buy signalfxe
|
Sell signallqd
|
Sell signalief
|
Buy signaldvy
|
|||||||
|
Sell signalONEQ
|
Buy signalQQQ
|
Buy signalgcc
|
Buy signaluso
|
Buy signalIJH
|
Buy signaltlt
|
Buy signalefa
|
|||||
|
Sell signalVOOG
|
Sell signaldx/y
|
Buy signalSPY
|
Buy signalhyg
|
Buy signalGLD
|
Buy signalrsp
|
Buy signalagg
|
Buy signalEEM
|
Buy signalicf
|
|||
| < - -100 | -100 - -80 | -80 - -60 | -60 - -40 | -40 - -20 | -20 - 0 | 0 - 20 | 20 - 40 | 40 - 60 | 60 - 80 | 80 - 100 | 100 - > |
| AGG | iShares US Core Bond ETF |
| USO | United States Oil Fund |
| DIA | SPDR Dow Jones Industrial Average ETF |
| DVY | iShares Dow Jones Select Dividend Index ETF |
| DX/Y | NYCE U.S.Dollar Index Spot |
| EFA | iShares MSCI EAFE ETF |
| FXE | Invesco CurrencyShares Euro Trust |
| GLD | SPDR Gold Trust |
| GSG | iShares S&P GSCI Commodity-Indexed Trust |
| HYG | iShares iBoxx $ High Yield Corporate Bond ETF |
| ICF | iShares Cohen & Steers Realty ETF |
| IEF | iShares Barclays 7-10 Yr. Tres. Bond ETF |
| LQD | iShares iBoxx $ Investment Grade Corp. Bond ETF |
| IJH | iShares S&P 400 MidCap Index Fund |
| ONEQ | Fidelity Nasdaq Composite Index Track |
| QQQ | Invesco QQQ Trust |
| RSP | Invesco S&P 500 Equal Weight ETF |
| IWM | iShares Russell 2000 Index ETF |
| SHY | iShares Barclays 1-3 Year Tres. Bond ETF |
| IJR | iShares S&P 600 SmallCap Index Fund |
| SPY | SPDR S&P 500 Index ETF Trust |
| TLT | iShares Barclays 20+ Year Treasury Bond ETF |
| GCC | WisdomTree Continuous Commodity Index Fund |
| VOOG | Vanguard S&P 500 Growth ETF |
| VOOV | Vanguard S&P 500 Value ETF |
| EEM | iShares MSCI Emerging Markets ETF |
| XLG | Invesco S&P 500 Top 50 ETF |

| Symbol | Company | Sector | Current Price | Action Price | Target | Stop | Notes |
|---|---|---|---|---|---|---|---|
| JPM | J.P. Morgan Chase & Co. | Banks | $307.13 | lo 300s - mid 320s | 380 | 256 | 5 TA rating, top 25% of favored BANK sector matrix, LT RS buy, LT pos trend, buy-on-pullback |
| EWBC | East West Bancorp, Inc. | Banks | $119.64 | mid 100s - mid 110s | 157 | 92 | 4 for 5'er, top third of favored BANK sector matrix, LT pos peer RS, one box from mkt RS buy, spread quad top |
| APTV | Aptiv PLC | Autos and Parts | $82.77 | hi 70s - low 80s | 100 | 69 | 5 for 5'er, top half of AUTO sector matrix, successful trend line test |
| GS | Goldman Sachs Group, Inc. | Wall Street | $916.04 | mid-800s - mid-900s | 1416 | 736 | 5 TA rating, top 10% of WALL sector matrix, LT RS buy, LT pos trend, buy-on-pullback |
| PHM | PulteGroup, Inc. | Building | $141.58 | hi 120s - mid 130s | 168 | 110 | 4 for 5'er, top half of BUIL sector matrix, LT pos peer & mkt RS, bullish catapult |
| CBOE | CBOE Global Markets Inc. | Wall Street | $284.20 | lo 260s - mid 280s | 332 | 228 | 5 TA rating, top 25% of WALL sector matrix, LT RS buy, LT pos trend, buy-on-pullback |
| DAL | Delta Air Lines Inc. | Aerospace Airline | $70.85 | mid-to-hi 60s | 99 | 55 | 4 for 5'er, top half of AERO sector matrix, LT pos mkt RS, triple top, buy on pullback |
| JBL | Jabil Circuit, Inc. | Electronics | $257.40 | mid 240s- lo 270s | 352 | 204 | 4 TA rating, top 50% of ELEC sector matrix, LT RS buy, buy-on-pullback |
| ABBV | AbbVie Inc. | Drugs | $232.86 | 210s - low 230s | 284 | 188 | 5 for 5'er, favored DRUG sector, LT pos peer & mkt RS, breakout from consec sell signals, 2.9% yield |
| Symbol | Company | Sector | Current Price | Action Price | Target | Stop | Notes |
|---|
| Symbol | Company | Sector | Current Price | Action Price | Target | Stop | Notes |
|---|---|---|---|---|---|---|---|
| ULTA | Ulta Beauty, Inc. | Retailing | $706.82 | 632 - hi 600s | 840 | 568 | ULTA has moved into heavily overbought territory. OK to hold here. Maintain $568 stop. Earn. 3/12 |
| ATO | Atmos Energy Corp | Gas Utilities | $180.24 | 170s | 202 | 148 | ATO has moved into heavily overbought territory. OK to hold here. Maintain $148 stop. |
| Comment | |||||||
|---|---|---|---|---|---|---|---|
|
|
|||||||
ABBV AbbVie Inc. R ($227.42) - Drugs - ABBV is a 5 for 5'er and member of the favored drugs sector matrix that has been on peer and market RS buy signals since 2020 and 2022, respectively. After giving two consecutive sell signals on its default chart, ABBV successfully tested its bullish support line and returned to a buy signal with a double top break at $232. Long exposure may be added in the $210s to low $230s and we will set our initial stop $188, which would take out two levels of support on ABBV's chart. We will use the bullish price objective, $284, as our target price. ABBV also carries a 2.87% yield.
| 26 | |||||||||||||||||||||||||||||
| 244.00 | X | 244.00 | |||||||||||||||||||||||||||
| 240.00 | X | O | 240.00 | ||||||||||||||||||||||||||
| 236.00 | A | O | X | X | 236.00 | ||||||||||||||||||||||||
| 232.00 | X | O | X | O | X | O | X | 232.00 | |||||||||||||||||||||
| 228.00 | X | O | X | O | X | O | 2 | X | 228.00 | ||||||||||||||||||||
| 224.00 | X | O | X | C | X | O | X | O | X | 224.00 | |||||||||||||||||||
| 220.00 | X | O | X | 1 | O | X | O | X | Mid | 220.00 | |||||||||||||||||||
| 216.00 | 9 | O | X | O | X | O | X | 216.00 | |||||||||||||||||||||
| 212.00 | • | X | B | O | O | X | 212.00 | ||||||||||||||||||||||
| 208.00 | O | • | X | O | • | 208.00 | |||||||||||||||||||||||
| 204.00 | O | • | X | • | • | 204.00 | |||||||||||||||||||||||
| 200.00 | O | • | X | • | 200.00 | ||||||||||||||||||||||||
| 198.00 | O | • | X | X | X | • | 198.00 | ||||||||||||||||||||||
| 196.00 | O | 5 | O | X | X | O | X | • | 196.00 | ||||||||||||||||||||
| 194.00 | O | X | O | X | O | X | O | X | • | Bot | 194.00 | ||||||||||||||||||
| 192.00 | O | X | O | X | X | X | O | X | X | 8 | X | • | 192.00 | ||||||||||||||||
| 190.00 | O | X | O | X | O | X | O | X | O | X | O | X | O | • | 190.00 | ||||||||||||||
| 188.00 | O | X | O | X | O | 6 | O | 7 | O | X | O | X | • | 188.00 | |||||||||||||||
| 186.00 | O | X | O | X | O | X | O | X | O | • | O | • | 186.00 | ||||||||||||||||
| 184.00 | O | X | O | X | O | X | O | X | • | • | 184.00 | ||||||||||||||||||
| 182.00 | O | X | O | O | X | O | • | 182.00 | |||||||||||||||||||||
| 180.00 | O | X | X | O | X | • | 180.00 | ||||||||||||||||||||||
| 178.00 | O | X | X | O | X | O | • | 178.00 | |||||||||||||||||||||
| 176.00 | O | X | O | X | O | X | • | 176.00 | |||||||||||||||||||||
| 174.00 | O | X | O | X | O | X | • | 174.00 | |||||||||||||||||||||
| 172.00 | O | X | O | X | O | X | • | 172.00 | |||||||||||||||||||||
| 170.00 | O | X | O | • | O | • | 170.00 | ||||||||||||||||||||||
| 168.00 | O | X | • | • | 168.00 | ||||||||||||||||||||||||
| 166.00 | O | • | 166.00 | ||||||||||||||||||||||||||
| 26 |
| CAKE The Cheesecake Factory Incorporated ($63.51) - Restaurants - CAKE broke a double top at $65 to complete a bullish catapult and clear resistance that dated back to August last year. After moving back into a positive trend earlier this month, CAKE increased to a 5 for 5'er, and the stock now ranks within the top quintile of the Restaurants sector matrix. Okay to consider in the lower $60s. Note resistance in the upper $60s. Initial support lies at $59, while additional can be found at $57 and $50, the bullish support line. |
| NYT The New York Times Company ($75.19) - Media - NYT moved higher today, printing new all time chart highs in the process. The perfect 5/5'er is up roughly 8% this year and has rallied sharply in a single column of 16 X's on its default chart o post its second buy signal of the year. While this storm forwards leaves the name without much in the way of localized support, it remains actionable at/around current levels. Moves to the top of the trading band are a nice near term price target, action which would represent a near 7% gain from current levels. |
| TXRH Texas Roadhouse, Inc. ($187.37) - Restaurants - TXRH broke a double top at $190 to return to a buy signal. The stock is a 4 for 5'er that ranks 2nd (out of 26) within the Restuarants sector matrix. Okay to consider here on the breakout or on a pullback to the mid-$180s. Note resistance in the upper $190s. Initlal support lies at $180 and $178, the bullish support line, while additional can be found at $166. |
| Name | Option Symbol | Action | Stop Loss |
|---|---|---|---|
| J.P. Morgan Chase & Co. - $309.16 | O: 26E310.00D15 | Buy the May 310.00 calls at 17.15 | 280.00 |
| Name | Option | Action |
|---|---|---|
| Monster Beverage Corp. ( MNST) | Mar. 77.50 Calls | Raise the option stop loss to 5.10 (CP: 7.10) |
| Dollar Tree, Inc. ( DLTR) | Apr. 125.00 Calls | Initiate an option stop loss of 12.15 (CP: 14.15) |
| RTX Corp. ( RTX) | May. 200.00 Calls | Raise the option stop loss to 12.70 (CP: 14.70) |
| Name | Option Symbol | Action | Stop Loss |
|---|---|---|---|
| Dell Technologies Inc Class C - $115.87 | O: 26Q115.00D15 | Buy the May 115.00 puts at 11.95 | 130.00 |
| Name | Option | Action |
|---|---|---|
| Caesars Entertainment Inc. ( CZR) | Mar. 22.00 Puts | Stopped at 1.95 (CP: 1.68) |
| Constellation Brands, Inc. ( STZ) | Apr. 155.00 Puts | Stopped at 8.10 (CP: 7.20) |
| Datadog Inc Class A ( DDOG) | Apr. 125.00 Puts | Initiate an option stop loss of 10.30 (CP: 12.30) |
| Name | Option Sym. | Call to Sell | Call Price | Investment for 500 Shares | Annual Called Rtn. | Annual Static Rtn. | Downside Protection |
|---|---|---|---|---|---|---|---|
| nVent Electric plc $ 115.22 | O: 26D115.00D17 | Apr. 115.00 | 8.30 | $ 54,254.35 | 30.94% | 30.94% | 6.11% |
| Name | Action |
|---|---|
| Alcoa Inc. ( AA) - 57.47 | Sell the March 60.00 Calls. |
| Intel Corporation ( INTC) - 46.18 | Sell the May 49.00 Calls. |
| The Gap, Inc. ( GAP) - 27.60 | Sell the March 29.00 Calls. |
| Enphase Energy Inc ( ENPH) - 45.64 | Sell the April 50.00 Calls. |
| Target Corporation ( TGT) - 116.54 | Sell the May 115.00 Calls. |
| Delta Air Lines Inc. ( DAL) - 70.85 | Sell the April 70.00 Calls. |
| Invesco PLC ( IVZ) - 26.40 | Sell the April 27.00 Calls. |
| Name | Covered Write |
|---|---|
| Fortinet Inc. ( FTNT - 81.69 ) | May 90.00 covered write. |
Daily Equity & Market Analysis
LISTEN TO PODCAST
Feb 12, 2026
NDW MORNING UPDATE
Feb 18, 2026
Loading, Please Wait...
