Most Requested Symbols

Through the end of last week’s action, energy continued its ascension up the NDW DALI Sector Rankings, moving into the third position for the first time since December 2023.
Single stock volatility relative to index volatility reaches historically elevated levels, a tailwind for momentum strategies thus far in 2026.
Weekly Rundown Video – Feb 11, 2026
Weekly rundown with NDW analyst team covering all major asset classes.
Weekly rundown with NDW analyst team covering all major asset classes.
Through the end of last week’s action, energy continued its ascension up the NDW DALI Sector Rankings, moving into the third position for the first time since December 2023. Last week’s action (2/6 -2/13) brought a 16-tally signal increase for energy with most of the signals coming from the likes of communication services and financials, as they fell to fifth and sixth in the rankings. Energy is the most improved sector within the NDW DALI Sector Rankings so far in 2026 with an increase of 71 signals, and the next closet being industrials with a 25-signal increase. From here, if energy were to move into either of the top two spots, it would mark the first time since January 2023.

Last week’s rise in relative strength for energy was derived from continued upside action within energy stocks and funds. The State Street Energy Select Sector SPDR Fund (XLE) improved on recent all-time chart highs by rallying to $55, continuing higher in its current column of Xs that included a third buy signal by in mid-January. The fund has been on a buy signal and in a positive trend chart since December last year and has shown positive near-term market relative strength against the S&P 500 Equal Weight Index (SPXEWI) since January this year. The recent rally has brought the market RS chart to within one box of an RS buy signal for the first time since moving to an RS sell signal in January 2024. From here,
Through Friday’s close (2/13), XLE is up more than 20%, and the recent push higher has brought the ETF above the top of the 10-week trading band and to its most overbought level since April 2024. From here, investors will look for a pullback and consolidation in the lower $50s before considering. Prior resistance in the upper $40 range may be seen as near-term support, while additional can be found in the $45 range.


The broad market has taken a breather to start 2026 with the S&P 500 essentially flat on the year. However, underneath the surface on the single stock level there is plenty of movement to consider. While we often refer to dispersion in a momentum or relative strength framework, one of the biggest trades in Wall Street is the volatility dispersion trade which looks to take advantage of the difference in single-stock volatility compared to index volatility. One way to look at this difference in volatility is to compare the average single-stock implied volatility versus that of the CBOE Volatility Index (VIX). Historically, this spread is almost always positive, which is to be expected as single-stock volatility, even on average, is higher than that of the S&P 500. However, if the spread gets elevated to levels it is currently at, there is usually some absolute volatility expansion at the index level to “catch-up” to volatility of individual names. On the flip side, when the spread between stock and index volatility gets close to zero or turns negative, these have been historically great buying opportunities. In other words, volatility dispersion is mean reverting.

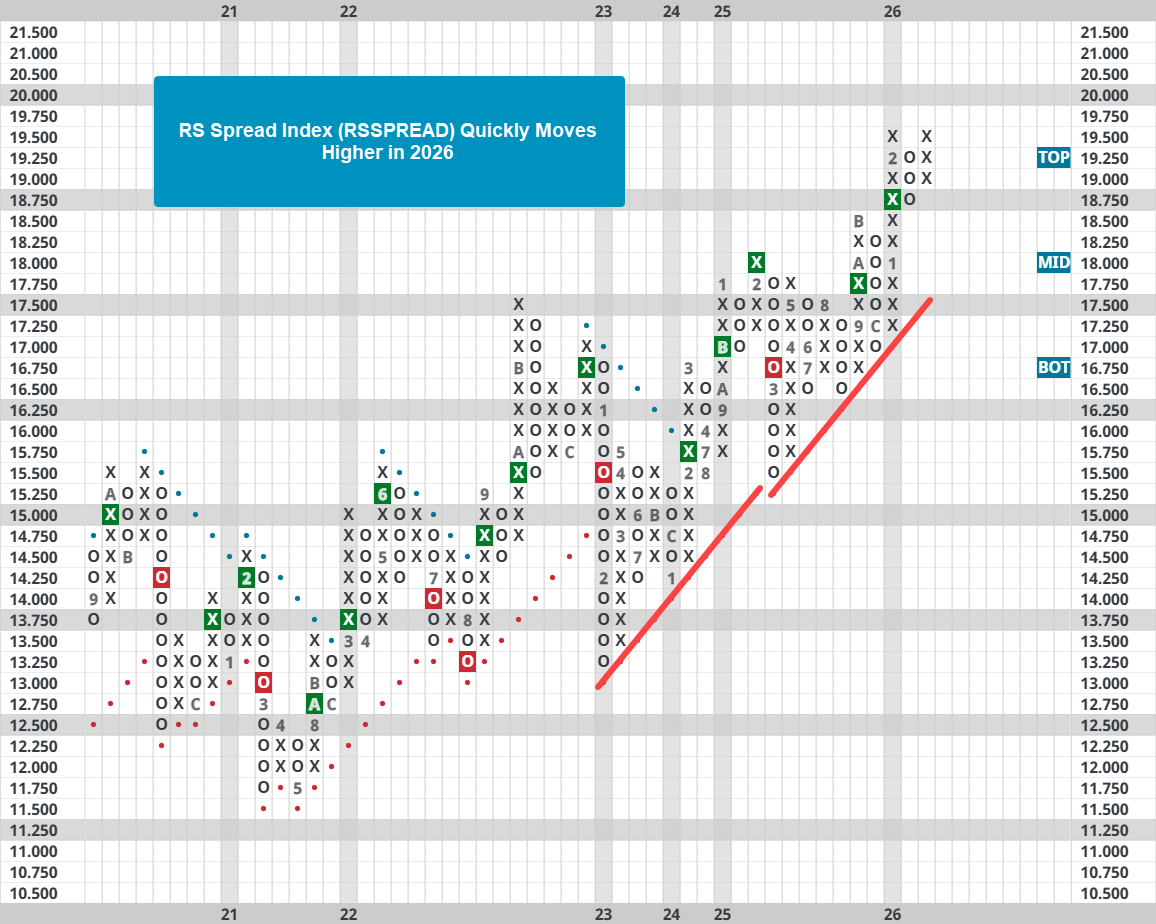
High single-stock volatility, relative to index volatility, can be a great environment for strategies that look to take advantage of differences in stock performance, like momentum. Winners can win big while losers can lose a lot. This is what we’ve experienced so far this year as relative stock volatility is high and high-momentum stocks have done well. One way we quantify the state of momentum is the RS Spread Index (RSSPREAD) which tracks the difference in performance between high and low momentum baskets of stocks. When RSSPREAD is rising, high momentum names are performing better than low momentum names with the opposite also being true. RSSPREAD quickly broke out to new all-time highs to start the year and continued to push higher through February. Fortunately, momentum strategies have been able to take advantage of the big movement in stocks to start their year.
Moving forward, it is hard to expect the difference between single stock and index volatility to stay as elevated as it has been. That doesn’t mean disaster is on the horizon, but some combination of lower stock volatility and higher index volatility is to be expected in the short term. This may lead to a slowdown in the exceptionally strong year for momentum. However, this is perfectly normal, and “slowdown” does not necessarily mean underperformance, it’s very possible momentum continues to do well just not at the level it has to start the year. Investing is full of ups and downs. It’s important to not only to have an investment process, but also a mental framework for dealing with those ups and downs - to stay even keel through both good and bad times.
Average Level
33.31
| < - -100 | -100 - -80 | -80 - -60 | -60 - -40 | -40 - -20 | -20 - 0 | 0 - 20 | 20 - 40 | 40 - 60 | 60 - 80 | 80 - 100 | 100 - > |
|---|---|---|---|---|---|---|---|---|---|---|---|
|
Buy signalgsg
|
|||||||||||
|
Sell signallqd
|
|||||||||||
|
Buy signalijr
|
|||||||||||
|
Buy signalXLG
|
Buy signaliwm
|
Buy signalVOOV
|
Sell signalief
|
||||||||
|
Sell signalONEQ
|
Buy signaldia
|
Buy signalIJH
|
Buy signalGLD
|
Buy signalicf
|
|||||||
|
Sell signalVOOG
|
Buy signalgcc
|
Buy signalfxe
|
Buy signalshy
|
Buy signalrsp
|
Buy signalefa
|
||||||
|
Sell signaldx/y
|
Buy signalQQQ
|
Buy signalSPY
|
Buy signalhyg
|
Buy signaluso
|
Buy signaltlt
|
Buy signalagg
|
Buy signalEEM
|
Buy signaldvy
|
|||
| < - -100 | -100 - -80 | -80 - -60 | -60 - -40 | -40 - -20 | -20 - 0 | 0 - 20 | 20 - 40 | 40 - 60 | 60 - 80 | 80 - 100 | 100 - > |
| AGG | iShares US Core Bond ETF |
| USO | United States Oil Fund |
| DIA | SPDR Dow Jones Industrial Average ETF |
| DVY | iShares Dow Jones Select Dividend Index ETF |
| DX/Y | NYCE U.S.Dollar Index Spot |
| EFA | iShares MSCI EAFE ETF |
| FXE | Invesco CurrencyShares Euro Trust |
| GLD | SPDR Gold Trust |
| GSG | iShares S&P GSCI Commodity-Indexed Trust |
| HYG | iShares iBoxx $ High Yield Corporate Bond ETF |
| ICF | iShares Cohen & Steers Realty ETF |
| IEF | iShares Barclays 7-10 Yr. Tres. Bond ETF |
| LQD | iShares iBoxx $ Investment Grade Corp. Bond ETF |
| IJH | iShares S&P 400 MidCap Index Fund |
| ONEQ | Fidelity Nasdaq Composite Index Track |
| QQQ | Invesco QQQ Trust |
| RSP | Invesco S&P 500 Equal Weight ETF |
| IWM | iShares Russell 2000 Index ETF |
| SHY | iShares Barclays 1-3 Year Tres. Bond ETF |
| IJR | iShares S&P 600 SmallCap Index Fund |
| SPY | SPDR S&P 500 Index ETF Trust |
| TLT | iShares Barclays 20+ Year Treasury Bond ETF |
| GCC | WisdomTree Continuous Commodity Index Fund |
| VOOG | Vanguard S&P 500 Growth ETF |
| VOOV | Vanguard S&P 500 Value ETF |
| EEM | iShares MSCI Emerging Markets ETF |
| XLG | Invesco S&P 500 Top 50 ETF |

| Symbol | Company | Sector | Current Price | Action Price | Target | Stop | Notes |
|---|---|---|---|---|---|---|---|
| JPM | J.P. Morgan Chase & Co. | Banks | $302.55 | lo 300s - mid 320s | 380 | 256 | 5 TA rating, top 25% of favored BANK sector matrix, LT RS buy, LT pos trend, buy-on-pullback |
| EWBC | East West Bancorp, Inc. | Banks | $117.83 | mid 100s - mid 110s | 157 | 92 | 4 for 5'er, top third of favored BANK sector matrix, LT pos peer RS, one box from mkt RS buy, spread quad top |
| ULTA | Ulta Beauty, Inc. | Retailing | $683.40 | 632 - hi 600s | 840 | 568 | 4 TA rating, top 10% of RETA sector matrix, LT RS buy, consec buy signals, Earn. 3/12 |
| APTV | Aptiv PLC | Autos and Parts | $85.20 | hi 70s - low 80s | 100 | 69 | 5 for 5'er, top half of AUTO sector matrix, successful trend line test |
| GS | Goldman Sachs Group, Inc. | Wall Street | $905.14 | mid-800s - mid-900s | 1416 | 736 | 5 TA rating, top 10% of WALL sector matrix, LT RS buy, LT pos trend, buy-on-pullback |
| PHM | PulteGroup, Inc. | Building | $142.56 | hi 120s - mid 130s | 168 | 110 | 4 for 5'er, top half of BUIL sector matrix, LT pos peer & mkt RS, bullish catapult |
| ATO | Atmos Energy Corp | Gas Utilities | $179.25 | 170s | 202 | 148 | 4 for 5'er. top 20% of GUTI sector matrix, LT pos peer RS, 3.3% yield |
| CBOE | CBOE Global Markets Inc. | Wall Street | $275.11 | lo 260s - mid 280s | 332 | 228 | 5 TA rating, top 25% of WALL sector matrix, LT RS buy, LT pos trend, buy-on-pullback |
| DAL | Delta Air Lines Inc. | Aerospace Airline | $69.00 | mid-to-hi 60s | 99 | 55 | 4 for 5'er, top half of AERO sector matrix, LT pos mkt RS, triple top, buy on pullback |
| JBL | Jabil Circuit, Inc. | Electronics | $254.58 | mid 240s- lo 270s | 352 | 204 | 4 TA rating, top 50% of ELEC sector matrix, LT RS buy, buy-on-pullback |
| Symbol | Company | Sector | Current Price | Action Price | Target | Stop | Notes |
|---|
| Comment | |||||||
|---|---|---|---|---|---|---|---|
|
|
|||||||
JBL Jabil Circuit, Inc. ($258.32) - Electronics - JBL has a 4 for 5 TA rating and sits in the top half of the favored electronics sector RS matrix. The stock has maintained an RS buy signal against the market since 2019, speaking to its long-term technical strength. The recent action saw JBL notch a new all-time high after returning to a buy signal before retracting back toward the middle of its trading band, offering a more normalized position. JBL can be considered in the mid-$240s to low $270s. Our initial stop will be positioned at $204, which would violate multiple support levels. The bullish price objective of $352 will serve as our price target.
| 26 | |||||||||||||||||||||||||||||
| 268.00 | X | 268.00 | |||||||||||||||||||||||||||
| 264.00 | X | O | 264.00 | ||||||||||||||||||||||||||
| 260.00 | X | O | 260.00 | ||||||||||||||||||||||||||
| 256.00 | X | X | X | O | 256.00 | ||||||||||||||||||||||||
| 252.00 | X | O | X | O | X | X | O | 252.00 | |||||||||||||||||||||
| 248.00 | X | X | O | X | O | 2 | O | X | 248.00 | ||||||||||||||||||||
| 244.00 | X | O | X | O | O | X | O | X | 244.00 | ||||||||||||||||||||
| 240.00 | 1 | O | X | O | X | O | X | 240.00 | |||||||||||||||||||||
| 236.00 | X | X | O | X | O | O | X | Mid | 236.00 | ||||||||||||||||||||
| 232.00 | X | O | X | X | O | X | O | X | 232.00 | ||||||||||||||||||||
| 228.00 | X | O | X | X | O | X | O | X | O | 228.00 | |||||||||||||||||||
| 224.00 | X | O | X | O | X | O | X | O | X | 224.00 | |||||||||||||||||||
| 220.00 | X | O | X | X | O | X | X | O | X | O | X | 220.00 | |||||||||||||||||
| 216.00 | X | O | X | O | X | B | X | O | X | O | X | O | 216.00 | ||||||||||||||||
| 212.00 | X | X | O | X | O | X | O | X | O | C | O | X | 212.00 | ||||||||||||||||
| 208.00 | X | O | X | O | X | A | X | X | O | O | X | O | 208.00 | ||||||||||||||||
| 204.00 | X | O | X | O | O | X | O | X | O | X | X | 204.00 | |||||||||||||||||
| 200.00 | 9 | X | O | X | O | X | O | X | O | X | 200.00 | ||||||||||||||||||
| 198.00 | O | O | X | O | X | O | X | O | X | 198.00 | |||||||||||||||||||
| 196.00 | O | X | O | O | O | X | 196.00 | ||||||||||||||||||||||
| 194.00 | O | O | X | 194.00 | |||||||||||||||||||||||||
| 192.00 | O | X | 192.00 | ||||||||||||||||||||||||||
| 190.00 | O | 190.00 | |||||||||||||||||||||||||||
| 26 |
| BTU Peabody Energy Corporation ($32.49) - Oil - BTU gave an initial sell signal Tuesday when it broke a double bottom at $33. The outlook for the stock remains positive as the BTU is a 5 for 5'er that ranks first out of 55 names in the oil sector matrix. From here, the next level of support sits at $27. |
| DG Dollar General Corp. ($149.97) - Retailing - DG broke a double top at $154 to return to a buy signal and match the January rally high. The stock is a 5 for 5'er that ranks second (out of 98) in the Retailing sector matrix. Okay to conisder here on the breakout or on a pullback to the mid $140s. Initial support lies at $140, while additional can be found at $124. |
| DHR Danaher Corporation ($205.74) - Healthcare - DHR inched lower to complete a double bottom break at $204. The 3 for 5'er ranks in the top half of the healthcare sector matrix. DHR is still rated a hold, but continue to monitor for further technical deterioration. Initial support is at $204. The bullish support line can be seen at $192. |
| FIVE Five Below Inc ($211.54) - Retailing - FIVE broke a double top at $212 for a third buy signal and to mark a new all-time chart high. The stock has been a 5 for 5'er since June 2025 and currently ranks as the top stock within the Retailing sector matrix. Okay to consider here on the breakout or on a pullback to $200. Initial support lies at $198, while additional may be found at $192 and $184. |
| GE GE Aerospace ($328.36) - Aerospace Airline - GE returned to a buy signal for the first time in 2026 with intraday action on 2/17. The stock remains a high relative strength name, clocking in at a 4/5'er at the time of this writing. While it is certainly true interested parties exercise a bit of caution around a range of resistance around current levels, the technical picture remains quite strong. Support is found nearby at $312, just above the middle of the trading band. |
| NBR Nabors Industries, Inc. ($71.59) - Oil Service - NBR returned to a buy signal and a positive trend Tuesday when it broke a double top at $72, where it now sits against resistance. The positive trend change will promote NBR o 5 for 5'er and the stock ranks in the top quintile of the oil service sector matrix. From here, the first level of support sits at $63. |
| PAAS Pan American Silver Corp ($55.82) - Precious Metals - PAAS fell to a sell signal Tuesday when it broke a double bottom at $54. The outlook for the stock remains positive, however, as PAAS is a 4 for 5'er that ranks near the middle of the precious metals sector matrix. From here, the next level of support lies at $53 a level from which PAAS has rallied twice this month. |
| SGI Somnigroup International Inc ($87.27) - Housed Goods - Shares of SGI fell significantly to break a double bottom at $91, moving back to a sell signal. However, the 5 for 5'er continues to trade in a positive trend while maintaining its market and peer relative strength, keeping it in strong buy territory for the time being. That said, those with exposure should watch for a violation of the bullish support line at $80. Additional support lies at $84 and $79 as well. |
| USAU U.S. Gold Corp ($16.03) - Precious Metals - USAU gave a second consecutive sell signal and fell to a negative trend Tuesday when it broke a double bottom at $15.50. The negative trend change will drop the stock to a 1 for 5'er. From here, the next level of support sits at $14.50. |
| WPM Wheaton Precious Metals Corp ($141.75) - Precious Metals - WPM fell to a sell signal Tuesday when it broke a double bottom at $138. The outlook for the stock remains positive, however, as WPM is a 4 for 5'er. From here, the next level of support sits at $132. |

| Name | Option Symbol | Action | Stop Loss |
|---|---|---|---|
| AbbVie Inc. - $232.77 | O: 26E230.00D15 | Buy the May 230.00 calls at 14.75 | 204.00 |
| Name | Option | Action |
|---|---|---|
| RTX Corp. ( RTX) | May. 200.00 Calls | Initiate an option stop loss of 12.05 (CP: 14.05) |
| Name | Option Symbol | Action | Stop Loss |
|---|---|---|---|
| Dutch Bros Inc. Class A - $53.33 | O: 26P55.00D17 | Buy the April 55.00 puts at 5.05 | 58.00 |
| Name | Option | Action |
|---|---|---|
| Paypal Holdings Inc ( PYPL) | Mar. 60.00 Puts | Stopped at 18.35 (CP: 18.35) |
| Norwegian Cruise Line Holdings Ltd. ( NCLH) | Mar. 24.00 Puts | Stopped at 1.70 (CP: 1.69) |
| General Mills, Inc. ( GIS) | Jun. 47.50 Puts | Initiate an option stop loss of 2.30 (CP: 4.30) |
| Name | Option Sym. | Call to Sell | Call Price | Investment for 500 Shares | Annual Called Rtn. | Annual Static Rtn. | Downside Protection |
|---|---|---|---|---|---|---|---|
| Invesco PLC $ 26.52 | O: 26D27.00D17 | Apr. 27.00 | 1.40 | $ 12,689.50 | 33.05% | 27.33% | 4.23% |
| Name | Action |
|---|---|
| Alcoa Inc. ( AA) - 59.95 | Sell the March 60.00 Calls. |
| Intel Corporation ( INTC) - 46.79 | Sell the May 49.00 Calls. |
| The Gap, Inc. ( GAP) - 27.67 | Sell the March 29.00 Calls. |
| Fortinet Inc. ( FTNT) - 85.56 | Sell the May 90.00 Calls. |
| Enphase Energy Inc ( ENPH) - 43.49 | Sell the April 50.00 Calls. |
| Target Corporation ( TGT) - 115.76 | Sell the May 115.00 Calls. |
| Delta Air Lines Inc. ( DAL) - 69.00 | Sell the April 70.00 Calls. |
| Name | Covered Write |
|---|---|
|
|
|
Daily Equity & Market Analysis
LISTEN TO PODCAST
Feb 12, 2026
NDW MORNING UPDATE
Feb 18, 2026
Loading, Please Wait...
