
The Focus 5 strategy gains steam as new leadership trends emerge
The Focus 5 Model is a sector rotation strategy that invests in five sector/industry ETFs based on the relative strength ranking of roughly 20 sectors. Since its inception in 2009, the model has looked to buy the sectors that are showing the best relative strength. The five positions are held as long as they sit in the top half of our ranking. Positions are only sold when they fall out of the top half of the relative strength rankings. This simple, straightforward, rules-based strategy that has been in existence for more than 16 years is also the basis for the Dorsey Wright Focus 5 Index, which is tracked by the First Trust Dorsey Wright Focus 5 ETF (FV).
Relative strength is just another phrase for momentum. Funds at the top of the Focus 5 inventory relative strength ranking demonstrate more momentum than the funds ranked at the bottom. Over time, relative strength (momentum) has been a robust investment factor with the potential to provide investors with excess return. However, that does not mean a relative strength-based strategy will outperform all the time. There are two types of market environments where relative strength-based strategies tend to underperform: during changes in leadership, and periods with low dispersion of leadership trends.
The first environment is straightforward. If the market is going from a growth-led market to a value-led market, it will take some time for a relative strength strategy to adjust to that new leadership. As the old leadership rotates out, by definition, it will have to endure a period of underperformance before being sold. Subsequently, for the new leadership to move into the models we need to see a period of outperformance before those new areas of strength can be added to the models. The second market environment, narrow leadership, can take on different forms, but this is exactly the type of market environment we have seen over the past few years.
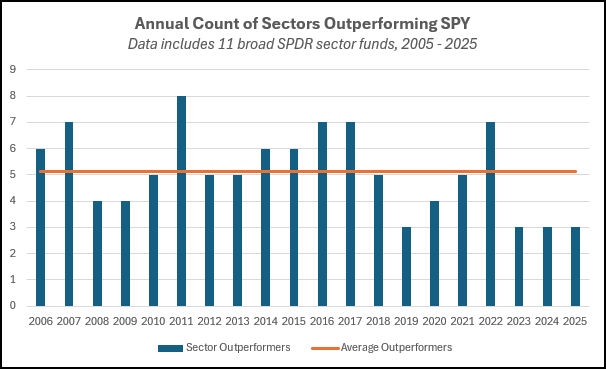
The last three years (2023 – 2025) has been the longest stretch of very narrow leadership that we have seen in more than 20 years. On average, out of the 11 broad sectors, five sectors outperform the S&P 500 each year. When the number of sectors outperforming the market is higher than five, it means there is more opportunity to find excess return in the market through a sector rotation strategy. When the number is lower than five, it means it is harder to find excess returns above the market benchmark. For three consecutive years (2023, 2024, and 2025) there have only been three sectors that have been able to outperform the S&P 500 (SPY). One is Communication Services (XLC), which is basically Meta and Alphabet. Another is Technology (XLK), which has been the best performing in the two of the past three years thanks to NVIDIA, Apple, and Microsoft. Strategies that diversified away from these mega cap growth names have had a tough time keeping up with the S&P 500.
While no two markets are the same, we have seen periods of underperformance for the Focus 5 strategy in the past. Below is a chart with rolling 6-month excess return periods for the Focus 5 strategy versus the S&P 500. The bars above zero (blue bars) represent periods of positive excess return (outperformance) for the Focus 5 while the bars below the zero line (orange bars) represent periods of negative excess return (underperformance) for Focus 5. A couple of points to be made here:
- There are more blue bars than orange bars. That means there are more rolling 6-month periods of outperformance than there are period of underperformance.
- While this recent stretch of 19 consecutive periods of underperformance has been the longest, we have certainly seen other periods of underperformance for the strategy. Healthcare/Biotech had been a notable contributor to the Focus 5 for years until the late 2015/early 2016 time period. The rotation from Healthcare/Biotech to sectors like Energy and Technology produced a stretch of underperformance. Similarly, in the 2021 the Focus 5 moved from Technology to Industrials and Energy.
- Coming out of periods of underperformance like 2011, 2015/2016,and 2021 we tend to see stretches of outperformance as the new leadership takes control.
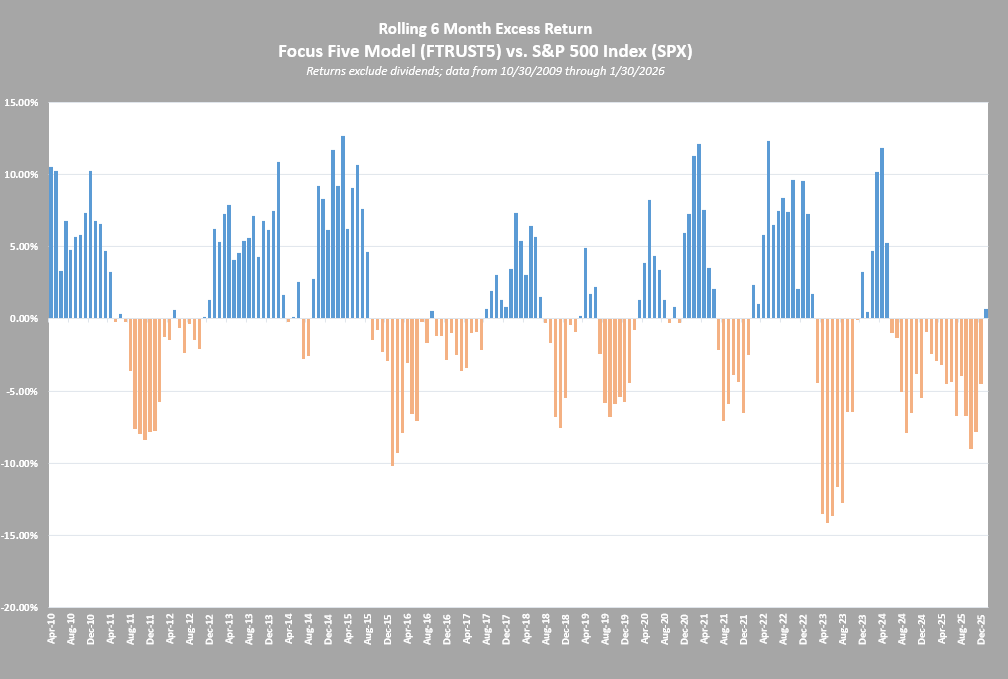
As a result of the performance of Focus 5 over the past few months, the rolling six-month excess return has turned back to being positive for the first time in 19 periods. The last three months (November, December, and January) saw three sector changes within the Focus 5 Model. As a result, FTXL (Semi’s), MISL (Aerospace & Defense), and FBT (Biotech) were all added to the model. The other two positions in the Focus 5 are FDN (Internet) and FXO (Financials), which have maintained consistent leadership.
While it may seem counterintuitive, the best time to invest in a relative strength-based strategy is when it is going through periods of underperformance. Every investment strategy has a pain point or market environment in which it will struggle. The changing of the guard within the leadership trend of the market has been just that for relative strength. These periods of underperformance are never comfortable, but they are a necessary part of the process. The lagging names within the model are culled to make room for the next emerging trends in the market. Investing in the strategy as it refocuses can provide exposure to the new leadership as it picks up steam.
Disclosures:
The performance numbers on this page are price returns unless otherwise indicated, not inclusive of all transaction costs. Neither the returns for the models nor the model benchmarks reflect the reinvestment of dividends.
This article is intended only for financial professional use only. Not Intended for retail investors.
Click here for more information from Invesco on the First Trust Dorsey Wright Focus 5 ETF (FV): https://www.ftportfolios.com/retail/etf/etfsummary.aspx?Ticker=FV
Dorsey, Wright & Associates, LLC is owned by Nasdaq, Inc. and we have affiliates who also provide financial services, research, information, and act as Broker/Dealers to a wide variety of clients. Our affiliates use information we create to create indexes, which are then used to create Exchange Traded Funds. These things create a potential conflict of interest in that we may have an incentive to promote or use the products and services of our affiliates and business partners. A number of Dorsey Wright representatives are registered with and hold securities licenses with the affiliate broker dealers. In this capacity, they assist with marketing and distribution of Exchange Traded Products.
While we make every effort to be free of errors in this report, it contains data obtained from other sources. We believe these sources to be reliable, but we cannot guarantee their accuracy. Officers or employees of this firm may now or in the future have a position in the stocks mentioned in this report. Dorsey, Wright is a Registered Investment Advisor with the U.S. Securities & Exchange Commission. Copies of Form ADV Part II are available upon request.
