Most Requested Symbols

Earnings continue this week, with several magnificent seven names reporting. We discuss their technical pictures ahead of results.
Investors have drawn parallels between the current market and the dotcom bubble, especially as valuations reach all-time extremes. Today, we look at how the market has done in other “overvalued” environments.
Weekly Rundown Video – Oct 22, 2025
Weekly rundown with NDW analyst team covering all major asset classes.
Weekly rundown with NDW analyst team covering all major asset classes.
Earnings offer a peak behind the curtain- an opportunity to blend together fundamentals with technicals as markets get a look at how a company did over the previous quarter and project out guidance over the upcoming quarter/year. Of course, one bad quarter won’t make a firm unsuitable for investment (and vice versa…) but earnings can bring large price movements in either direction… movements which could impact our technical opinion on the name. Big banks recently started up earnings season, with several big names slipping alongside the broad sector despite strong results. This week ushers in several household names, names that your clients undoubtedly have exposure to within the equity sleeve of your portfolio. Alongside several magnificent seven names, the likes of UnitedHealth UNH, Visa V, Caterpillar CAT, Eli Lily LLY, Exxon XOM, and AbbVie ABBV report. Today’s Pulse will detail a handful of interesting technical pictures, highlighting levels of support and resistance you should keep in mind as firms unveil their results.
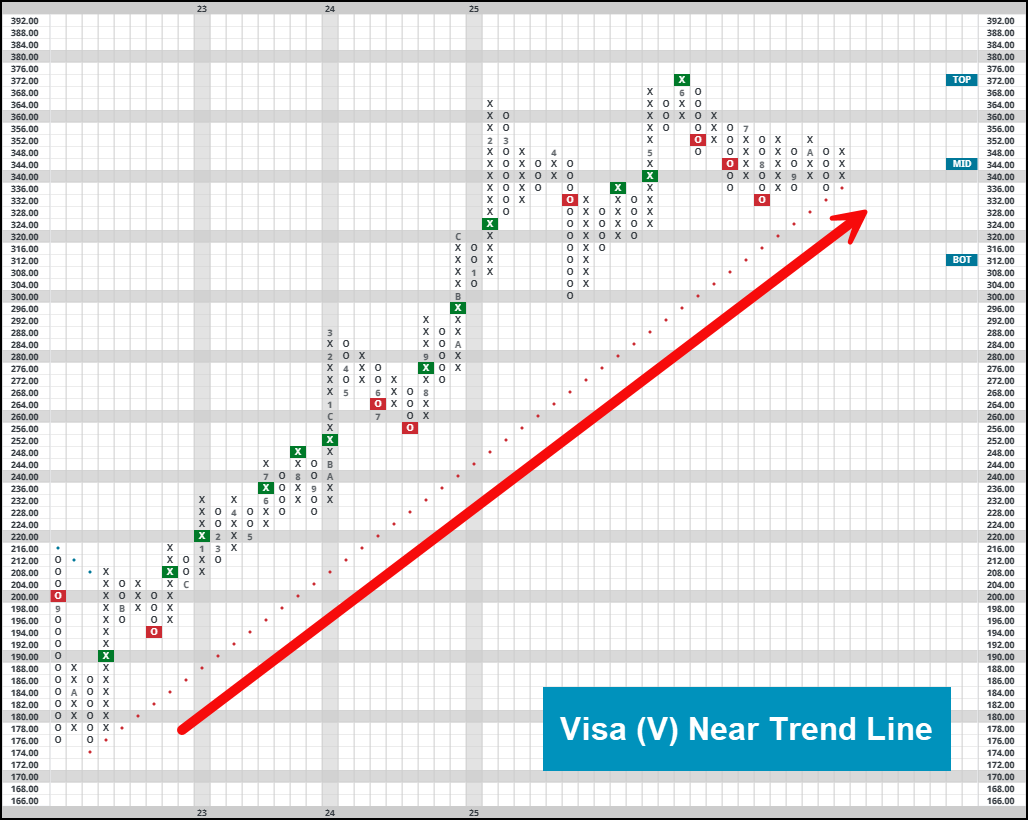
Tuesday 10/28: Visa V
Visa remains a 5/5’er as we close out October. Despite this, the near-term picture has showed some signs of weakness, seeing the stock post a string of three consecutive sell signals on its default chart. This presents quite an interesting picture, as the retreat off of all-time highs leaves the technical leader with several layers of resistance between $352 and the top of the trading band at $372. Towards the downside, we will watch the bullish support line in the $330’s as a likely landing spot on less than stellar results.
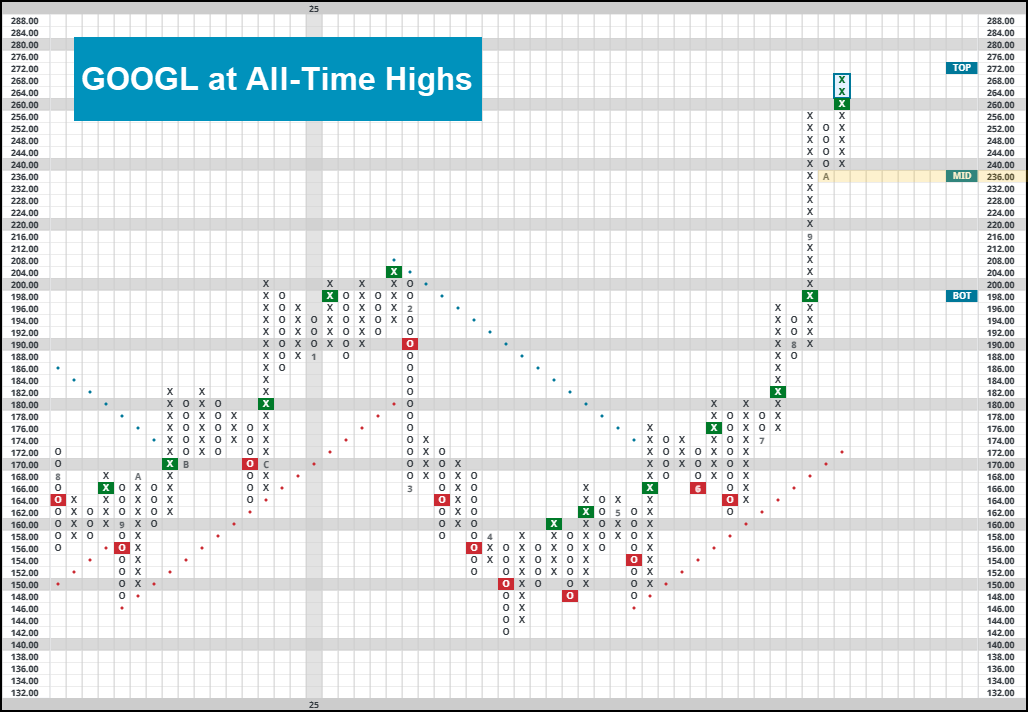
Wednesday 10/29: Alphabet Inc. (GOOGL, GOOG)
After starting out 2025 with less than stellar performance, our first magnificent-seven member to report has rocketed to new all-time highs. The stock earns a perfect technical rating ahead of its earnings report, having posted a string of buy signals on its default chart. In terms of localized support, we will watch the middle of the trading band at $236 as a landing spot on poor results. We are a touch overbought here as we trade at all-time highs, so an upside target is difficult to identify. Regardless, keep in mind that strong assets can continue to trade in an overbought position, so a strong reaction to earnings could send us well above the top of the trading band at $272.
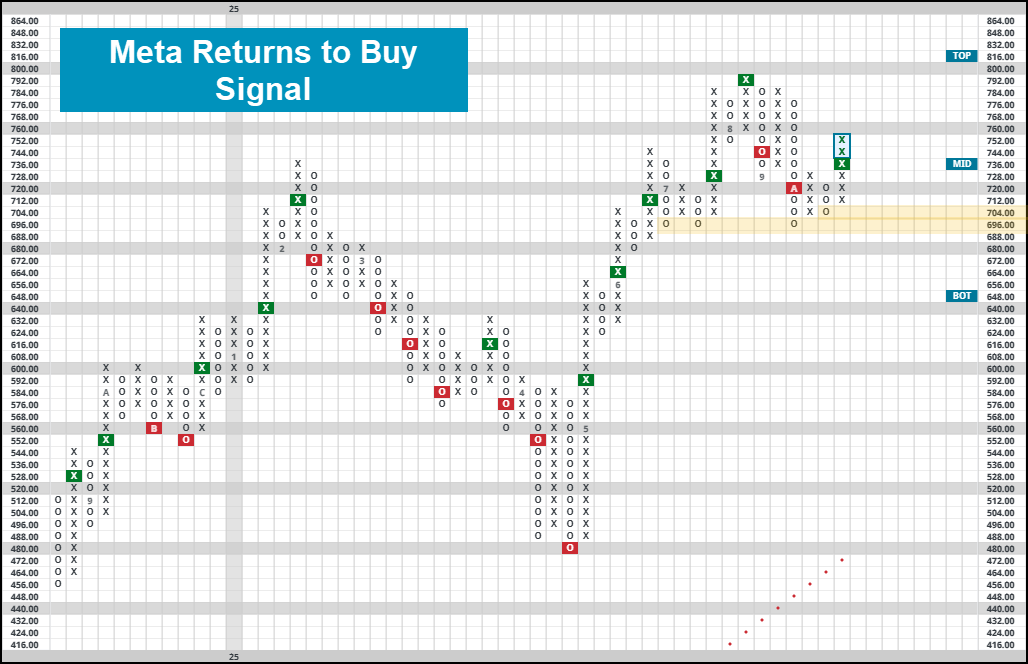
Wednesday 10/29: META Platforms (META)
Like other large names across the market, META has consolidated at/around all time highs on its chart. Despite this, the stock remains a strong 5/5’er ahead of its report mid-week, most recently returning to a buy signal at $736. This coincided with the name moving back above its 50-day moving average, now sitting without resistance until all-time chart highs around $784-$792. It isn’t overbought here, so those looking to add exposure to the name before earnings could do so here. Keep in mind, there is a range of support (as well as old resistance) around $700, which will be our downside mark in the event of a negative reaction.
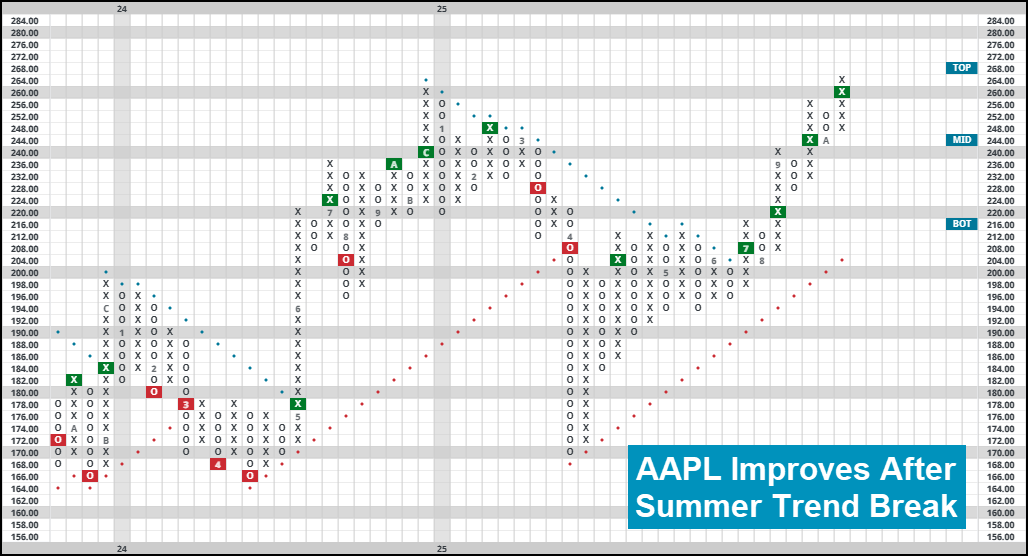
Thursday 10/30: Apple (AAPL)
Amazon (AMZN) and Apple AAPL both report on Thursday. Both present quite an interesting technical picture. Similarly to Google, AAPL started off the year on a weak foot but has improved quite notably throughout the back half of the year. The 4/5’er sits on a string of 5 consecutive buy signals, moving notably quicker after breaking back into a positive trend in July. In terms of notable support, we will watch the middle of the trading band at $244. We currently sit at all-time chart highs. The top of the trading band is nearby at $268.

AI has been one of the largest drivers of recent market gains, and the rapid rise of stocks has raised concerns of a dotcom-esque bubble for the market. Amazon (AMZN), Alphabet (GOOG/GOOGL), Meta Platform (META), and Microsoft (MSFT) are estimated to combine for more than $400 billion in capital expenditures next year, most of which will be dedicated to AI infrastructure. For reference, that’s the equivalent of 1.3% of the current US GDP. Given the dependence of both the economy and the market on AI’s success, should we approach the market with caution given potential AI-driven overvaluation?
The Bear Case
One sign of danger for the market is the Shiller cyclically adjusted price-to-earnings ratio (CAPE), which looks at the price of the S&P 500 (SPX) relative to its inflation adjusted earnings over the last ten years. CAPE is a gold standard valuation indicator, signaling danger before the 2000s crash, 2008 recession, and 2022 bear market. The metric has made headlines lately with it nearing all-time euphoric levels above 35, which had previously only been matched prior to the dotcom crash and 2022 bear market.
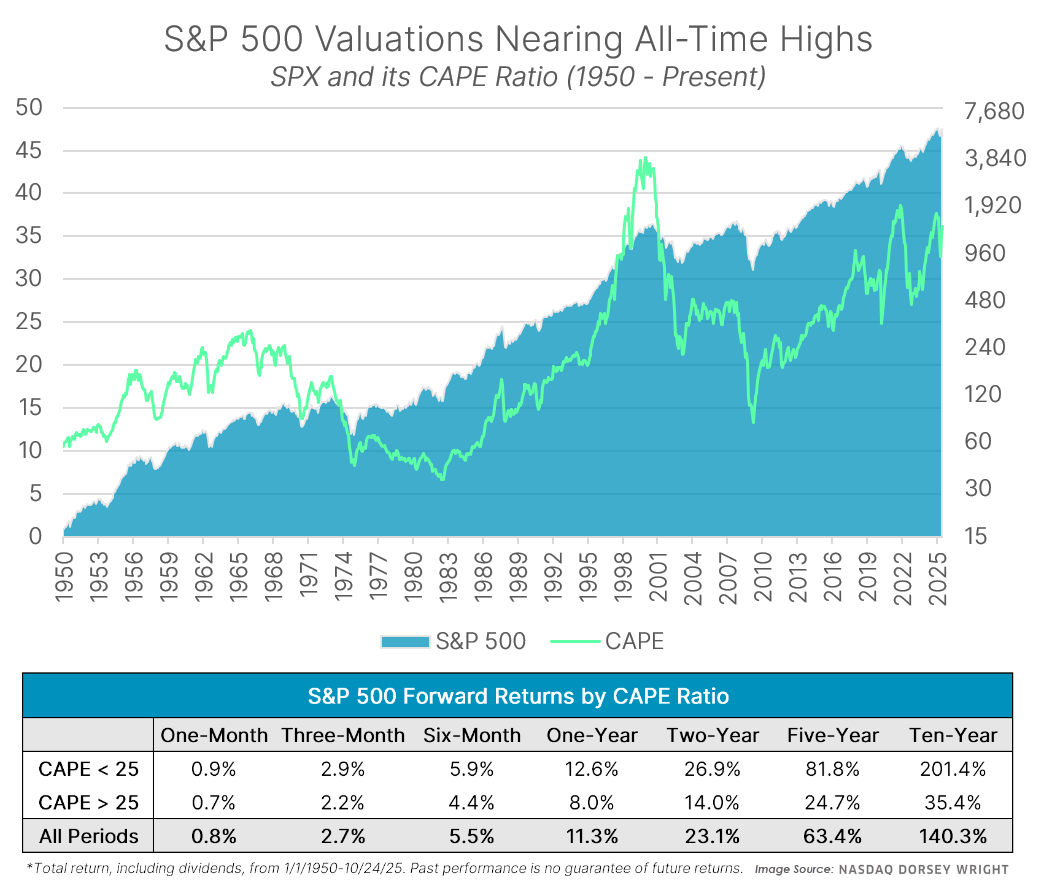
The success of CAPE is unquestionably strong across longer horizons, as the 35.4% ten-year return at high valuations pales in comparison to the 201.4% return for periods with a CAPE under 25. While the indicator is not intended to serve as guide in the near-term, the S&P 500 still performed almost a full percent worse in overvalued territory over the next three months as well. Given the elevated valuation of the market due to AI, expectations for the performance should potentially be dampened, especially across the next decade. However, there are reasons to believe that we aren’t in immediate danger.
The Bull Case
The biggest argument in favor of this bull market is that the advanced AI models transform the economy and world as we know it, seeing all the massive capital expenditures pay off. However, even assuming “this time isn’t different,” there’s still reason for optimism in the short-term. While CAPE has been good signal of if there will be an eventual slowdown, it’s done a poor job of predicting when it will happen, as there’s no level at which we can reliably say a downturn is coming.
Leading up to the great recession, CAPE peaked at 27.55 in May 2007 and bottomed out at 13.3 in March 2009. Meanwhile, the dotcom bubble reached a CAPE above 25 at the end of 1995, with the S&P 500 rising another 155% before peaking at 44.2 at the end of 1999. In June of 2014, the S&P 500 reached CAPE levels above 25 only seen before the dotcom bubble and the great recession. In the following year, Robert Shiller—the creator of the ratio—said, “the CAPE ratio serves as a warning signal... I think this is a risky time,” adding he had reduced his exposure to US stocks. And to his credit, the best ten-year return when the CAPE was above 25 at that point was 130%, which was well below the 180% average return in periods below 25. However, the CAPE ratio has stayed above 24 for the entirety of the last decade while domestic equities have dominated. From the end of June 2014, the S&P 500 gained 321% on a total return basis, demonstrating strong long-term returns are possible even at high valuations.
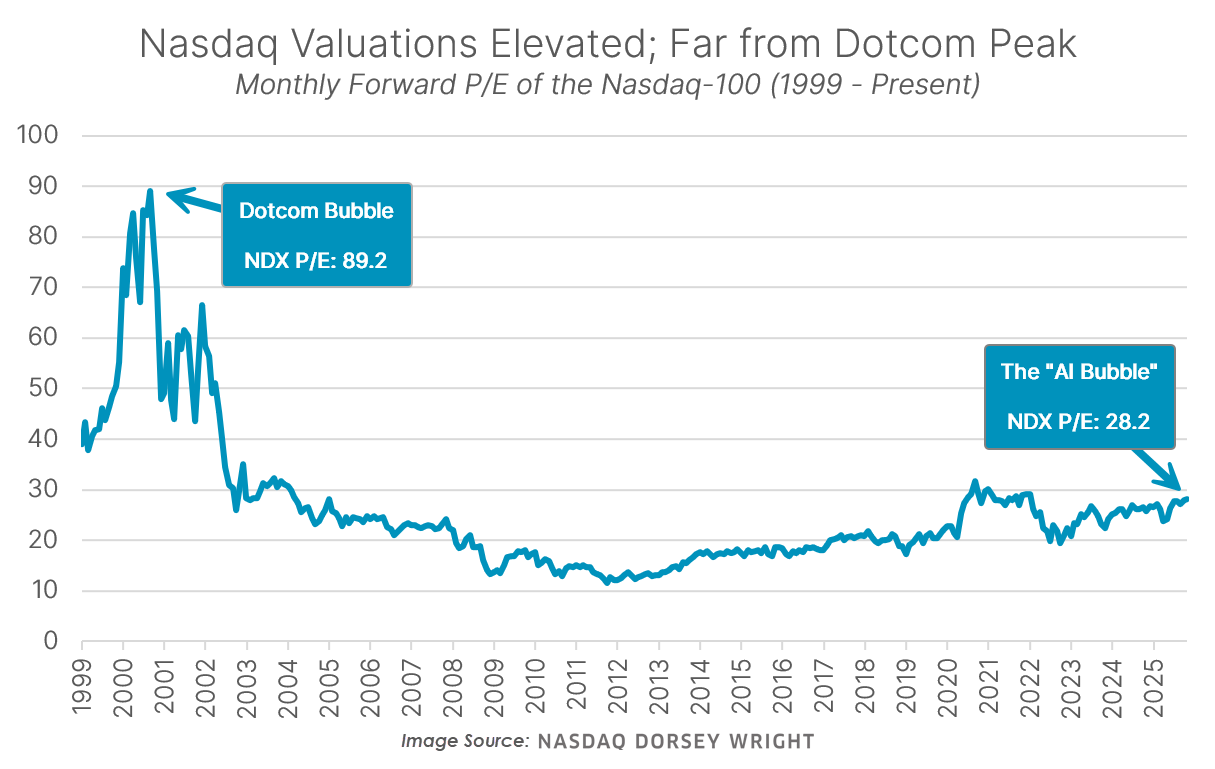
There’s only been so many market environments, meaning we should take any “foolproof” indicators with a grain of salt. The inversion of the yield curve had forecasted every recession since 1970... until it predicted a recession that never manifested in 2022. Meanwhile, the earnings outlook for companies continues to be strong, with the growth areas of the market sitting in much more reasonable territory than previous highs. At the peak of the dotcom bubble, the Nasdaq-100 (NDX) traded at a forward P/E multiple of 89.2. Today, that number stands at a more reasonable—albeit, still elevated—28.2, meaning NDX would need to rise 217% overnight to reach the euphoric valuations of the dotcom era.
Combining Fundamentals with Technicals
There is decent a chance a bear market occurs in the next few years, but that possibility is present in all market environments, not just this one. Thankfully, weakness usually doesn’t come out of nowhere, with the market’s momentum often slowing down before things turn for the worse. One way to gauge the strength of the market is through our fund scores, which assign a 0 to 6 score based on a security’s relative strength. Using the fund score for the iShares S&P 500 Index (IVV), we can see how early fund scores flashed red for the S&P 500 before the market’s biggest declines since 1992. A fund score below 3 for IVV means that the market is relatively weak while fund scores above 3 signal solid positioning.
Leading up to the dotcom bubble, IVV held a fund score above three at the end of each month from 1995 until weakening in October of 2001. Coming up on the great recession, IVV moved below a fund score of 3 in June 2007, hinting at weakness before all the major decline. Meanwhile, the S&P 500 weakened by January of 2022, frontrunning the downside during the rest of the year.

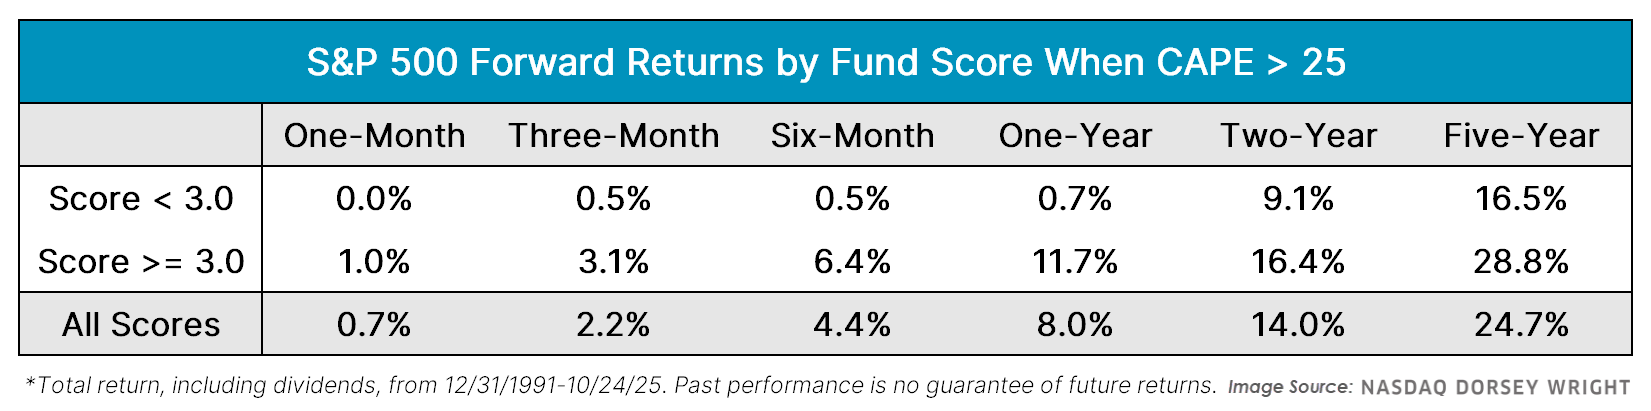
Broadly speaking, momentum has been a good indicator of how the market will perform in high valuation environments. During months where the S&P 500 is “overvalued” with a CAPE above 25 and holding a fund score below 3, it’s performed poorly with a 0.8% one-year return. Meanwhile, the market averaged a healthy one-year return of 11.7% in those same high valuation environments when scoring above 3. As a result, the momentum of the market is often a better indication of movement in the near future compared to valuations.
Conclusion
Overvaluation and excessive capital expenditure present a real risk for the market, especially if AI has less impact than anticipated, as earnings will likely need to catch up with valuations at some point. That said, even though valuations are a better determinant of outlook in the long run, it can often take significant lengths of time to achieve that long-term state. As economist John Maynard Keynes put it, “in the long run we’re all dead,” highlighting the limitations of long-term approaches when making decisions for present situations. An overbought market can always get more overbought, and history has shown that momentum is more effective than valuations at making timely decisions and identifying inflection points. With IVV holding a strong fund score of 5.20 and the S&P 500 showing little signs of slowing down, domestic equities can continue being a point of emphasis, but future signs of deterioration would be more significant given a potentially weaker long-term outlook.
Average Level
40.80
| < - -100 | -100 - -80 | -80 - -60 | -60 - -40 | -40 - -20 | -20 - 0 | 0 - 20 | 20 - 40 | 40 - 60 | 60 - 80 | 80 - 100 | 100 - > |
|---|---|---|---|---|---|---|---|---|---|---|---|
|
Buy signalief
|
|||||||||||
|
Buy signalijr
|
Buy signalVOOG
|
||||||||||
|
Buy signalrsp
|
Buy signaldia
|
||||||||||
|
Sell signaldx/y
|
Buy signalVOOV
|
||||||||||
|
Buy signalgsg
|
Buy signallqd
|
||||||||||
|
Sell signalicf
|
Buy signalagg
|
Buy signalXLG
|
|||||||||
|
Buy signalIJH
|
Buy signalefa
|
Buy signalgcc
|
Buy signalONEQ
|
||||||||
|
Buy signalfxe
|
Buy signaldvy
|
Buy signaliwm
|
Buy signalSPY
|
Buy signalQQQ
|
|||||||
|
Sell signalUSO
|
Buy signalhyg
|
Buy signalshy
|
Buy signaltlt
|
Buy signalEEM
|
Buy signalGLD
|
||||||
| < - -100 | -100 - -80 | -80 - -60 | -60 - -40 | -40 - -20 | -20 - 0 | 0 - 20 | 20 - 40 | 40 - 60 | 60 - 80 | 80 - 100 | 100 - > |
| AGG | iShares US Core Bond ETF |
| USO | United States Oil Fund |
| DIA | SPDR Dow Jones Industrial Average ETF |
| DVY | iShares Dow Jones Select Dividend Index ETF |
| DX/Y | NYCE U.S.Dollar Index Spot |
| EFA | iShares MSCI EAFE ETF |
| FXE | Invesco CurrencyShares Euro Trust |
| GLD | SPDR Gold Trust |
| GSG | iShares S&P GSCI Commodity-Indexed Trust |
| HYG | iShares iBoxx $ High Yield Corporate Bond ETF |
| ICF | iShares Cohen & Steers Realty ETF |
| IEF | iShares Barclays 7-10 Yr. Tres. Bond ETF |
| LQD | iShares iBoxx $ Investment Grade Corp. Bond ETF |
| IJH | iShares S&P 400 MidCap Index Fund |
| ONEQ | Fidelity Nasdaq Composite Index Track |
| QQQ | Invesco QQQ Trust |
| RSP | Invesco S&P 500 Equal Weight ETF |
| IWM | iShares Russell 2000 Index ETF |
| SHY | iShares Barclays 1-3 Year Tres. Bond ETF |
| IJR | iShares S&P 600 SmallCap Index Fund |
| SPY | SPDR S&P 500 Index ETF Trust |
| TLT | iShares Barclays 20+ Year Treasury Bond ETF |
| GCC | WisdomTree Continuous Commodity Index Fund |
| VOOG | Vanguard S&P 500 Growth ETF |
| VOOV | Vanguard S&P 500 Value ETF |
| EEM | iShares MSCI Emerging Markets ETF |
| XLG | Invesco S&P 500 Top 50 ETF |

| Symbol | Company | Sector | Current Price | Action Price | Target | Stop | Notes |
|---|---|---|---|---|---|---|---|
| BN | Brookfield Corp. | Wall Street | $46.19 | mid-to-hi 60s | 62.50 | 41 | Due to a stock split, we will adjust our stop to $41, which would take out multiple levels of support on BN's $0.50 chart. Earn. 11/13 |
| AYI | Acuity Inc. | Building | $368.27 | 340s - 350s | 456 | 296 | 4 for 5'er, top half of BUIL sector matrix, triple top, buy on pullback, R-R~2.0 |
| JOYY | JOYY Inc. | Internet | $59.81 | mid-to-hi 50s | 88 | 48 | 5 for 5'er, top third of favored INET sector matrix, spread triple top, buy on pullback, R-R~4.0, 4.9% yield |
| SNOW | Snowflake, Inc. Class A | Software | $257.94 | low $230s to low $250s | 358 | 212 | 4 for 5'er, pos. trend and mkt RS buy signal since May; pulling back from rally high; top quintile of software matrix. |
| IBKR | Interactive Brokers Group, Inc. | Wall Street | $68.75 | mid-to-hi 60s | 79 | 59 | 5 for 5'er, #2 of 62 in favored WALL sector matrix, LT pos mkt & peer RS, buy on pullback |
| TPR | Tapestry Inc. | Textiles/Apparel | $114.71 | 110s | 163 | 92 | 5 for 5'er, #1 of 22 in favored TEXT sector matrix, LT pos mkt & peer RS, triple top, R-R~2.0, Earn. 11/6 |
| DCI | Donaldson Co Inc | Waste Management | $83.25 | 80 - 84 | 92 | 67 | 3/5'er; top 3rd of sector matrix; ATHs 10/21; R-R > 2. |
| TXRH | Texas Roadhouse, Inc. | Restaurants | $175.54 | hi 160s - hi 170s | 226 | 148 | 4 for 5'er, top half of REST sector matrix, LT pos peer & mkt RS, bearish signal reversal, Earn. 11/6 |
| CMI | Cummins Inc. | Machinery and Tools | $421.45 | hi 390s - 430s | 492 | 352 | 5 TA rating, top 33% of MACH sector, consec buy signals, buy-on-pullback, Earn. 11/6 |
| SF | Stifel Financial Corp | Wall Street | $117.94 | 110s | 140 | 92 | 4 for 5'er, top half of WALL sector matrix, LT pos peer & mkt RS, quad top break, 1.6% yield |
| CMC | Commercial Metals Corporation | Steel/Iron | $61.08 | hi 50s - low 60s | 79 | 49 | 4 for 5'er, favored STEE sector matrix, LT pos peer & mkt RS, pos trend flip, 1.2% yield |
| Symbol | Company | Sector | Current Price | Action Price | Target | Stop | Notes |
|---|
| Symbol | Company | Sector | Current Price | Action Price | Target | Stop | Notes |
|---|---|---|---|---|---|---|---|
| ATMU | Atmus Filtration Technologies, Inc. | Transports/Non Air | $45.83 | 42 - 45 | 54 | 36 | Removed for earnings. Raise stop to $40. Earn. 11/7 |
| Comment | |||||||
|---|---|---|---|---|---|---|---|
|
|
|||||||
CMC Commercial Metals Corporation R ($60.74) - Steel/Iron - CMC is a 4 for 5'er that ranks near the middle of the favored steel/iron sector matrix and has been on peer and market RS buy signals since 2013 and 2020, respectively. After briefly falling to a sell signal and a negative trend, CMC rallied, returning to a buy signal and breaking through its bearish resistance line last week when it broke a double top at $62. Long exposure may be added in the upper $50s to low $60s and we will set our initial stop at $49, which would take out two levels of support on CMC's chart. We will use the bullish price objective, $79, as our target price. CMC also carries a 1.2% yield.
| 62.00 | • | X | 62.00 | ||||||||||||||||||||||||||
| 61.00 | X | • | X | 61.00 | |||||||||||||||||||||||||
| 60.00 | X | X | X | O | X | 60.00 | |||||||||||||||||||||||
| 59.00 | X | X | O | A | O | X | O | X | 59.00 | ||||||||||||||||||||
| 58.00 | X | O | X | O | X | O | X | O | X | Mid | 58.00 | ||||||||||||||||||
| 57.00 | X | O | X | O | X | O | O | X | 57.00 | ||||||||||||||||||||
| 56.00 | • | X | 9 | O | • | O | X | 56.00 | |||||||||||||||||||||
| 55.00 | • | X | • | O | X | 55.00 | |||||||||||||||||||||||
| 54.00 | • | X | X | • | O | • | 54.00 | ||||||||||||||||||||||
| 53.00 | • | X | O | X | • | • | 53.00 | ||||||||||||||||||||||
| 52.00 | • | X | O | X | • | 52.00 | |||||||||||||||||||||||
| 51.00 | • | X | X | 7 | O | X | • | 51.00 | |||||||||||||||||||||
| 50.00 | • | • | • | X | O | X | O | X | 8 | • | 50.00 | ||||||||||||||||||
| 49.00 | X | X | • | X | • | 6 | O | X | O | X | • | 49.00 | |||||||||||||||||
| 48.00 | X | O | X | O | X | O | X | O | O | • | Bot | 48.00 | |||||||||||||||||
| 47.00 | X | O | X | O | X | O | X | • | 47.00 | ||||||||||||||||||||
| 46.00 | O | X | O | 5 | O | O | • | 46.00 | |||||||||||||||||||||
| 45.00 | O | X | O | X | X | • | 45.00 | ||||||||||||||||||||||
| 44.00 | O | X | 4 | X | O | X | • | 44.00 | |||||||||||||||||||||
| 43.00 | O | O | X | O | X | • | 43.00 | ||||||||||||||||||||||
| 42.00 | O | X | X | O | X | • | 42.00 | ||||||||||||||||||||||
| 41.00 | O | X | O | X | O | X | • | 41.00 | |||||||||||||||||||||
| 40.00 | O | X | O | X | O | • | 40.00 | ||||||||||||||||||||||
| 39.00 | O | X | O | • | • | 39.00 | |||||||||||||||||||||||
| 38.00 | O | • | • | 38.00 |
| DELL Dell Technologies Inc Class C ($161.12) - Computers - DELL pushed higher Monday to break a double top at $160, returning the stock to a buy signal. This 4 for 5'er moved to a positive trend in April and sits in the top quartile of the favored computers sector RS matrix. The technical picture is favorable and improving. Initial support can be seen at $146 and $142. |
| DOW Dow, Inc. ($25.85) - Chemicals - DOW returned to a buy signal Monday when it broke a double top at $26. The technical picture for the stock remains decidedly negative, however, as DOW is a 0 for 5'er that ranks in the bottom quintile of the chemicals sector matrix. From here, overhead resistance sits at $30, meanwhile support can be found at $21. |
| DQ Daqo New Energy Corp. ($29.60) - Chemicals - DQ returned to a buy signal Monday when it broke a double top at $29. Monday's move adds to a positive technical picture as DQ is a 4 for 5'er that ranks in the top quartile of the chemicals sector matrix. From here, overhead resistance sits at $31, DQ's all-time high. Meanwhile, support can be found at $24. |
| FIVE Five Below Inc ($160.75) - Retailing - FIVE broke a double top at $160 for a second buy signal as shares rallied to $168. The stock is a 5 for 5'er that ranks within the top quintile of the Retailing sector matrix. Okay to consider here on the breakout or on a pullback towward the middle of the 10-week trading band. Initial support lies at $152, while additional may be found at $138. |
| GOLF Acushnet Holdings Corp ($81.94) - Leisure - GOLF broke a triple top at $83 for a second buy signal. The stock is a 5 for 5'er that ranks in the top half of the Leisure sector matrix and is accompanied by a yield north of 1%. Okay to consider here on the breakout or on a pullback to $80. Note the stock's prior high at $84 from July this year. Initial support lies at $78, while additional can be found in the mid $70s. |
| LW Lamb Weston Holdings Inc ($66.31) - Food Beverages/Soap - Shares of LW broke a double top at $67 for its second consecutive buy signal. The stock returned to a positive trend earlier this month, bringing it back to acceptable territory as a 3 for 5’er. However, the stock still lacks long-term relative strength, keeping it as a hold for now. From here, resistance lies at $68 then $83. |
| PANW Palo Alto Networks Inc ($219.56) - Software - PANW pushed higher to break a double top at $220, notching a fourth consecutive buy signal and a new all-time high. This 4 for 5'er moved to a positive trend in September and sits in the top quartile of the favored software sector RS matrix. The weight of the technical evidence is strong and continues to improve. Initial support can be seen at $204 and $198. Earnings are expected on 11/20. |
| QCOM QUALCOMM Incorporated ($187.27) - Semiconductors - QCOM shot higher Monday, breaking a double top at $176 before reaching $204 intraday. This moves the stock close to reversing up into a column of Xs against the market, which would improve it to a 3 for 5 TA rating. Keep an eye on further improvement. While the technical picture is improving, the stock is now extended. Initial support can be seen at $154. Earnings are expected on 11/5. |
| RGLD Royal Gold Inc ($178.56) - Precious Metals - RGLD gave a second consecutive sell signal and fell to a negative trend on Monday. The negative trend change will drop the stock to an unfavorable 2 for 5'er. From here, the next level of support on RGLD's chart sits at $168. Earnings are expected on 11/5. |
| SYY Sysco Corporation ($77.24) - Food Beverages/Soap - Shares of SYY broke a double bottom at $77 for its second consecutive sell signal. Today also saw the stock flip its trend back to negative, bringing it down to a 1 for 5’er. The stock remains one to avoid given its lack of relative strength but could move on earnings tomorrow. From here, support lies at $76 then $71. |
| TSLA Tesla Inc. ($459.46) - Autos and Parts - TSLA broke a triple top at $456 to return to a buy signal. The stock is a 5 for 5'er that ranks 2nd (out of 53) in the Autos and Parts setor matrix. Okay to consider here on the breakout. Nore prior rallies highs at $464. Initial support lies at $416, while prior resistance in the $360 range range may be seen as long-term support. |
| USFD US Foods Holding Corp. ($74.03) - Food Beverages/Soap - Shares of USFD moved lower Monday for its fourth consecutive sell signal. The 5 for 5’er continues to trade in a positive trend while maintaining its peer and market relative strength for now, making it one to keep owning for the time being. From here, previous resistance in the low $70s could serve as future bounce points with the bullish support line next at $67. |

| Name | Option Symbol | Action | Stop Loss |
|---|---|---|---|
| Bank of America - $52.96 | O: 26A52.50D16 | Buy the January 52.50 calls at 3.05 | 48.00 |
| Name | Option | Action |
|---|---|---|
| Cardinal Health, Inc. ( CAH) | Dec. 155.00 Calls | Raise the option stop loss to 9.90 (CP: 11.90) |
| Citigroup, Inc. ( C) | Jan. 97.50 Calls | Initiate an option stop loss of 5.60 (CP: 7.60) |
| Name | Option Symbol | Action | Stop Loss |
|---|---|---|---|
| BJ's Wholesale Club Holdings Inc - $93.15 | O: 26M95.00D16 | Buy the January 95.00 puts at 6.60 | 102.00 |
| Name | Option | Action |
|---|---|---|
|
|
||
| Name | Option Sym. | Call to Sell | Call Price | Investment for 500 Shares | Annual Called Rtn. | Annual Static Rtn. | Downside Protection |
|---|---|---|---|---|---|---|---|
| Las Vegas Sands Corp. $ 57.60 | O: 26A60.00D16 | Jan. 60.00 | 3.25 | $ 28,312.50 | 22.14% | 20.89% | 4.43% |
| Name | Action |
|---|---|
| MARA Holdings Inc. ( MARA) - 19.54 | Sell the December 18.00 Calls. |
| SoFi Technologies Inc. ( SOFI) - 29.01 | Sell the November 27.00 Calls. |
| Arista Networks Inc ( ANET) - 153.82 | Sell the December 145.00 Calls. |
| JFrog Ltd. ( FROG) - 49.83 | Sell the December 50.00 Calls. |
| Palantir Technologies Inc. Class A ( PLTR) - 184.63 | Sell the January 185.00 Calls. |
| Cleveland-Cliffs Inc. ( CLF) - 13.13 | Sell the January 13.00 Calls. |
| Block Inc ( XYZ) - 79.54 | Sell the December 80.00 Calls. |
| Lyft Inc Class A ( LYFT) - 20.47 | Sell the January 22.00 Calls. |
| Shopify Inc ( SHOP) - 172.95 | Sell the January 165.00 Calls. |
| Sunrun Inc ( RUN) - 20.85 | Sell the January 21.00 Calls. |
| Carnival Corporation ( CCL) - 29.40 | Sell the December 29.00 Calls. |
| Johnson Controls International PLC ( JCI) - 112.94 | Sell the February 115.00 Calls. |
| Tesla Inc. ( TSLA) - 433.72 | Sell the February 450.00 Calls. |
| Hewlett Packard Enterprise Company ( HPE) - 23.50 | Sell the January 24.00 Calls. |
| Name | Covered Write |
|---|---|
|
|
|
Daily Equity & Market Analysis
LISTEN TO PODCAST
Feb 12, 2026
NDW MORNING UPDATE
Feb 13, 2026
Loading, Please Wait...
