Most Requested Symbols

With earnings season nearly wrapped up, we look at how the constituents of the Dow look to continue 2025
Navigating clients to their future goals is paramount as an advisor. Today, we provide analysis on what investors can expect depending on how long they invest.
August 6, 2025
Weekly rundown with NDW analyst team covering all major asset classes.
Weekly rundown with NDW analyst team covering all major asset classes.
With earnings season largely finished, now can be a good time to reevaluate positions within your portfolio to ensure they remain fit for investment/find replacement options for unactionable names. Positive results can confirm recent price movement, giving opportunities to exit technically weak names and add to technically strong ones. With that in mind, we will take today’s report as an opportunity to do a “Dow Dissection”, looking underneath the hood of .DJIA to diagnose the good, bad and ugly of the index as we travel through August. To start at a high level, we can utilize a 5% price matrix (dividends excluded) to create a relative strength matchup between constituents. The top half of those rankings is included below.

The Good: Traditional Financials, Some Technology
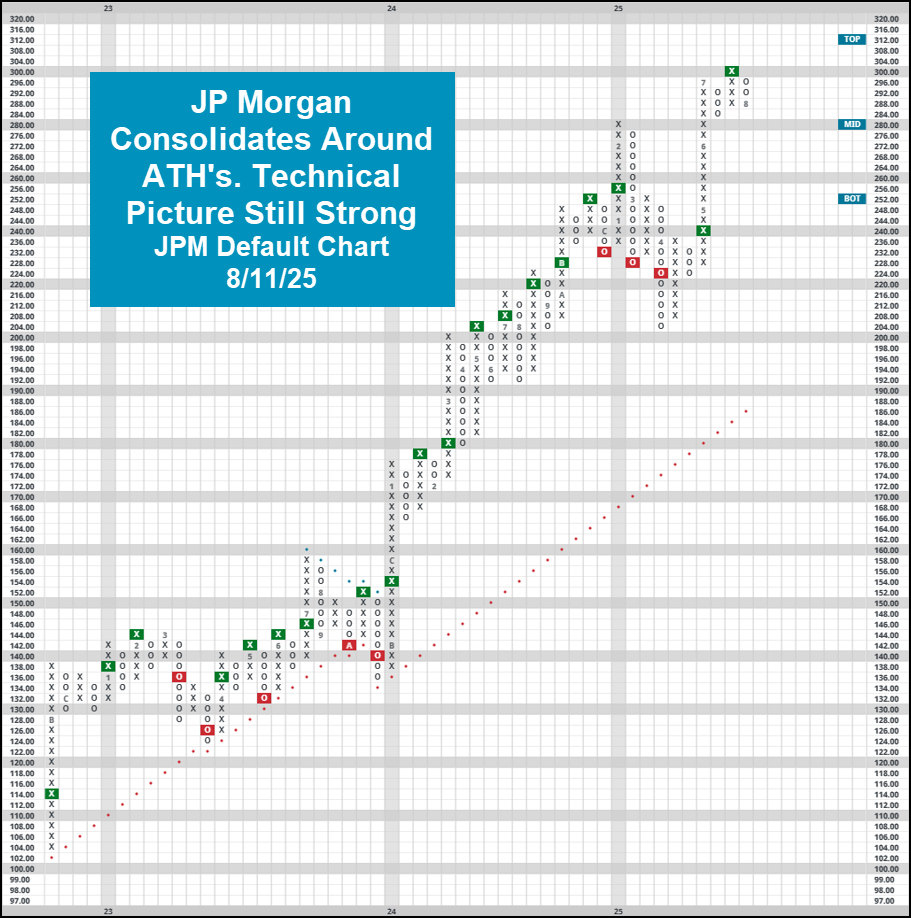
Financials have earned a spot within the top three of the DALI sector rankings since last May (in the top half since December 2023.) Lots of this strength has come from the larger names within the sector, names which kicked off earnings season earlier in July. Results were largely mixed as markets kept a watchful eye over net interest income... some names consolidated. JPM is a prime example as it has seemed to have run into some overhead resistance around those all time highs from later in July. Despite this, the name remains a strong 5/5’er with support just above the middle of its respective trading band. With that said, its current levels provide a strong entry point, assuming the name still passes your fundamental screens post earnings. Other strong technical pictures are seen from NVDA, GS, AXP, AMZN and a handful of representatives from the top of the matrix. Remember, building out a “complete” picture is most important, using both absolute and relative viewpoints to do so.
The Bad: Staples, Some Technology
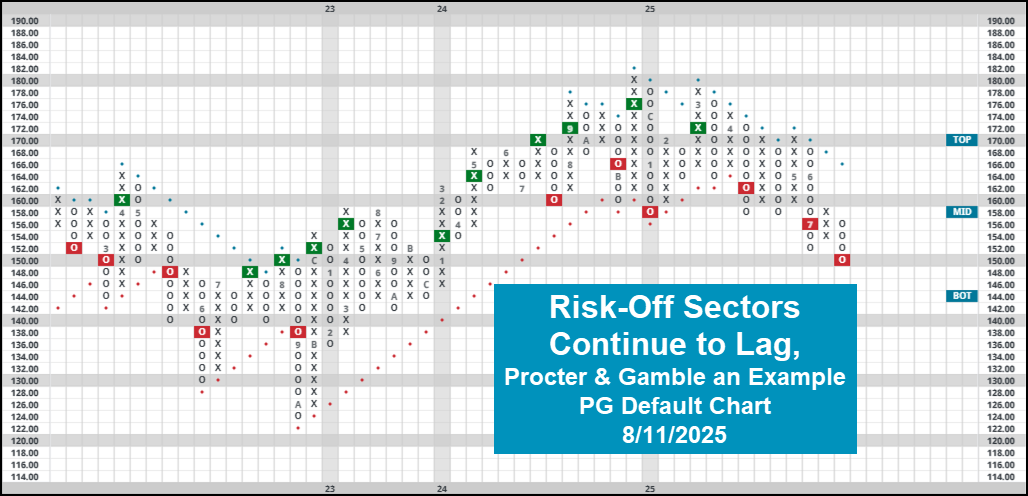
Risk-on areas of the market remain firmly in control of upside action as we move through the back half of the year. With that said, several points of relative weakness come from the consumer staples sector. The likes of Procter & Gamble (PG) & McDonald’s (MCD) are two main names that come to mind that saw notable downside action over the last month, suggesting those with exposure should remain on guard for bounces to trim/cut exposure. On the technology front, the sector continues to be largely narrow in its upside action. With that said, there are a handful of names within the sector that present poor technical posturing at the time of this writing. Salesforce CRM has been ushered lower by its negative trend line and remains a point to avoid within the Dow.
The Ugly: UnitedHealth Group (UNH)
It may come as no surprise that UNH remains at the bottom of the Dow matrix after the stock has shed roughly 50% this year. The 0/5’er is in a class of its own, not earning a single buy signal (or column of X’s for that matter) at the time of this writing. Holders should continue to trim, and near-term traders should look elsewhere when identifying opportunities.


During times of volatility, being able to hold clients’ hands is one of the most crucial aspects of being an advisor. Everyone loves to make money, but nobody likes the risks associated with it. This year has been no stranger to sharp movement, with the S&P 500 (SPX) falling as much as 11.5% just in the week following liberation day. That one-week move was worse than 99.8% of weeks, placing us in highly abnormal territory that caused panic among many investors. In these situations, it’s important that clients don’t lose sight of the bigger picture. Despite the market uncertainty at that time, the dip may not have meaningfully changed many clients' ability to meet future goals. Uncertainty is inherent in investing, but by understanding the range of possible outcomes, we can do a better job navigating investors through that uncertainty.
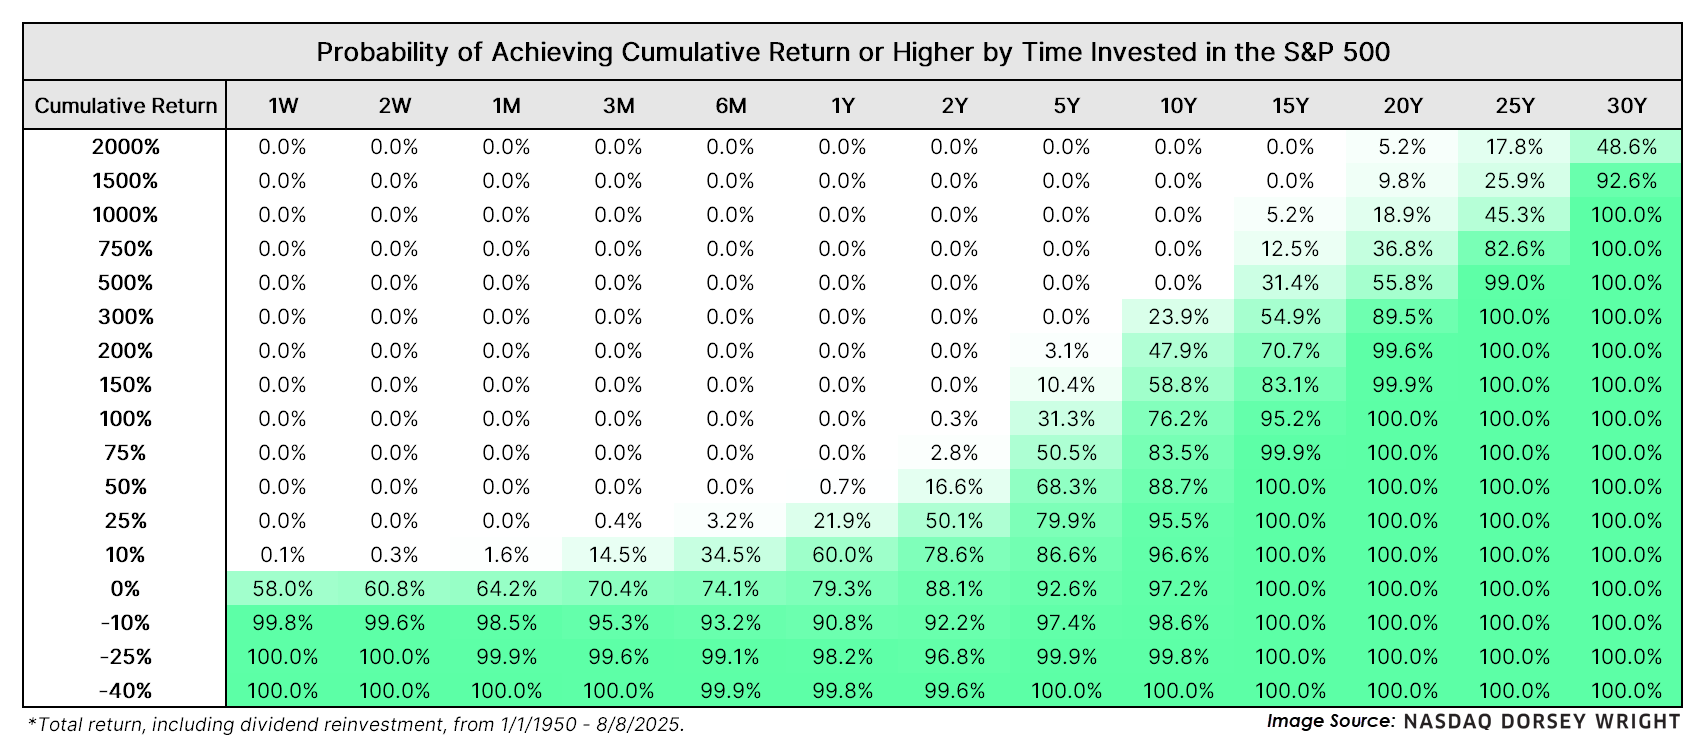
While history may not repeat itself, it often rhymes, which means it can serve as a guide during times of uncertainty. To help contextualize what to expect, we looked at the total return of the S&P 500 since 1950 depending on an investor’s time horizon. Oftentimes, investors have a target return needed by a certain point. The table below shows the probability of exceeding a return objective depending on the amount of time invested in the S&P 500. For example, an investor can expect a 75% chance of doubling their money or more after 10 years while there is a 97% chance that the S&P 500 is positive. Looking further out, there would be a 100% historical chance that an investor would at least double their money over a 20 year span.
To further contextualize things, the second table below gives the range of returns one can expect at different time horizons. Time in the market is by far the most important factor for performance given the increase in potential upside and decrease in downside after the first two years. The potential for upside over long horizons is magnified by the compounding of returns. Holding the market averaged a median 10-year gain of 186% while those able to hold on for 30 years saw a median gain ten times that of 1985%.

Another benefit of the longer horizon is the reduction in downside. Investors who bought the S&P 500 for any 5-year period since 1950 would have seen a maximum loss of -34.8%. Meanwhile, the minimum return for 15-year investors was positive 66%, highlighting the luxury that time offers. The cyclical nature of the market means that periods of downturn are more likely to be followed by bull markets, and vice versa. Those fluctuations cancel out enough to narrow the spread of returns over time.

The narrowing of outcomes can be visualized by looking at the S&P 500’s range of annualized returns depending on the time horizon. Over short periods, the range of annualized returns is extremely large, with the difference between the 90th and 10th percentile one-year returns being 42.5%. Meanwhile, 30-year periods only have a 2.9% difference in annualized returns between the 90th and 10th percentile outcomes. In general, the more time one spends invested in the market, the less their portfolio will deviate from expectations. Similar to the previous tables, the 15-year mark is when returns have historically always been positive, as the minimum annualized return was 3.43%. Some portfolio losses are an inevitability for investors, but time heals all for those able to hold on long enough.

One point to note is that every market environment is different, meaning that these ranges and probabilities may not always hold true. Prior to 2020, the S&P 500 had never lost more than 30% in a full month’s length, but those invested in early March 2020 were in for a rude awakening after losing 34% within a month. However, previous environments can at least give an indication as to whether investors are on track to meet their future financial goals. And when it comes to achieving financial goals, nothing is more valuable than the time spent invested.
Average Level
24.14
| < - -100 | -100 - -80 | -80 - -60 | -60 - -40 | -40 - -20 | -20 - 0 | 0 - 20 | 20 - 40 | 40 - 60 | 60 - 80 | 80 - 100 | 100 - > |
|---|---|---|---|---|---|---|---|---|---|---|---|
|
Buy signalgcc
|
|||||||||||
|
Buy signalIJH
|
|||||||||||
|
Buy signalfxe
|
|||||||||||
|
Buy signalijr
|
Sell signalGLD
|
||||||||||
|
Buy signalrsp
|
Buy signalefa
|
||||||||||
|
Buy signaliwm
|
Buy signalief
|
||||||||||
|
Buy signaltlt
|
Sell signaldvy
|
Buy signalSPY
|
|||||||||
|
Sell signalicf
|
Buy signalshy
|
Buy signalagg
|
Buy signalQQQ
|
||||||||
|
Sell signalUSO
|
Buy signalhyg
|
Buy signallqd
|
Buy signalVOOG
|
||||||||
|
Buy signalgsg
|
Sell signaldx/y
|
Buy signaldia
|
Buy signalVOOV
|
Buy signaleem
|
Buy signalONEQ
|
Buy signalXLG
|
|||||
| < - -100 | -100 - -80 | -80 - -60 | -60 - -40 | -40 - -20 | -20 - 0 | 0 - 20 | 20 - 40 | 40 - 60 | 60 - 80 | 80 - 100 | 100 - > |
| AGG | iShares US Core Bond ETF |
| USO | United States Oil Fund |
| DIA | SPDR Dow Jones Industrial Average ETF |
| DVY | iShares Dow Jones Select Dividend Index ETF |
| DX/Y | NYCE U.S.Dollar Index Spot |
| EFA | iShares MSCI EAFE ETF |
| FXE | Invesco CurrencyShares Euro Trust |
| GLD | SPDR Gold Trust |
| GSG | iShares S&P GSCI Commodity-Indexed Trust |
| HYG | iShares iBoxx $ High Yield Corporate Bond ETF |
| ICF | iShares Cohen & Steers Realty ETF |
| IEF | iShares Barclays 7-10 Yr. Tres. Bond ETF |
| LQD | iShares iBoxx $ Investment Grade Corp. Bond ETF |
| IJH | iShares S&P 400 MidCap Index Fund |
| ONEQ | Fidelity Nasdaq Composite Index Track |
| QQQ | Invesco QQQ Trust |
| RSP | Invesco S&P 500 Equal Weight ETF |
| IWM | iShares Russell 2000 Index ETF |
| SHY | iShares Barclays 1-3 Year Tres. Bond ETF |
| IJR | iShares S&P 600 SmallCap Index Fund |
| SPY | SPDR S&P 500 Index ETF Trust |
| TLT | iShares Barclays 20+ Year Treasury Bond ETF |
| GCC | WisdomTree Continuous Commodity Index Fund |
| VOOG | Vanguard S&P 500 Growth ETF |
| VOOV | Vanguard S&P 500 Value ETF |
| EEM | iShares MSCI Emerging Markets ETF |
| XLG | Invesco S&P 500 Top 50 ETF |

| Symbol | Company | Sector | Current Price | Action Price | Target | Stop | Notes |
|---|---|---|---|---|---|---|---|
| OLLI | Ollies Bargain Outlet Holding Inc. | Retailing | $135.10 | 120s | 150 | 102 | 5 for 5'er, top 25% of favored RETA sector matrix, LT pos mkt RS, buy on pullback, Earn. 8/28 |
| DRI | Darden Restaurants, Inc. | Restaurants | $202.00 | hi 190s - mid 210s | 262 | 178 | 5 TA rating, top 50% of REST sector matrix, LT RS buy, consec buy signals, buy-on-pullback |
| DG | Dollar General Corp. | Retailing | $116.32 | 100s to mid 110s | 133 | 86 | 4 TA rating, top 33% of RETA sector matrix, LT peer RS buy, consec buy signals, buy-on-pullback, Earn. 8/28 |
| BSX | Boston Scientific Corporation | Healthcare | $103.14 | 99 - 108 | 133 | 91 | 5 for 5'er, top 25% of HEAL sector matrix, LT pos mkt RS, spread triple top |
| TSCO | Tractor Supply Company | Retailing | $59.26 | upper 50s | 66 | 50 | 3 for 5'er, top half of favored RETA sector matrix, LT pos mkt RS, buy on pullback |
| HLT | Hilton Worldwide Holdings Inc | Leisure | $262.30 | 260s - low 280s | 364 | 216 | 5 TA rating, top 50% of LEIS sector matrix, LT RS buy, LT pos trend, consec buy signals, buy on pullback. |
| RPM | RPM, Inc. | Chemicals | $119.65 | 110 - 120 | 150 | 99 | 5 for 5'er, top half of favored CHEM sector matrix, LT pos mkt RS, bullish catapult, pos trend flip, 1.7% yield |
| VEEV | Veeva Systems Inc. | Healthcare | $282.13 | 274-lo 300s | 348 | 232 | 5 TA rating, top 10% of HEAL sector matrix, recent shakeout, buy-on-pullback, Earn. 8/27 |
| AMZN | Amazon.com Inc. | Retailing | $222.69 | 200s - low 210s | 240 | 178 | 4 for 5'er, top half of favored RETA sector matrix, LT pos peer & mkt RS, buy on pullback |
| SCHW | The Charles Schwab Corporation | Wall Street | $97.08 | lo-hi 90s | 120 | 76 | 5 TA rating, top 20% of WALL sector matrix, LT peer RS buy, consec buy signals, buy-on-pullback |
| WING | Wingstop Inc. | Restaurants | $315.36 | 320s - 340s | 432 | 280 | 5 for 5'er, #3 of 28 in REST sector matrix, LT pos mkt RS, buy on pullback |
| AXP | American Express Company | Finance | $297.43 | 288-lo 310s | 424 | 236 | 5 TA rating, top 20% of FINA sector matrix, LT RS buy, LT pos trend, consec buy signals, buy on pullback |
| PEG | Public Service Enterprise Group Inc. | Utilities/Electricity | $87.68 | mid 80s | 95 | 74 | 3 for 5'er, favored EUTI sector, spread quintuple top, buy on pullback, 2.9% yield |
| ABBV | AbbVie Inc. | Drugs | $198.05 | 190s - low 200s | 226 | 164 | 5 for 5'er, top third of DRUG sector matrix, LT pos peer & mkt RS, spread triple top, 3.3% yield |
| Symbol | Company | Sector | Current Price | Action Price | Target | Stop | Notes |
|---|
| Comment | |||||||
|---|---|---|---|---|---|---|---|
|
|
|||||||
ABBV AbbVie Inc. R ($197.85) - Drugs - ABBV is a 5 for 5'er that ranks in the top third of the drugs sector matrix and has been on peer and market RS buy signals since 2020 and 2022, respectively. On its default chart, ABBV gave a third consecutive buy signal last week when it broke a spread triple top at $200, taking out resistance that had been in place since May. Long exposure may be added in the $190s to low $200s and we will set our initial stop at $164, which would take out ABBV's 2025 low. We will use the bullish price objective, $226, as our target price. ABBV also carries a 3.3% yield.
| 25 | |||||||||||||||||||||||||||||
| 216.00 | X | • | • | 216.00 | |||||||||||||||||||||||||
| 212.00 | 3 | O | 4 | • | 212.00 | ||||||||||||||||||||||||
| 208.00 | X | O | X | O | • | Top | 208.00 | ||||||||||||||||||||||
| 204.00 | X | O | X | O | • | 204.00 | |||||||||||||||||||||||
| 200.00 | X | O | X | O | • | X | 200.00 | ||||||||||||||||||||||
| 198.00 | • | X | O | O | • | X | X | X | 198.00 | ||||||||||||||||||||
| 196.00 | • | X | O | 5 | O | X | X | O | X | 196.00 | |||||||||||||||||||
| 194.00 | • | X | O | X | O | X | O | X | O | X | 194.00 | ||||||||||||||||||
| 192.00 | • | X | O | X | O | X | X | X | O | X | X | 8 | X | 192.00 | |||||||||||||||
| 190.00 | X | • | X | O | X | O | X | O | X | O | X | O | X | O | X | O | • | Mid | 190.00 | ||||||||||
| 188.00 | X | O | X | O | X | O | X | O | 6 | O | 7 | O | X | O | X | • | 188.00 | ||||||||||||
| 186.00 | X | O | X | O | X | O | X | O | X | O | X | O | • | O | • | 186.00 | |||||||||||||
| 184.00 | X | 2 | O | X | O | X | O | X | O | X | • | • | 184.00 | ||||||||||||||||
| 182.00 | O | 1 | X | O | X | O | O | X | O | • | 182.00 | ||||||||||||||||||
| 180.00 | O | X | O | X | O | X | X | O | X | • | 180.00 | ||||||||||||||||||
| 178.00 | C | X | O | X | • | O | X | X | O | X | O | • | 178.00 | ||||||||||||||||
| 176.00 | O | X | O | X | • | O | X | O | X | O | X | • | 176.00 | ||||||||||||||||
| 174.00 | O | X | O | X | • | O | X | O | X | O | X | • | 174.00 | ||||||||||||||||
| 172.00 | O | O | X | • | O | X | O | X | O | X | • | 172.00 | |||||||||||||||||
| 170.00 | O | • | O | X | O | • | O | • | 170.00 | ||||||||||||||||||||
| 168.00 | • | • | O | X | • | • | Bot | 168.00 | |||||||||||||||||||||
| 166.00 | • | O | • | 166.00 | |||||||||||||||||||||||||
| 25 |
| AI C3.ai, Inc. Class A ($16.35) - Software - AI fell to break a double bottom at $22 on the way to a new multi-year low at $15. This 0 for 5'er moved to a negative trend in February and sits in the bottom half of the semiconductors sector RS matrix. The technical picture is weak and deteriorating; avoid long exposure. Overhead resistance is not seen until $30. |
| ALB Albemarle Corp ($80.76) - Chemicals - ALB was up more than 7% on Monday and returned to a buy signal and a positive trend when it broke a double top at $87. The positive trend change will elevate ALB to an acceptable 3 for 5'er; the stock also ranks in the top quintile of the chemicals sector matrix. From here, ALB shows no support on its chart until $65, meanwhile overhead resistance sits at $99. |
| COIN Coinbase Global, Inc. Class A ($323.23) - Software - COIN advanced Monday to break a double top at $320 before reaching an intraday high of $332. This ends a streak of three consecutive sell signals. COIN has a 3 for 5 TA rating after reversing down into a column of Os against the market and its peers. However, the long-term the long-term technical picture remains intact. Overhead resistance is not seen until $384 with initial support seen at $304 and $296. |
| FANG Diamondback Energy Inc ($136.84) - Oil - FANG fell to a sell signal and a negative trend Monday when it broke a double bottom at $140. The negative trend change will drop the stock to a 1 for 5'er. From here, the next level of support on FANG's chart sits at $136, a level from which it reversed up twice in July. |
| HP Helmerich & Payne, Inc. ($17.53) - Oil Service - HP returned to a buy signal Monday with a triple top break at $18. The technical outlook for the stock remains decidedly negative, however, as HP is a 0 for 5'er that ranks 60th of 66 names in the oil service sector matrix. From here, support sits at $15,50, while overhead resistance can be found at $19 and $20. |
| RCL Royal Caribbean Cruises Ltd. ($303.51) - Leisure - RCL broke a double bottom for a third sell signal since peaking at $352 in July. While still a 5 for 5'er, the market and peer RS charts have moved within earshot of potential reversals into Os, leaving two potential attributes at risk with further downside. From here, prior resistance in the upper $270 range my be seen as near-term support. |
| VLO Valero Energy Corp ($131.77) - Oil Service - VLO fell to a sell signal Monday when it broke a double bottom at $132. The weight of the evidence remains positive for the stock, however, as VLO is a 4 for 5'er that ranks in the top half of the oil service sector matrix. From here, the next level of support sits at $126. |

| Name | Option Symbol | Action | Stop Loss |
|---|---|---|---|
| Archer-Daniels-Midland Company - $58.28 | O: 25L57.50D19 | Buy the December 57.50 calls at 4.00 | 52.00 |
| Name | Option | Action |
|---|---|---|
| Altria Group Inc. ( MO) | Sep. 60.00 Calls | Raise the option stop loss to 4.10 (CP: 6.10) |
| 3M Company ( MMM) | Oct. 150.00 Calls | Initiate an option stop loss of 7.95 (CP: 9.95) |
| Philip Morris International Inc. ( PM) | Nov. 160.00 Calls | Raise the option stop loss to 14.10 (CP: 16.10) |
| Name | Option Symbol | Action | Stop Loss |
|---|---|---|---|
| Bristol-Myers Squibb Company - $45.93 | O: 25W46.00D21 | Buy the November 46.00 puts at 3.05 | 51.00 |
| Name | Option | Action |
|---|---|---|
| Gitlab, Inc. Class A ( GTLB) | Sep. 45.00 Puts | Raise the option stop loss to 5.20 (CP: 7.20) |
| American International Group, Inc. ( AIG) | Sep. 82.50 Puts | Stopped at 4.00 (CP: 4.00) |
| Robert Half Inc. ( RHI) | Sep. 40.00 Puts | Raise the option stop loss to 4.90 (CP: 6.90) |
| Salesforce Inc. ( CRM) | Nov. 260.00 Puts | Raise the option stop loss to 30.35 (CP: 32.35) |
| Best Buy Co., Inc. ( BBY) | Oct. 65.00 Puts | Stopped at 70.00 (CP: 68.71) |
| Name | Option Sym. | Call to Sell | Call Price | Investment for 500 Shares | Annual Called Rtn. | Annual Static Rtn. | Downside Protection |
|---|---|---|---|---|---|---|---|
| Norwegian Cruise Line Holdings Ltd. $ 24.00 | O: 25L24.00D19 | Dec. 24.00 | 2.47 | $ 10,745.85 | 29.67% | 28.85% | 9.32% |
| Name | Action |
|---|---|
| Hims & Hers Health Inc. ( HIMS) - 51.94 | Sell the September 55.00 Calls. |
| IonQ Inc. ( IONQ) - 41.85 | Sell the October 42.00 Calls. |
| MARA Holdings Inc. ( MARA) - 15.38 | Sell the December 18.00 Calls. |
| General Motors ( GM) - 53.53 | Sell the December 55.00 Calls. |
| NetApp, Inc. ( NTAP) - 106.21 | Sell the December 110.00 Calls. |
| KKR & Co. L.P ( KKR) - 142.67 | Sell the October 145.00 Calls. |
| Apollo Global Management Inc. ( APO) - 141.97 | Sell the December 150.00 Calls. |
| Vertiv Holdings LLC ( VRT) - 139.93 | Sell the October 140.00 Calls. |
| Robinhood Markets, Inc. Class A ( HOOD) - 114.63 | Sell the November 110.00 Calls. |
| Warner Bros. Discovery, Inc. Series A ( WBD) - 10.91 | Sell the November 12.00 Calls. |
| Name | Covered Write |
|---|---|
| Micron Technology, Inc. ( MU - 118.89 ) | November 110.00 covered write. |
Daily Equity & Market Analysis
LISTEN TO PODCAST
Apr 09, 2026
Loading, Please Wait...
