Most Requested Symbols

Mega-cap stocks tumbled Monday around fears the improvement from AI stocks might be ending.
The curve has an average reading of 16.10%.
Today's featured stock is Cintas Corporation (CTAS).
ASML, CBRL, CCJ, CENX, CRM, DELL, DLR, DOCU, DRI, EQIX, TTWO, VST, WMT.
Call: eBay Inc (EBAY); Put: CVS Health Corp (CVS); Covered Write: Live Nation Entertainment (LYV).
WEEKLY RUNDOWN - January 22, 2025
Weekly discussion with the NDW analyst team covering all major asset classes.
Weekly discussion with the NDW analyst team covering all major asset classes.
The US dollar (DX/Y) had been on a hot streak entering the new year, as it ended with a year-long return of over 7%—its second-best performance going back to 2016, with only 2022 better. The dollar continued its climb up until this past week when the buck reversed into a column of Os on its default trend chart. Since then, it has deteriorated even further to break a double bottom at $107.50, moving to a sell signal in the process.
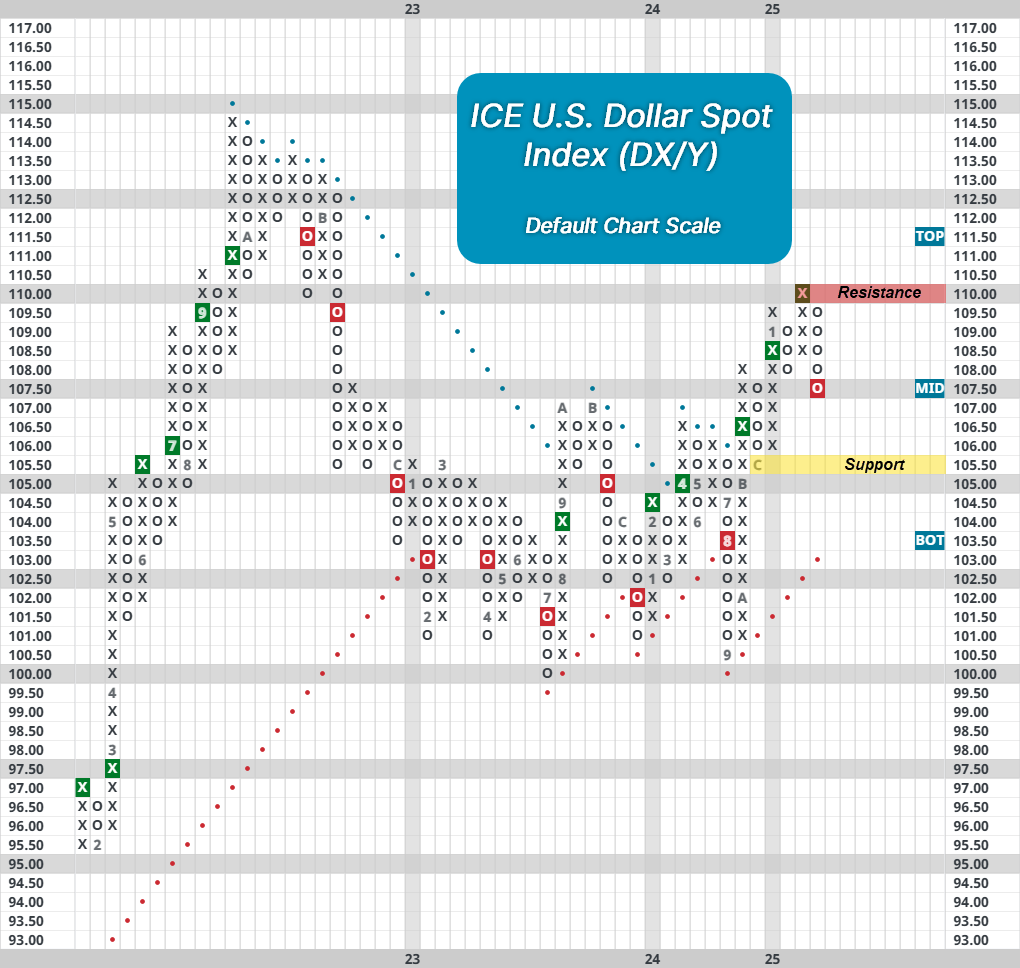
There’s a saying that the dollar tends to trend, but those trying to predict the dollar’s trend over the last couple of years were likely left scratching their head in confusion. The chart for DX/Y had been noticeably rangebound, with many of its signals being head fakes that resulted in reversals. Last week’s sell signal further muddied the waters, especially after what appeared to be a breakout. DX/Y was on a string of three consecutive buy signals, in addition to having broken established resistance around the $106 to $108 level—an area it hasn’t traded since 2022. DX/Y currently sits just below the middle of its ten-week trading band at -7% within our overbought/oversold metric, meaning it’s no longer overly elevated in the near term. However, the dollar was in overbought territory for almost three months before last week, as the last oversold instance came in September of 2024, highlighting its steady improvement across the last several months. From here, initial support lies at $105.50 with its bullish support line at $103.
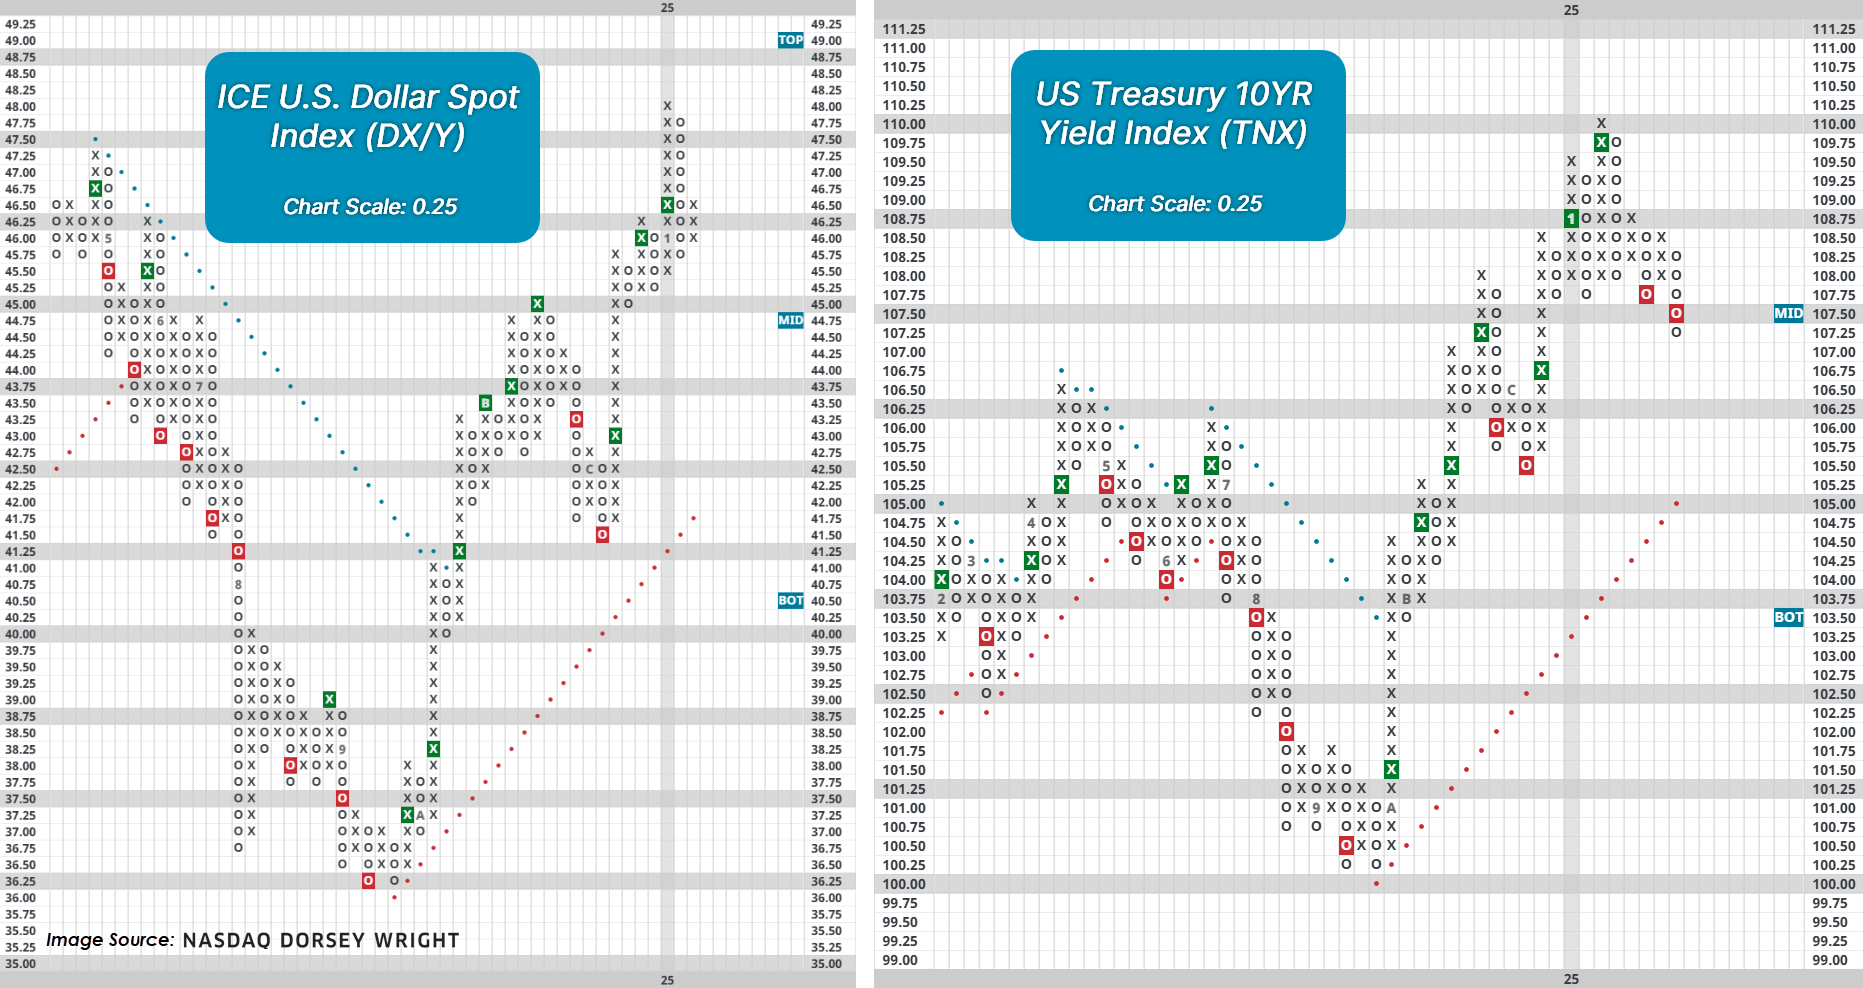
Higher interest yields can increase demand for a currency, which often causes appreciation. As a result, interest rate fluctuations can often spill over into currency markets. In a previous article, we mentioned that elevated interest rate volatility could be behind the dollar’s instability, and rates seem to continue being a culprit behind the dollar’s movement. Looking at the 0.25 scale charts for both the dollar (and ten-year treasury yields (TNX), the two charts have moved similarly in the last several months. Both bottomed around mid-September, then spun off several buy signals until taking a brief dip in November. The two are now on a slight pullback from highs two weeks ago, but DX/Y was the only one to give a sell signal so far, which may have been caused by fewer than anticipated tariffs in week one of the new presidential administration.
Despite the recent movement, the dollar remains in a rising dollar environment, which has a widespread impact across financial markets, as highlighted in our U.S. Dollar Study. Given its importance, the chart for DX/Y will be an important one to watch in the coming months.

The biggest names in the US stock market pulled back sharply to kick-off trading this week. This move was initiated by fears surrounding a new AI model announced by DeepSeek, a Chinese AI company that released a paper alongside their R1 model last week. This model appears to have comparable performance to the top models from domestic companies like OpenAI, but at a fraction of the cost (source: Yahoo Finance). The DeepSeek R1 model also utilizes an open-source framework that originated from Meta’s Llama models, meaning that any developer can use the model and see how it works. The mobile version spiked in popularity on Monday, overtaking ChatGPT for the top free app on Apple’s App Store before new registrations were halted (source: cnbc.com).
The public was led to believe that Chinese AI companies were not capable of building models like those built in the U.S. due to restricted access to the most powerful processors. Assuming the information released on the R1 model is accurate, DeepSeek proved that it could circumnavigate the chip restrictions by building on top of readily available open-source models. This was the source of investor panic on Monday; if DeepSeek could build a competitive model with a fraction of the investment in processing power, should we expect other companies to reduce their investments in processing power moving forward?
We are not in the game of predicting the future by attempting to figure out an answer to that question. All we can do is evaluate investor’s reactions and how those reactions affect the relationship between supply and demand for a given security. However, understanding the context around the AI supply chain is helpful. For the purposes of today’s discussion, we will divide the space into two parts; companies that build the processors, and companies that buy the processors. That is not meant to represent the space in its entirety. Electric utility companies are also a big part of this supply chain, as the companies that buy the processors need increased energy production to power their expanding purchases. The utilities sector (XLU) showed the second-worst declines of any broad sector Monday, behind technology (XLK). Those companies will also be important to monitor, but today’s conversation is geared toward the mega-cap companies that make up most of your major market indices.
Much of the AI-related stock appreciation has been centered around semiconductor manufacturers, as the companies driving AI innovation need high-powered processors to run their systems. Monday’s market action saw the VanEck Semiconductor ETF SMH drop by about 10%. Investors seem to be assuming that more efficient AI models will mean less reliance on high powered processors from the companies behind the models. This moved SMH to a sell signal but leaves it at support from November 2024. The decline also led SMH to reverse down into a column of O’s on its market relative strength chart, now sitting one box away from giving a sell signal against SPXEWI. Using this fund as a proxy, the broad semiconductor space still maintains a favorable long-term technical picture but is showing near-term weakness. We have seen SMH oscillating between $235 and $265 since last October. This range has produced some stagnation in relative strength as the improvement experienced over the last two years has cooled. Additional downside could turn that stagnation into relative weakness. On the other hand, some consistent improvement after this pullback (i.e. a series of higher lows) could be an opportunity to add exposure. Further support below this range can be seen at $215 and $205, while overhead resistance is seen at $265 and the all-time highs of $280 from July.

Next in the supply chain is the companies that have been investing in those high-powered processors, namely Microsoft MSFT, Meta Platforms META, Amazon AMZN, Alphabet GOOGL and Tesla TSLA. Most of those companies opened the day with initial declines that did not produce many changes to the stock’s long-term technical pictures. META climbed back into positive territory intra-day and printed a new all-time chart high Monday at $656. MSFT and AMZN saw declines but saw no changes to their default charts. TSLA dropped by over 3%, leading to a few more Os printed on the default chart, but the stock remains on a buy signal. GOOGL saw the sharpest decline of any of these names, dropping over 4% to reverse lower into a column of Os from the all-time chart high of $200. The stock still sits on two consecutive buy signals and shows initial support close by at $188 and $186.

Sharp pullbacks for these growth-oriented equity areas are common. For perspective, we have examined the number of 5% pullbacks experienced by a variety of representatives below, including from the Nasdaq-100 Index NDX, broad semiconductors (SMH), and the eight companies that had a market cap north of $1 trillion through Friday. Each of these individual companies have benefitted notably from the AI-related hype over the past two years. Our study simply examines each time the security in question experiences a 5% pullback that is followed by a 5% rally in share price (used to separate each individual instance) based on data through last Friday (1/24). Some of these representatives have not experienced a 5% pullback in the recent decline, while some have seen amplified weakness with the market action on Monday. Regardless, we see some consistent themes emerge that are outlined above the table.
Key Takeaways:

Average Level
16.10
| < - -100 | -100 - -80 | -80 - -60 | -60 - -40 | -40 - -20 | -20 - 0 | 0 - 20 | 20 - 40 | 40 - 60 | 60 - 80 | 80 - 100 | 100 - > |
|---|---|---|---|---|---|---|---|---|---|---|---|
|
Buy signalshy
|
|||||||||||
|
Buy signalONEQ
|
|||||||||||
|
Sell signalicf
|
Buy signalQQQ
|
||||||||||
|
Sell signalijr
|
Buy signalhyg
|
||||||||||
|
Sell signaltlt
|
Sell signaldx/y
|
Sell signaleem
|
Buy signaldia
|
||||||||
|
Sell signalief
|
Buy signaldvy
|
Buy signalIJH
|
Buy signalSPY
|
Buy signalVOOG
|
|||||||
|
Sell signallqd
|
Buy signaliwm
|
Buy signalrsp
|
Buy signalXLG
|
Buy signalUSO
|
|||||||
|
Sell signalagg
|
Sell signalVOOV
|
Sell signalfxe
|
Sell signalefa
|
Buy signalgcc
|
Buy signalGLD
|
Buy signalgsg
|
|||||
| < - -100 | -100 - -80 | -80 - -60 | -60 - -40 | -40 - -20 | -20 - 0 | 0 - 20 | 20 - 40 | 40 - 60 | 60 - 80 | 80 - 100 | 100 - > |
| AGG | iShares US Core Bond ETF |
| USO | United States Oil Fund |
| DIA | SPDR Dow Jones Industrial Average ETF |
| DVY | iShares Dow Jones Select Dividend Index ETF |
| DX/Y | NYCE U.S.Dollar Index Spot |
| EFA | iShares MSCI EAFE ETF |
| FXE | Invesco CurrencyShares Euro Trust |
| GLD | SPDR Gold Trust |
| GSG | iShares S&P GSCI Commodity-Indexed Trust |
| HYG | iShares iBoxx $ High Yield Corporate Bond ETF |
| ICF | iShares Cohen & Steers Realty ETF |
| IEF | iShares Barclays 7-10 Yr. Tres. Bond ETF |
| LQD | iShares iBoxx $ Investment Grade Corp. Bond ETF |
| IJH | iShares S&P 400 MidCap Index Fund |
| ONEQ | Fidelity Nasdaq Composite Index Track |
| QQQ | Invesco QQQ Trust |
| RSP | Invesco S&P 500 Equal Weight ETF |
| IWM | iShares Russell 2000 Index ETF |
| SHY | iShares Barclays 1-3 Year Tres. Bond ETF |
| IJR | iShares S&P 600 SmallCap Index Fund |
| SPY | SPDR S&P 500 Index ETF Trust |
| TLT | iShares Barclays 20+ Year Treasury Bond ETF |
| GCC | WisdomTree Continuous Commodity Index Fund |
| VOOG | Vanguard S&P 500 Growth ETF |
| VOOV | Vanguard S&P 500 Value ETF |
| EEM | iShares MSCI Emerging Markets ETF |
| XLG | Invesco S&P 500 Top 50 ETF |

| Symbol | Company | Sector | Current Price | Action Price | Target | Stop | Notes |
|---|---|---|---|---|---|---|---|
| CWST | Casella Waste Systems, Inc. | Waste Management | $105.03 | 100 - 110 | 135 | 91 | 5 for 5'er, LT pos mkt RS, spread triple top, Earn. 2/12 |
| COST | Costco Wholesale Corporation | Retailing | $939.68 | 940s - 1010 | 1288 | 792 | 5 TA rating, LT pos trend, LT RS buy, top 50% of RETA sector matrix, price consolidation |
| LPX | Louisiana-Pacific Corporation | Forest Prods/Paper | $115.06 | 97-110 | 173 | 87 | 5 TA rating, top half of FORE sector matrix, LT RS buy, R-R > 4, buy-on-pullback, Earn. 2/12 |
| REVG | REV Group Inc | Autos and Parts | $34.77 | hi 20s - lo 30s | 54 | 25 | 5 TA rating, top quintile of AUTO sector matrix, LT RS buy, LT pos trend, buy-on-pullback, R-R > 3 |
| USFD | US Foods Holding Corp. | Food Beverages/Soap | $69.52 | 65-lo 70s | 85 | 58 | 5 TA rating, top 20% of FOOD sector RS matrix, LT pos trend, LT RS buy, R-R > 2, Earn. 2/13 |
| GKOS | Glaukos Corp. | Healthcare | $160.22 | mid 140s - hi 150s | 206 | 126 | 5 TA rating, top 20% of HEAL sector matrix, LT RS buy, LT pos trend, R-R > 2, Earn. 2/19 |
| GFL | GFL Environmental Inc | Waste Management | $42.29 | low-to-mid 40s | 59 | 35 | 5 for 5'er, top 10% of WAST sector matrix, LT pos mkt RS, bullish catapult, buy on pullback, Earn. 2/18 |
| GIII | G-III Apparel Group | Textiles/Apparel | $31.89 | 29-lo 30s | 55 | 25 | 5 TA rating, top 50% of TEXT sector matrix, LT RS buy, LT pos trend, buy-on-pullback, R-R > 4-1 |
| PLNT | Planet Fitness Inc | Leisure | $104.89 | lo 100s - lo 110s | 139 | 86 | 5 TA rating, top decile of LEIS sector matrix, LT pos trend, consec. buy signals |
| CBRE | CBRE Group, Inc. | Real Estate | $141.13 | hi 120s - low 140s | 178 | 104 | 5 for 5'er, top 10% of REAL sector matrix, LT pos peer & mkt RS, bearish signal reversal, Earn. 2/13 |
| DAL | Delta Air Lines Inc. | Aerospace Airline | $67.18 | mid 60s - low 70s | 91 | 56 | 5 TA rating, top 20% of AERO sector matrix, LT RS buy, consec. buy signals, pos. wkly mom. |
| CTAS | Cintas Corporation | Textiles/Apparel | $197.39 | 190s - low 200s | 228 | 162 | 4 for 5'er, favored TEXT sector matrix, LT pos mkt RS, consec buy signals |
| Symbol | Company | Sector | Current Price | Action Price | Target | Stop | Notes |
|---|---|---|---|---|---|---|---|
| FL | Foot Locker, Inc. | Retailing | $20.84 | 22 - 25 | 16 | 27 | 0 for 5'er, bottom 10% of RETA sector matrix, multiple sell signals |
| AMD | Advanced Micro Devices, Inc. | Semiconductors | $122.84 | 120 - 130 | 100 | 146 | 0 for 5'er, bottom 20% of SEMI sector matrix, series of lower rally highs, sell on rally, Earn. 2/4 |
| Symbol | Company | Sector | Current Price | Action Price | Target | Stop | Notes |
|---|---|---|---|---|---|---|---|
| PEG | Public Service Enterprise Group Inc. | Utilities/Electricity | $88.05 | 82 - 90 | 122 | 71 | PEG fell to a sell signal Monday. OK to hold here. Maintain $71 stop. Earn. 2/24 |
| GLNG | Golar LNG Ltd | Oil Service | $40.14 | hi 30s - lo 40s | 65 | 33 | GLNG fell to a sell signal Monday. OK to hold here. Maintain $33 stop. |
| ORCL | Oracle Corporation | Software | $183.60 | low 180s - low 190s | 264 | 152 | ORCL fell to a sell signal Monday. OK to hold here w/ $152 stop. |
| Comment | |||||||
|---|---|---|---|---|---|---|---|
|
|
|||||||
CTAS Cintas Corporation R ($202.07) - Textiles/Apparel - CTAS is a 4 for 5;er that ranks in the middle of the favored textiles/apparel sector matrix and has been on a market RS buy signal since 2015. After briefly falling to a sell signal in December, CTAS found support at $182 and has now completed two consecutive buy signals on its default chart. Long exposure may be added in the $190s to low $200s and we will set our initial stop at $$162. We will use the stocks all-time high, $228, as our near-term price objective,
| 23 | 24 | 25 | |||||||||||||||||||||||||||
| 228.00 | X | Top | 228.00 | ||||||||||||||||||||||||||
| 224.00 | X | O | 224.00 | ||||||||||||||||||||||||||
| 220.00 | X | O | 220.00 | ||||||||||||||||||||||||||
| 216.00 | B | C | 216.00 | ||||||||||||||||||||||||||
| 212.00 | A | O | 212.00 | ||||||||||||||||||||||||||
| 208.00 | X | O | 208.00 | ||||||||||||||||||||||||||
| 204.00 | 9 | O | 204.00 | ||||||||||||||||||||||||||
| 200.00 | X | O | X | Mid | 200.00 | ||||||||||||||||||||||||
| 198.00 | X | O | X | 198.00 | |||||||||||||||||||||||||
| 196.00 | X | O | X | 196.00 | |||||||||||||||||||||||||
| 194.00 | X | O | X | X | 194.00 | ||||||||||||||||||||||||
| 192.00 | X | X | O | X | O | X | 192.00 | ||||||||||||||||||||||
| 190.00 | X | O | X | O | X | O | X | 190.00 | |||||||||||||||||||||
| 188.00 | X | O | X | O | X | 1 | O | 188.00 | |||||||||||||||||||||
| 186.00 | X | 8 | X | O | X | O | X | 186.00 | |||||||||||||||||||||
| 184.00 | X | O | O | X | O | X | 184.00 | ||||||||||||||||||||||
| 182.00 | X | O | O | 182.00 | |||||||||||||||||||||||||
| 180.00 | 7 | 180.00 | |||||||||||||||||||||||||||
| 178.00 | X | 178.00 | |||||||||||||||||||||||||||
| 176.00 | X | X | X | Bot | 176.00 | ||||||||||||||||||||||||
| 174.00 | X | O | X | O | X | 174.00 | |||||||||||||||||||||||
| 172.00 | X | O | X | O | 6 | 172.00 | |||||||||||||||||||||||
| 170.00 | X | 4 | X | O | X | 170.00 | |||||||||||||||||||||||
| 168.00 | X | O | X | O | X | 168.00 | |||||||||||||||||||||||
| 166.00 | X | O | X | O | 166.00 | ||||||||||||||||||||||||
| 164.00 | X | 5 | 164.00 | ||||||||||||||||||||||||||
| 162.00 | X | 162.00 | |||||||||||||||||||||||||||
| 160.00 | 3 | 160.00 | |||||||||||||||||||||||||||
| 158.00 | X | 158.00 | |||||||||||||||||||||||||||
| 156.00 | X | 156.00 | |||||||||||||||||||||||||||
| 154.00 | 2 | 154.00 | |||||||||||||||||||||||||||
| 152.00 | X | 152.00 | |||||||||||||||||||||||||||
| 150.00 | X | X | 150.00 | ||||||||||||||||||||||||||
| 148.00 | X | O | X | 148.00 | |||||||||||||||||||||||||
| 146.00 | X | O | X | 146.00 | |||||||||||||||||||||||||
| 144.00 | X | 1 | 144.00 | ||||||||||||||||||||||||||
| 142.00 | X | • | 142.00 | ||||||||||||||||||||||||||
| 140.00 | C | • | 140.00 | ||||||||||||||||||||||||||
| 138.00 | X | • | 138.00 | ||||||||||||||||||||||||||
| 136.00 | X | • | 136.00 | ||||||||||||||||||||||||||
| 134.00 | X | • | 134.00 | ||||||||||||||||||||||||||
| 132.00 | X | • | 132.00 | ||||||||||||||||||||||||||
| 130.00 | X | X | B | • | 130.00 | ||||||||||||||||||||||||
| 128.00 | X | 9 | O | X | O | X | • | 128.00 | |||||||||||||||||||||
| 126.00 | 7 | O | X | O | A | O | X | • | 126.00 | ||||||||||||||||||||
| 124.00 | X | O | X | O | X | O | • | 124.00 | |||||||||||||||||||||
| 122.00 | X | 8 | O | X | • | 122.00 | |||||||||||||||||||||||
| 120.00 | 6 | O | • | 120.00 | |||||||||||||||||||||||||
| 118.00 | X | • | 118.00 | ||||||||||||||||||||||||||
| 116.00 | X | X | 5 | • | 116.00 | ||||||||||||||||||||||||
| 114.00 | O | X | O | 3 | O | X | • | 114.00 | |||||||||||||||||||||
| 112.00 | O | X | O | 2 | O | X | • | 112.00 | |||||||||||||||||||||
| 110.00 | O | 1 | X | 4 | • | 110.00 | |||||||||||||||||||||||
| 108.00 | O | X | • | 108.00 | |||||||||||||||||||||||||
| 106.00 | O | • | 106.00 | ||||||||||||||||||||||||||
| 23 | 24 | 25 |
| ASML ASML Holding NV ADR ($690.15) - Semiconductors - ASML fell Monday to break a double bottom at $712 before dropping to $672 intraday. This 1 for 5'er moved to a negative trend in September and sits in the lower third of the semiconductors sector RS matrix. The technical picture is weak and deteriorating. Further support can be seen at $648 with overhead resistance seen initially at $784. Note that earnings are expected on 1/29. |
| CBRL Cracker Barrel Old Country Store, Inc. ($61.49) - Restaurants - CRBL broke a double top at $63 for a fifth consecutive buy signal. The stock is a 3 for 5'er that ranks 4th (out of 29) in the Restaurants sector matrix and is accompanied a yield of 1.7%. Okay to consider here on the breakout. Initial support lies at $58, while additional lies in the mid to lower $50s. |
| CCJ Cameco Corporation ($47.51) - Metals Non Ferrous - CCJ fell more than 15% on Monday, giving a sell signal and falling to a negative trend when it broke a double bottom at $48. The negative trend change will drop CCJ to a still acceptable 3 for 5'er. However, given the magnitude of Monday's drop, CCJ's technical attribute rating could see further deterioration. From here, the stock shows no additional support on its chart until $36, more than 20% from Monday's close. |
| CENX Century Aluminum Co ($16.70) - Metals Non Ferrous - CENX was down 15% on Monday and gave a sell signal when it broke a triple bottom at $17. At this point, the technical outlook for CENX remains positive as it has an acceptable 3 for 5 technical attribute rating and ranks in the top quintile of the non-ferrous metals sector matrix. However, given the size of Monday's decline, CENX's TA rating and its rank in the sector matrix could fall in the short-term. From here, the next level of support is the stock's bullish support line, which currently sits at $17. |
| CRM Salesforce Inc. ($347.10) - Software - CRM moved higher Monday to break a double top at $348 before reaching $352 intraday. This 5 for 5'er moved to a positive trend in September and sits in the top third of the favored software sector RS matrix. The weight of the technical evidence is favorable and improving again. Initial support can be seen at $326 with overhead resistance seen at $364 and $368. |
| DELL Dell Technologies Inc Class C ($103.84) - Computers - DELL dropped Monday to break a double bottom at $106 before falling to $102 intraday. This also moved the stock to a negative trend and demotes it to a 2 for 5 TA rating. The technical picture is weak and deteriorating. The stock is at support from September. Overhead resistance may be seen at $120. |
| DLR Digital Realty Trust, Inc. ($164.74) - Real Estate - Shares of DLR fell Monday to break a double bottom at $170, moving to a sell signal. Digital Realty also violated its bullish support line, bringing it to a negative trend while taking it down to a 2 for 5’er. DLR has also been on a market RS sell signal since 2021, indicating a lack of long-term relative strength. From here, initial support lies at $156, with additional support in the $16 to $128 range. Look to potentially cut loose on a reversal out of washed out territory. |
| DOCU DocuSign, Inc. ($92.26) - Software - DOCU pushed higher Monday to break a double top at $94, notching a second consecutive buy signal. This 5 for 5'er moved to a positive trend in August and sits in the top quintile of the favored software sector RS matrix. The weight of the technical evidence is favorable and improving. Initial support can be seen at $89 with further support at $88. |
| DRI Darden Restaurants, Inc. ($191.58) - Restaurants - DRI broke a triple top at $190 as the stock rallied to a new all-time high at $192. The stock is a 5 for 5'er that ranks within the top third of the Restaurants sector matrix and is accompanied by a yield north of 3%. Okay to consider here on the breakout or on a pullback to the mid $180s. Initial support lies at $180, while the bullish support line resides at $168. |
| EQIX Equinix, Inc. ($900.10) - Real Estate - Shares of EXS broke a double bottom at $880 to move to a sell signal. The 4 for 5’er remains in a positive trend with its bullish support line at $816, but movement below there would bring its trend back to negative. EQIX remains ok to hold, but watch for signs of additional weakness, such as a change in trend. From here, support lies at $768 and then $736. Resistance is ahead at $944 then $992. |
| TTWO Take-Two Interactive Software, Inc. ($188.74) - Leisure - TTWO reversed into Xs and broke a double top at $190 to return to a buy signal. The stock is a 4 for 5'er that ranks within the top half of the Leisure sector matrix.Okay to consider here on the breakout. Initial support lies in the $178 to $180 range, while additional lies at $174. |
| VST Vistra Corp ($135.26) - Utilities/Electricity - VST broke a double bottom at $166, completing a bullish signal reversal pattern as shares fell to $134 on the chart. This violations multiple levels of support on the default chart, and brings the chart below where is began the year. VST will maintain a positive trend and long-term positive RS against the market and its peer group, so the stock will maintain at least a 3 attribute rating. Beyond support at $132, additional lies at $112 and $108, the bullish support line. |
| WMT Walmart Inc. ($96.92) - Retailing - WMT broke a double top at $97, marking a new all-time chart high and a fourth consecutive buy signal since early 2024. The stock is a 5 for 5'er that ranks within the top third of the Retailing sector matrix. Okay to consider here on the breakout or on a pullback to $94 on the chart. Initial support lies at $89, while additional lies at $78. |

| Name | Option Symbol | Action | Stop Loss |
|---|---|---|---|
| eBay Inc. - $66.84 | O: 25F65.00D20 | Buy the June 65.00 calls at 6.80 | 60.00 |
| Name | Option | Action |
|---|---|---|
| Flex Ltd ( FLEX) | Feb. 39.00 Calls | Stopped at 3.90 (CP: 1.85) |
| Public Service Enterprise Group Inc. ( PEG) | Mar. 87.50 Calls | Stopped at 81.00 (CP: 81.94) |
| Philip Morris International Inc. ( PM) | Feb. 125.00 Calls | Initiate an option stop loss of 5.10 (CP: 7.10) |
| The TJX Companies, Inc. ( TJX) | Feb. 120.00 Calls | Initiate an option stop loss of 3.20 (CP: 5.20) |
| Alphabet Inc. ( GOOG) | Mar. 195.00 Calls | Stopped at 11.75 (CP: 9.15) |
| Corteva Inc ( CTVA) | Mar. 55.00 Calls | Raise the option stop loss to 7.40 (CP: 9.40) |
| Arista Networks Inc ( ANET) | Mar. 112.50 Calls | Stopped at 19.00 (CP: 5.20) |
| CBRE Group, Inc. ( CBRE) | Mar. 135.00 Calls | Raise the option stop loss to 9.80 (CP: 11.80) |
| Apple Inc. ( AAPL) | Jun. 220.00 Calls | Initiate an option stop loss of 20.00 (CP: 22.00) |
| Walmart Inc. ( WMT) | Jun. 92.50 Calls | Initiate an option stop loss of 6.90 (CP: 8.90) |
| Name | Option Symbol | Action | Stop Loss |
|---|---|---|---|
| CVS Health Corp. - $56.20 | O: 25Q57.50D16 | Buy the May 57.50 puts at 5.30 | 61.00 |
| Name | Option | Action |
|---|---|---|
| Devon Energy Corporation ( DVN) | May. 37.50 Puts | Initiate an option stop loss of 1.60 (CP: 3.60) |
| Advanced Micro Devices, Inc. ( AMD) | Mar. 125.00 Puts | Initiate an option stop loss of 12.75 (CP: 14.75) |
| Name | Option Sym. | Call to Sell | Call Price | Investment for 500 Shares | Annual Called Rtn. | Annual Static Rtn. | Downside Protection |
|---|---|---|---|---|---|---|---|
| Live Nation Entertainment Inc. $ 140.74 | O: 25F145.00D20 | Jun. 145.00 | 10.30 | $ 65,828.75 | 22.98% | 16.93% | 6.26% |
| Name | Action |
|---|---|
| Fortinet Inc. ( FTNT) - 96.90 | Sell the March 97.50 Calls. |
| Norwegian Cruise Line Holdings Ltd. ( NCLH) - 25.68 | Sell the March 27.00 Calls. |
| NVIDIA Corporation ( NVDA) - 142.62 | Sell the May 140.00 Calls. |
| Hewlett Packard Enterprise Company ( HPE) - 24.37 | Sell the March 24.00 Calls. |
| Carnival Corporation ( CCL) - 25.42 | Sell the June 27.00 Calls. |
| United Airlines Holdings Inc. ( UAL) - 105.00 | Sell the May 110.00 Calls. |
| Name | Covered Write |
|---|---|
| Marvell Technology Inc. ( MRVL - 124.02 ) | March 125.00 covered write. |
| Micron Technology, Inc. ( MU - 103.19 ) | May 110.00 covered write. |
Daily Equity & Market Analysis
LISTEN TO PODCAST
Apr 09, 2026
Loading, Please Wait...
