
Market declines aren’t just a risk in this business—they’re an inevitability. Today, we examine the frequency markets experience drawdowns, as well as whether 2025 will be naughty or nice year for investors.
Everyone hopes that markets will continue rising forever, but unfortunately, we all know that isn’t possible. The opportunity for gains will always be accompanied with the risk of losses. As a result, drawdowns aren’t just a risk in this business—they’re an inevitability. While many investors believe they can hold steady in the face of losses, holding through a steep decline is easier said than done when one’s livelihood is at stake. Understandings these pivotal moments before they happen can better prepare you for when they do occur. As the new year begins, we enter another opportunity for downside. With that said, what can we expect for the year ahead according to historical averages?
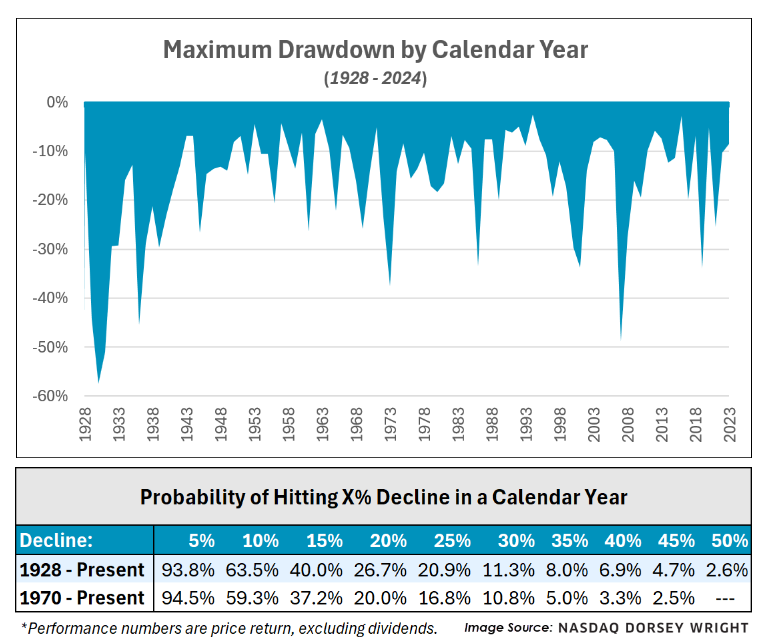
To answer that question, we looked at the maximum drawdown of the S&P 500—defined as the maximum peak to trough decline—for each calendar year going back 1928. Over that period, the average maximum drawdown was 15.85%. Said plainly, the S&P 500 is down almost 16% from an intra-year high on average at some point in the year. However, the range of drawdowns deviates significantly in both directions. At its most extreme, the S&P 500 saw a maximum drawdown of 58% in 1931. Meanwhile, 1995 was no more than 2.53% away from its highs at any point that year. Thankfully for us, drawdowns of 1931’s magnitude are extremely rare, but significant drawdowns are still not uncommon. As seen in the table above, the market sees a drawdown of 20% or more in around a quarter of calendar years. Declines of 10% are even more common, with almost two thirds of years falling that amount or worse at some point. The stock market has changed significantly across the last century, arguably becoming far more efficient and less volatile. Limiting the lookback period to 1970 does slightly reduce the probability of drawdowns, especially at more extreme levels. It is important to note that these numbers are the greatest decline within the year, not the overall return, meaning that years can see large drawdowns and recover swiftly. For example, the S&P 500 had a pullback of 28% from January 6th to March 9th of 2009 but still managed to end the year with a 23% gain after rallying.
Reflecting on 2024, it was a rather quiet year in terms of drawdowns. The max distance from an intra-year high sits at only 8.5%, which took place from July 16th to August 5th. For perspective, that decline is lower than 70% of years in the sample. Given a stronger market this past year, should temper our expectations for 2025?
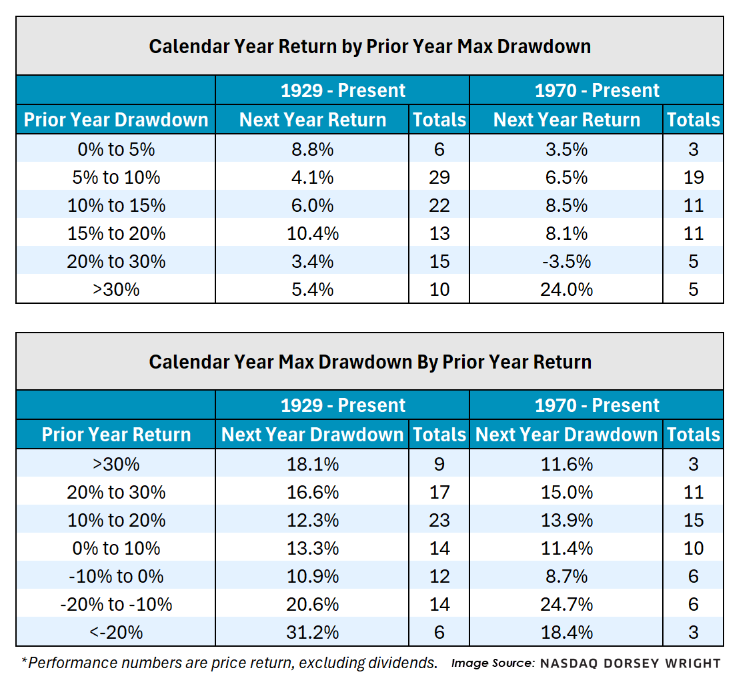
Looking at the first table above, we see average calendar year returns depending of the prior year's max drawdown. Years that avoided a drawdown of 10%—where 2024 would lie assuming no last minute crash—generally saw muted returns the following year. Meanwhile, markets were mixed following turbulent years with a drawdown in excess of 20%. A similar story emerges when we look at drawdowns given the prior year return. Drawdowns are generally higher than average if the S&P 500 gained more than 20% in the prior year. When the S&P 500 rose between 20% to 30% in the previous year—where 2024 would currently fall—then the average drawdown the following year is slightly larger than average at 16.5%. However, the worst declines typically come after a loss of 10% or more in the prior year, meaning that sizeable down years have been more likely to continue their streak of further pullbacks in the following year. In both tables, there appears to be goldilocks zone where markets are neither turbulent nor overextended, which has historically resulted in the best performance
While history can be a helpful guide, each market environment is different, and trends can only provide so much context. History may suggest slightly muted expectations for next year, but the core market does enter 2025 with steam behind it. Domestic equities have continued to rank highly from a relative strength perspective, sitting firmly at the top of DALI’s rankings, even with some recent decline in participation. No one can know for sure whether the coming year will be naughty or nice for investors, so asset managers should continue to monitor technical developments for signs of change.
