Most Requested Symbols

Market declines aren’t just a risk in this business—they’re an inevitability. Today, we examine the frequency markets experience drawdowns, as well as whether 2025 will be naughty or nice year for investors.
The curve has an average reading of -28.28%.
Today's featured stock is Louisiana-Pacific Corporation (LPX).
Comments include: AAPL, BTU, COLD, & JBT.
Call: Johnson Controls International PLC (JCI); Put: Alibaba Group Holding (BABA); Covered Write: NVIDIA Corp (NVDA).
NDW Morning Update Video - December 26, 2024
NDW Morning Update Video – December 26, 2024.
Click here to download MP3
‘Twas the night before Christmas and all through the market
Not a ticker was stirring, not even Tesla nor Target.
The Point and Figure charts were updated after close with great care,
In hopes that more buy signals would soon be there.
The traders were nestled all snug in their bed,
With all-time highs dancing at the front of their head.
The analysts on their laptops, working hard as hard as can be.
“The markets are up!” They said with great glee!
When over on DALI there arose such a clatter,
I sprang to my screen to see what was the matter.
Back at the top of the rest like a star
Domestic Equities in one, beating cash out by far!
The intra-day upticks they caused me to rue
With equities at all-time highs, pullbacks sometimes seemed overdue.
When what to my wandering eyes did appear,
MMPR below 10? That’s a reason for cheer.
Oh how the markets can turn on a dime,
A reason to be tactical each and all of the time.
Although just buying the core has been fun…
You never know when a new trend has begun.
Oh what a treat to see what was before me
Coming down the chimney was Good Old Tom Dorsey
Tactically tilted, the accounts settled in,
As RS charts will find the places that win.
“On META, on Amazon, on Large-Cap Growth and Blend.
Off Healthcare and Energy, we just can’t recommend.
This year’s returns have been ones to display,
Now rally, now rally, may the market rally each day!"
From here our little story is not worth predicting,
As leaders and laggards they are always shifting.
And while no one can predict what’s next on the docket,
It’s the ability to adapt that helps keep money in our pocket.
From Bitcoin, to Equities, to Crude to TIPS
The one constant is change, so have a plan for the dips.
With alerts set on the models and eyes on the bell,
Momentum can help identify the right time to sell.
And with that, we close the book on what's been a pretty good year,
We can hope these returns continue, and don’t disappear.
From the team at Dorsey Wright as 2025 comes into sight,
"Merry Christmas to all, and to all a good night!"


Everyone hopes that markets will continue rising forever, but unfortunately, we all know that isn’t possible. The opportunity for gains will always be accompanied with the risk of losses. As a result, drawdowns aren’t just a risk in this business—they’re an inevitability. While many investors believe they can hold steady in the face of losses, holding through a steep decline is easier said than done when one’s livelihood is at stake. Understandings these pivotal moments before they happen can better prepare you for when they do occur. As the new year begins, we enter another opportunity for downside. With that said, what can we expect for the year ahead according to historical averages?
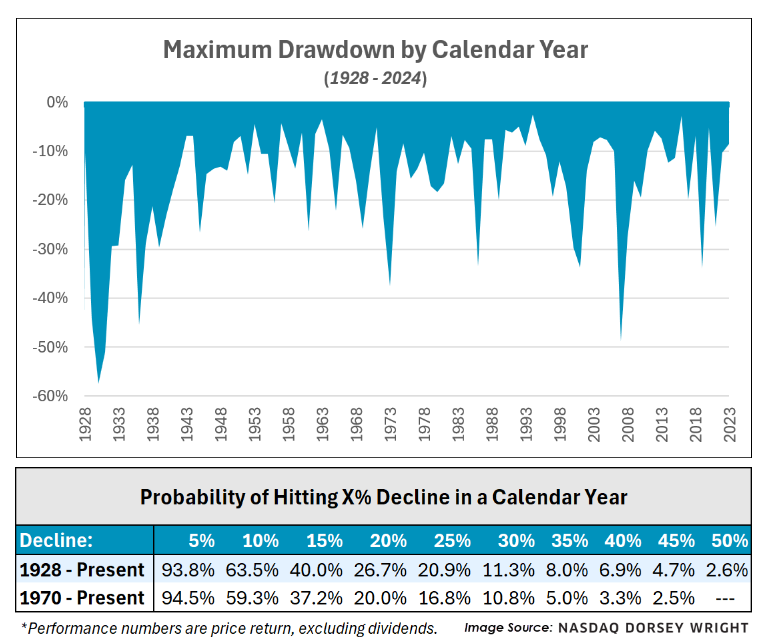
To answer that question, we looked at the maximum drawdown of the S&P 500—defined as the maximum peak to trough decline—for each calendar year going back 1928. Over that period, the average maximum drawdown was 15.85%. Said plainly, the S&P 500 is down almost 16% from an intra-year high on average at some point in the year. However, the range of drawdowns deviates significantly in both directions. At its most extreme, the S&P 500 saw a maximum drawdown of 58% in 1931. Meanwhile, 1995 was no more than 2.53% away from its highs at any point that year. Thankfully for us, drawdowns of 1931’s magnitude are extremely rare, but significant drawdowns are still not uncommon. As seen in the table above, the market sees a drawdown of 20% or more in around a quarter of calendar years. Declines of 10% are even more common, with almost two thirds of years falling that amount or worse at some point. The stock market has changed significantly across the last century, arguably becoming far more efficient and less volatile. Limiting the lookback period to 1970 does slightly reduce the probability of drawdowns, especially at more extreme levels. It is important to note that these numbers are the greatest decline within the year, not the overall return, meaning that years can see large drawdowns and recover swiftly. For example, the S&P 500 had a pullback of 28% from January 6th to March 9th of 2009 but still managed to end the year with a 23% gain after rallying.
Reflecting on 2024, it was a rather quiet year in terms of drawdowns. The max distance from an intra-year high sits at only 8.5%, which took place from July 16th to August 5th. For perspective, that decline is lower than 70% of years in the sample. Given a stronger market this past year, should temper our expectations for 2025?
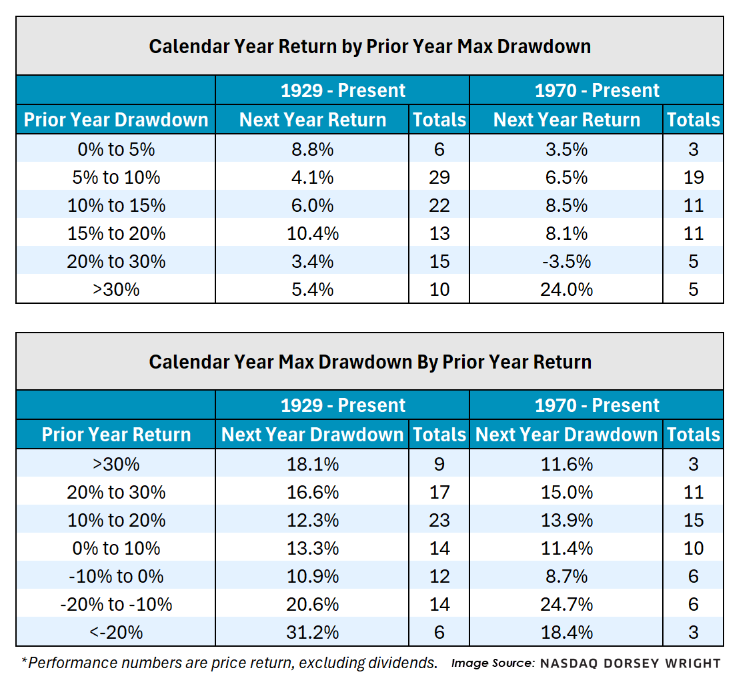
Looking at the first table above, we see average calendar year returns depending of the prior year's max drawdown. Years that avoided a drawdown of 10%—where 2024 would lie assuming no last minute crash—generally saw muted returns the following year. Meanwhile, markets were mixed following turbulent years with a drawdown in excess of 20%. A similar story emerges when we look at drawdowns given the prior year return. Drawdowns are generally higher than average if the S&P 500 gained more than 20% in the prior year. When the S&P 500 rose between 20% to 30% in the previous year—where 2024 would currently fall—then the average drawdown the following year is slightly larger than average at 16.5%. However, the worst declines typically come after a loss of 10% or more in the prior year, meaning that sizeable down years have been more likely to continue their streak of further pullbacks in the following year. In both tables, there appears to be goldilocks zone where markets are neither turbulent nor overextended, which has historically resulted in the best performance
While history can be a helpful guide, each market environment is different, and trends can only provide so much context. History may suggest slightly muted expectations for next year, but the core market does enter 2025 with steam behind it. Domestic equities have continued to rank highly from a relative strength perspective, sitting firmly at the top of DALI’s rankings, even with some recent decline in participation. No one can know for sure whether the coming year will be naughty or nice for investors, so asset managers should continue to monitor technical developments for signs of change.
Average Level
-28.28
| < - -100 | -100 - -80 | -80 - -60 | -60 - -40 | -40 - -20 | -20 - 0 | 0 - 20 | 20 - 40 | 40 - 60 | 60 - 80 | 80 - 100 | 100 - > |
|---|---|---|---|---|---|---|---|---|---|---|---|
|
Sell signalicf
|
|||||||||||
|
Buy signalshy
|
|||||||||||
|
Sell signalief
|
|||||||||||
|
Sell signaltlt
|
|||||||||||
|
Sell signalefa
|
|||||||||||
|
Sell signalfxe
|
Buy signalhyg
|
||||||||||
|
Sell signalagg
|
Sell signaleem
|
||||||||||
|
Sell signalVOOV
|
Buy signalrsp
|
Buy signaliwm
|
Buy signaluso
|
Buy signalONEQ
|
|||||||
|
Sell signallqd
|
Buy signalIJH
|
Buy signalGLD
|
Buy signalgsg
|
Buy signalXLG
|
|||||||
|
Buy signaldvy
|
Sell signalijr
|
Buy signaldia
|
Buy signalgcc
|
Buy signalSPY
|
Buy signalQQQ
|
Buy signalVOOG
|
Buy signaldx/y
|
||||
| < - -100 | -100 - -80 | -80 - -60 | -60 - -40 | -40 - -20 | -20 - 0 | 0 - 20 | 20 - 40 | 40 - 60 | 60 - 80 | 80 - 100 | 100 - > |
| AGG | iShares US Core Bond ETF |
| USO | United States Oil Fund |
| DIA | SPDR Dow Jones Industrial Average ETF |
| DVY | iShares Dow Jones Select Dividend Index ETF |
| DX/Y | NYCE U.S.Dollar Index Spot |
| EFA | iShares MSCI EAFE ETF |
| FXE | Invesco CurrencyShares Euro Trust |
| GLD | SPDR Gold Trust |
| GSG | iShares S&P GSCI Commodity-Indexed Trust |
| HYG | iShares iBoxx $ High Yield Corporate Bond ETF |
| ICF | iShares Cohen & Steers Realty ETF |
| IEF | iShares Barclays 7-10 Yr. Tres. Bond ETF |
| LQD | iShares iBoxx $ Investment Grade Corp. Bond ETF |
| IJH | iShares S&P 400 MidCap Index Fund |
| ONEQ | Fidelity Nasdaq Composite Index Track |
| QQQ | Invesco QQQ Trust |
| RSP | Invesco S&P 500 Equal Weight ETF |
| IWM | iShares Russell 2000 Index ETF |
| SHY | iShares Barclays 1-3 Year Tres. Bond ETF |
| IJR | iShares S&P 600 SmallCap Index Fund |
| SPY | SPDR S&P 500 Index ETF Trust |
| TLT | iShares Barclays 20+ Year Treasury Bond ETF |
| GCC | WisdomTree Continuous Commodity Index Fund |
| VOOG | Vanguard S&P 500 Growth ETF |
| VOOV | Vanguard S&P 500 Value ETF |
| EEM | iShares MSCI Emerging Markets ETF |
| XLG | Invesco S&P 500 Top 50 ETF |

| Symbol | Company | Sector | Current Price | Action Price | Target | Stop | Notes |
|---|---|---|---|---|---|---|---|
| TT | Trane Technologies PLC | Building | $377.49 | 368-lo 400s | 468 | 336 | 5 TA rating, top 20% of BUIL sector matrix, consec buy signals, LT RS buy, LT pos trend |
| BSX | Boston Scientific Corporation | Healthcare | $89.86 | 82 - 89 | 106 | 70 | 5 for 5'er, top 25% of HEAL sector matrix, LT pos mkt RS, triple top breakout |
| COR | Cencora Inc. | Drugs | $227.64 | hi 220s - low 240s | 300 | 212 | 5 for 5'er, top third of DRUG sector matrix, LT pos mkt RS, spread triple top |
| CWST | Casella Waste Systems, Inc. | Waste Management | $104.81 | 100 - 110 | 135 | 91 | 4 for 5'er, LT pos mkt RS, spread triple top |
| ORLY | O'Reilly Automotive, Inc. | Autos and Parts | $1207.26 | 1200s | 1616 | 1008 | 5 TA rating, top third of AUTO sector matrix, consec. buy signals, LT pos trend, LT RS buy |
| BKU | Bankunited Inc. | Banks | $38.38 | hi 30s - low 40s | 65 | 33 | 4 for 5'er, top 20% of favored BANK sector matrix, one box from peer RS buy, spread triple top, R-R>2.0, 2.8% yield |
| PEG | Public Service Enterprise Group Inc. | Utilities/Electricity | $85.23 | 82 - 90 | 122 | 71 | 4 for 5'er, top quintile of EUTI sector matrix, one box from mkt RS buy signal, buy on pullback, 2.8% yield |
| COST | Costco Wholesale Corporation | Retailing | $949.91 | 940s - 1010 | 1288 | 792 | 5 TA rating, LT pos trend, LT RS buy, top 50% of RETA sector matrix, price consolidation |
| ITT | ITT Corporation | Machinery and Tools | $142.87 | 140s - low 150s | 202 | 120 | 5 for 5'er, top half of MACH sector matrix, LT pos peer RS, spread triple top, pullback from ATH |
| GLNG | Golar LNG Ltd | Oil Service | $41.84 | hi 30s - lo 40s | 65 | 33 | 5 TA rating, top 20% of OILS sector matrix, LT pos trend, R-R > 3, buy-on-pullback |
| APO | Apollo Global Management Inc. | Wall Street | $171.63 | 168 - 180 | 232 | 138 | 5 for 5'er, #7 of 64 in WALL sector matrix, LT pos mkt RS, triple top, pullback from ATH |
| LPX | Louisiana-Pacific Corporation | Forest Prods/Paper | $103.93 | 97-110 | 173 | 87 | 5 TA rating, top half of FORE sector matrix, LT RS buy, R-R > 4, buy-on-pullback |
| Symbol | Company | Sector | Current Price | Action Price | Target | Stop | Notes |
|---|---|---|---|---|---|---|---|
| FL | Foot Locker, Inc. | Retailing | $21.55 | 22 - 25 | 16 | 27 | 0 for 5'er, bottom 10% of RETA sector matrix, multiple sell signals |
| Comment | |||||||
|---|---|---|---|---|---|---|---|
|
|
|||||||
LPX Louisiana-Pacific Corporation ($103.34) R - Forest Prods/Paper - LPX has a strong 5 for 5 TA rating and sits in the top half of the forest products/paper sector RS matrix. We have also seen LPX maintain an RS buy signal against the market since 2020 and it has been in a positive trend since February. The stock pushed higher in November to notch a new all-time high before retracting to the current chart position at $104. This leaves the stock in a more normalized trading range for potential long investors. Exposure may be considered on this pullback from $97 to $110. Our initial stop will be positioned at $87, which would violate multiple support levels and move the stock to a negative trend. The bullish price objective of $173 will serve as our price target, offering a reward-to-risk north of 4-to-1.
| 122.00 | X | 122.00 | |||||||||||||||||||||||||||
| 120.00 | X | O | 120.00 | ||||||||||||||||||||||||||
| 118.00 | X | O | 118.00 | ||||||||||||||||||||||||||
| 116.00 | X | C | 116.00 | ||||||||||||||||||||||||||
| 114.00 | X | O | 114.00 | ||||||||||||||||||||||||||
| 112.00 | X | O | 112.00 | ||||||||||||||||||||||||||
| 110.00 | X | O | Mid | 110.00 | |||||||||||||||||||||||||
| 108.00 | X | X | O | 108.00 | |||||||||||||||||||||||||
| 106.00 | X | O | X | O | 106.00 | ||||||||||||||||||||||||
| 104.00 | X | O | X | X | O | 104.00 | |||||||||||||||||||||||
| 102.00 | X | A | X | O | B | 102.00 | |||||||||||||||||||||||
| 100.00 | X | X | X | O | X | O | X | 100.00 | |||||||||||||||||||||
| 99.00 | X | O | X | O | X | X | O | O | X | 99.00 | |||||||||||||||||||
| 98.00 | X | O | X | O | X | O | X | O | X | 98.00 | |||||||||||||||||||
| 97.00 | X | 8 | X | O | X | O | X | O | 97.00 | ||||||||||||||||||||
| 96.00 | X | O | X | O | X | O | X | 96.00 | |||||||||||||||||||||
| 95.00 | X | X | O | X | O | X | 9 | X | 95.00 | ||||||||||||||||||||
| 94.00 | X | O | X | O | X | O | X | O | X | 94.00 | |||||||||||||||||||
| 93.00 | X | X | O | X | O | X | O | X | O | X | 93.00 | ||||||||||||||||||
| 92.00 | X | X | 6 | O | X | O | X | O | X | O | O | Bot | 92.00 | ||||||||||||||||
| 91.00 | X | O | X | O | X | O | X | O | X | X | O | X | • | 91.00 | |||||||||||||||
| 90.00 | X | O | X | O | X | O | X | O | X | O | X | O | X | • | 90.00 | ||||||||||||||
| 89.00 | X | O | O | X | O | O | X | X | O | X | O | • | 89.00 | ||||||||||||||||
| 88.00 | X | O | O | X | O | X | O | • | 88.00 | ||||||||||||||||||||
| 87.00 | X | O | X | O | X | • | 87.00 | ||||||||||||||||||||||
| 86.00 | X | O | O | X | • | 86.00 | |||||||||||||||||||||||
| 85.00 | X | O | X | • | 85.00 | ||||||||||||||||||||||||
| 84.00 | X | O | X | • | 84.00 | ||||||||||||||||||||||||
| 83.00 | X | O | X | • | 83.00 | ||||||||||||||||||||||||
| 82.00 | X | O | X | • | 82.00 | ||||||||||||||||||||||||
| 81.00 | X | 7 | X | • | 81.00 | ||||||||||||||||||||||||
| 80.00 | X | O | • | 80.00 | |||||||||||||||||||||||||
| 79.00 | X | • | 79.00 | ||||||||||||||||||||||||||
| 78.00 | X | • | 78.00 | ||||||||||||||||||||||||||
| 77.00 | X | • | 77.00 | ||||||||||||||||||||||||||
| 76.00 | X | X | • | 76.00 | |||||||||||||||||||||||||
| 75.00 | X | O | X | • | 75.00 | ||||||||||||||||||||||||
| 74.00 | X | O | X | • | 74.00 | ||||||||||||||||||||||||
| 73.00 | O | • | 73.00 |
| AAPL Apple Inc. ($257.07) - Computers - AAPL brought gifts to shareholders Christmas Eve, rising to a new all-time high at $256. The stock maintains a 5 for 5 TA rating and sits in the top quartile of the computers sector RS matrix. The weight of the technical evidence is overwhelmingly positive, however, the stock is trading in overbought territory with an intraday reading north of 100%. Initial support can be seen at $220 with further support at $216. |
| BTU Peabody Energy Corporation ($20.14) - Oil - BTU fell to a sell signal and a negative trend when it broke a triple bottom at $20 on Tuesday, taking out all remaining support it has found this year. The negative trend change will drop BTU to a 1 for 5'er; |
| COLD Americold Realty Trust Inc. ($21.12) - Real Estate - Shares of COLD broke a spread triple bottom at $21 for its second consecutive sell signal. The 0 for 5'er has been on a negative trend since last year while holding a market RS sell signal since 2020. COLD is nearing the bottom of its ten-week trading band, meaning there is greater potential for near-term bounce. However, the bulk of its technical picture remains negative, and it should be avoided until it sees significant technical improvement. |
| JBT John Bean Technologies Corporation ($130.36) - Machinery and Tools - JBT moved higher today to new all-time highs. It now sits on a string of four consecutive buy signals on its default chart. From a relative perspective, the 3/5'er sits just a few boxes away from returning to buy signals against both the market and its peer group. Those looking to be a bit defensive with additional allocation should wait for these attributes to fall into favor. Towards the downside, eye support between $114 and $122. |

| Name | Option Symbol | Action | Stop Loss |
|---|---|---|---|
| Johnson Controls International PLC - $80.76 | O: 25B80.00D21 | Buy the February 80.00 calls at 4.30 | 73.00 |
| Name | Option | Action |
|---|---|---|
| Fiserv, Inc. ( FI) | Mar. 200.00 Calls | Initiate an option stop loss of 14.00 (CP: 16.00) |
| Apollo Global Management Inc. ( APO) | Mar. 170.00 Calls | Initiate an option stop loss of 12.30 (CP: 14.30) |
| Name | Option Symbol | Action | Stop Loss |
|---|---|---|---|
| Alibaba Group Holding Ltd (China) ADR - $85.47 | O: 25O85.00D21 | Buy the March 85.00 puts at 5.20 | 95.00 |
| Name | Option | Action |
|---|---|---|
| Phillips 66 ( PSX) | Feb. 130.00 Puts | Stopped at 17.80 (CP: 17.10) |
| Occidental Petroleum Corporation ( OXY) | Mar. 52.50 Puts | Stopped at 5.60 (CP: 5.25) |
| ProLogis ( PLD) | Feb. 115.00 Puts | Stopped at 10.90 (CP: 10.50) |
| Name | Option Sym. | Call to Sell | Call Price | Investment for 500 Shares | Annual Called Rtn. | Annual Static Rtn. | Downside Protection |
|---|---|---|---|---|---|---|---|
| NVIDIA Corporation $ 139.67 | O: 25B145.00D21 | Feb. 145.00 | 7.85 | $ 66,723.35 | 47.08% | 29.55% | 4.56% |
| Name | Action |
|---|---|
| Shake Shack Inc ( SHAK) - 129.50 | Sell the March 140.00 Calls. |
| Taiwan Semiconductor Manufacturing Co. (Taiwan) ADR ( TSM) - 207.36 | Sell the February 200.00 Calls. |
| Hewlett Packard Enterprise Company ( HPE) - 21.82 | Sell the March 22.00 Calls. |
| Fortinet Inc. ( FTNT) - 96.42 | Sell the March 97.50 Calls. |
| Pure Storage ( PSTG) - 63.80 | Sell the March 65.00 Calls. |
| Pure Storage ( PSTG) - 63.80 | Sell the March 65.00 Calls. |
| Norwegian Cruise Line Holdings Ltd. ( NCLH) - 26.13 | Sell the March 27.00 Calls. |
| Carnival Corporation ( CCL) - 25.73 | Sell the February 26.00 Calls. |
| Name | Covered Write |
|---|---|
|
|
|
Daily Equity & Market Analysis
Loading, Please Wait...
