Weekly Feature
Published: February 23, 2026
This content is for informational purposes only. This should not be construed as solicitation. The general public should consult their financial advisor for additional information related to investment decisions.
With no changes to any of the Invesco models this week, we look at the Invesco Semiconductors ETF (PSI).

There are no changes to any of the Invesco models this week. Technology has cooled a bit recently, as it has fallen to fourth in the DALI sector rankings, but still sits in equal-to-overweight territory. Meanwhile, semiconductors currently rank third out of 41 members in the NDW Group Matrix. Investors interested in adding semiconductors may wish to consider the Invesco Semiconductors ETF (PSI).

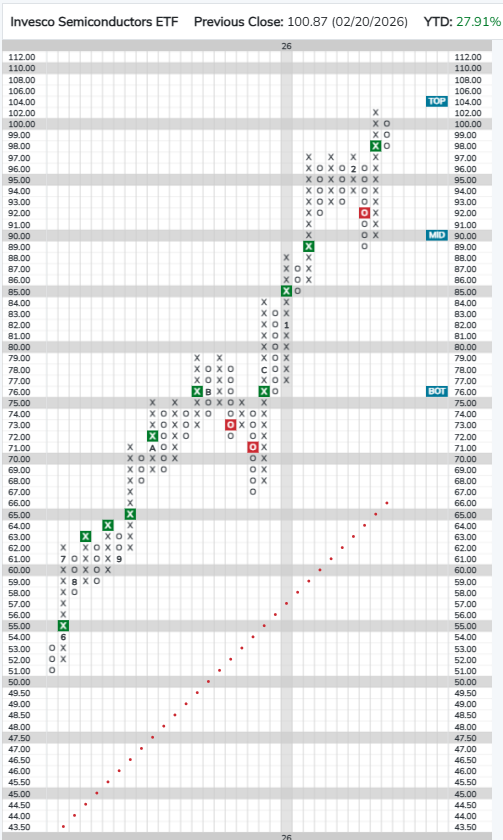
PSI currently has a near-perfect 5.96 fund score, which is 2.86 points better than the average for all technology and communications funds, and a positive 2.0 score direction. On its default chart, PSI returned to a buy signal earlier this month when it broke a quadruple top at $98 and continued higher, notching an all-time high at $102. PSI has subsequently pulled back to prior resistance offering a potential entry point for long exposure.

PSI closed at just under $101 on Friday (2/18) and sits in heavily overbought with a weekly overbought/oversold (OBOS) reading of 76%, so those looking to initiate position may be best served to look for a pullback to the mid-to-upper $90s. Year-to-date (through 2/18) PSI has gained 27.9% on a price return basis while the S&P 500 (SPX) is up a little under 1%.

Back to report

DISCLOSURE

**Unless otherwise stated, the performance numbers herein are based on price returns and do not include dividends or all transaction costs. Past performance is not indicative of future results. Potential for profits is accompanied by possibility of loss. PowerShares has arranged with Dorsey, Wright to provide this specialized ETF Point & Figure Analysis page on PowerShares sponsored products. The Point & Figure analysis, models and resulting rankings, including any information, data or commentary included herein, are created and provided solely by Dorsey, Wright & Associates. Such analysis, models and rankings should not be considered an offer to purchase or sell, or a solicitation of an offer to buy or purchase any security. The examples presented do not take into consideration commissions, tax implications, or other transactions costs. Neither Dorsey, Wright nor PowerShares through this ETF page provide investment advice or recommendations regarding any security, fund or market. As the investment professional making the final decision with respect to allocations, including any related suitability, fiduciary or other legal obligation, please remember to adhere to all applicable laws, regulations, and rules including NASD Rules 2090 and 2111. The percentage of the portfolio devoted to any ETF is at the sole discretion of the financial advisor or the customer, and not Dorsey, Wright & Associates or PowerShares. If you are not familiar with the Point & Figure methodology, we suggest you read "Point & Figure Charting, 4th Edition" by Thomas J. Dorsey and visit the PnF University, www.dorseywright.com. If you are not familiar with the PowerShares products, or Exchange Traded Funds (ETFs), we suggest you visit www.powershares.com.