Most Requested Symbols

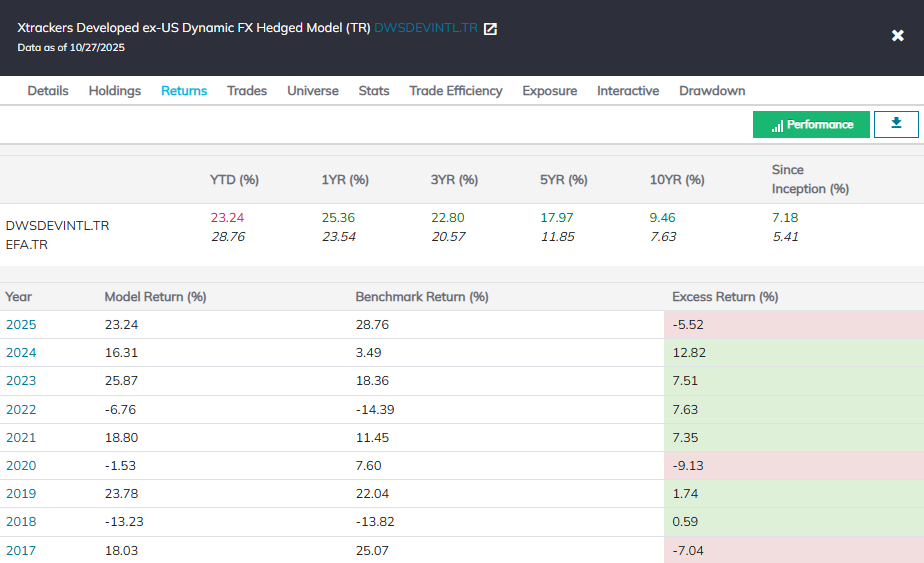
There were no changes to the suite of DWS models this week, so we’ll look at the Xtrackers Developed ex-US Dynamic FX Hedged Model (TR). This model looks at a universe of developed market currency-hedged Xtrackers ETFs and picks out the top three based on relative strength. As we touched on at length in our piece on the developed market momentum environment (click here for more), stability of leadership has been a tailwind for momentum strategies focused on developed markets. This is evident as the model has not made a trade in over five years yet has outperformed its benchmark by over 6% on a five-year annualized basis. At the same time, the currency hedged approach helps to reduce portfolio volatility as the model’s five-year standard deviation is 12.60 versus its benchmark’s, the iShares MSCI EAFE ETF (EFA), standard deviation of 16.23. While the model has slightly underperformed this year due to the weakness of the US Dollar, it has shown consistency over the years in what has been a great environment for developed market momentum strategies.

The table below is a review of important technical data on a select group of DWS Xtrackers ETFs. Significant changes within the past week are highlighted in Green if positive or Red if negative. This portfolio is designed to be used as a "radar" screen to bring your attention to potentially important technical changes that may require your attention and potential action. When evaluating the Fund Score, the strongest issues have scores of 4 or higher while those ETFs with scores below a 3 are no longer considered solid citizens.
Symbol
Name
Price
Fund Score
PnF Signal
RS Col.
PnF Trend
Weekly Mom
ASHR
Xtrackers Harvest CSI 300 China A-Shares ETF
33.58
5.65
Buy
X
Positive
-
6W
ASHS
Xtrackers Harvest CSI 500 China A-Shares ETF
37.56
5.76
Buy
X
Positive
-
6W
DBAW
Xtrackers MSCI All World ex US Hedged Equity ETF
41.15
5.45
Buy
X
Positive
+
5W
DBEF
Xtrackers MSCI EAFE Hedged Equity ETF
48.25
4.29
Buy
X
Positive
+
5W
DBEM
Xtrackers MSCI Emerging Markets Hedged Equity ETF
32.36
5.67
Buy
X
Positive
+
1W
DBEU
Xtrackers MSCI Europe Hedged Equity ETF
47.49
3.91
Buy
X
Positive
+
5W
DBEZ
Xtrackers MSCI Eurozone Hedged Equity ETF
54.78
5.13
Buy
X
Positive
+
5W
DBJP
Xtrackers MSCI Japan Hedged Equity ETF
91.58
5.83
Buy
X
Positive
+
2W
DEEF
Xtrackers FTSE Developed EX US Multifactor ETF
35.16
4.23
Buy
X
Positive
+
1W
DEUS
Xtrackers Russell US Multifactor ETF
58.22
3.71
Sell
O
Positive
-
7W
EASG
Xtrackers MSCI EAFE Selection Equity ETF
35.75
4.21
Buy
X
Positive
+
2W
EMCR
Xtrackers Emerging Markets Carbon Reduction and Climate Improvers ETF
37.77
5.80
Buy
X
Positive
+
1W
EMCS
Xtrackers MSCI Emerging Markets Climate Selection ETF
36.28
5.83
Buy
X
Positive
+
8W
HAUZ
Xtrackers International Real Estate ETF
23.88
4.10
Buy
X
Positive
+
1W
HDEF
Xtrackers MSCI EAFE High Dividend Yield Equity ETF
29.98
4.04
Buy
X
Positive
+
2W
SNPE
Xtrackers S&P 500 Scored & Screened ETF
62.14
5.27
Buy
X
Positive
+
1W
USSG
Xtrackers MSCI USA Selection Equity ETF
63.37
5.31
Buy
X
Positive
+
1W
Symbol
Name
Price
Fund Score
PnF Signal
RS Col.
PnF Trend
Weekly Mom
RVNU
Xtrackers Municipal Infrastructure Revenue Bond ETF
25.02
1.92
Buy
O
Positive
-
1W
The ETFs with the most relative strength buy signals (suggesting outperformance) versus the others in the group are listed at the top. These ETFs should be overweighted in the portfolio. Those ETFs with the least amount of relative strength buy signals versus the others in the group are listed at the bottom. These ETFs should be underweighted in the portfolio.
DWS Xtrackers Matrix Summary
| Ticker | Name | Buys | Xs |
Tech
Attribute/ Score |
|---|---|---|---|---|
| HDEF.TR | Xtrackers MSCI EAFE High Dividend Yield Hedged Equity ETF TR | 8 | 6 | 4.04 |
| DBJP.TR | Xtrackers MSCI Japan Hedged Equity ETF Total Return | 7 | 8 | 5.83 |
| DBEZ.TR | Xtrackers MSCI Eurozone Hedged Equity ETF Total Return | 7 | 4 | 5.13 |
| DBEM.TR | Xtrackers MSCI Emerging Markets Hedged Equity ETF TR | 6 | 7 | 5.67 |
| DBEF.TR | Xtrackers MSCI EAFE Hedged Equity ETF Total Return | 6 | 4 | 4.29 |
| DEEF.TR | Xtrackers FTSE Developed EX US Multifactor ETF TR | 5 | 6 | 4.23 |
| DBAW.TR | Xtrackers MSCI All World ex US Hedged Equity ETF Total Return | 5 | 4 | 5.45 |
| DEUS.TR | Xtrackers Russell US Multifactor ETF TR | 5 | 0 | 3.71 |
| ASHR.TR | Xtrackers Harvest CSI 300 China A-Shares ETF TR | 3 | 10 | 5.65 |
| DBEU.TR | Xtrackers MSCI Europe Hedged Equity ETF Total Return | 3 | 1 | 3.91 |
| HAUZ.TR | Xtrackers International Real Estate ETF Total Return | 0 | 4 | 4.10 |

| ETF Name | Symbol | NDW Suggested Weighting | Yield | Date Added |
|---|---|---|---|---|
| Xtrackers MSCI Eurozone Hedged Equity ETF Total Return | DBEZ.TR | 20.000% | 3.4175 | 09/20/2021 |
| Xtrackers MSCI Japan Hedged Equity ETF Total Return | DBJP.TR | 20.000% | 3.0808 | 03/14/2022 |
| Xtrackers MSCI EAFE High Dividend Yield Hedged Equity ETF TR | HDEF.TR | 20.000% | 3.9584 | 10/06/2025 |
| Xtrackers Russell 1000 US Quality at a Reasonable Price ETF TR | QARP.TR | 20.000% | 1.2385 | 02/03/2020 |
| Xtrackers MSCI USA Selection Equity ETF TR | USSG.TR | 20.000% | 1.0508 | 02/03/2020 |
* - Dates prior to 9/6/2016, which is when the Xtrackers Global Model Portfolio became available in the DWS Weekly ETF Report, are representative of when the position was added to the backtested model.
| ETF Name | Symbol | NDW Suggested Weighting | Yield | Date Added |
|---|---|---|---|---|
| Xtrackers MSCI EAFE Hedged Equity ETF Total Return | DBEF.TR | 25.000% | 3.6955 | 08/02/2021 |
| Xtrackers MSCI Eurozone Hedged Equity ETF Total Return | DBEZ.TR | 25.000% | 3.4175 | 03/29/2021 |
| Xtrackers MSCI Japan Hedged Equity ETF Total Return | DBJP.TR | 25.000% | 3.0808 | 03/23/2020 |
| Xtrackers MSCI EAFE High Dividend Yield Hedged Equity ETF TR | HDEF.TR | 25.000% | 3.9584 | 09/22/2025 |
* - Dates prior to 9/6/2016, which is when the Xtrackers All World Ex US Model Portfolio became available in the DWS Weekly ETF Report, are representative of when the position was added to the backtested model.
| ETF Name | Symbol | NDW Suggested Weighting | Yield | Date Added |
|---|---|---|---|---|
| Xtrackers MSCI EAFE Hedged Equity ETF Total Return | DBEF.TR | 33.333% | 3.6955 | 07/22/2019 |
| Xtrackers MSCI Eurozone Hedged Equity ETF Total Return | DBEZ.TR | 33.333% | 3.4175 | 06/24/2016 |
| Xtrackers MSCI Japan Hedged Equity ETF Total Return | DBJP.TR | 33.333% | 3.0808 | 03/23/2020 |
* - Dates prior to 9/6/2016, which is when the Xtrackers Developed Intl Equity Model Portfolio became available in the DWS Weekly ETF Report, are representative of when the position was added to the backtested model.
DWS (Tue.)
LISTEN TO PODCAST
Apr 23, 2026
Loading, Please Wait...
