Most Requested Symbols

With the start of November, we have also officially moved into the “seasonally strong” half of the year, which lasts from November through April.
NDW Morning Pulse - November 2, 2026
NDW Morning Update Video – November 2, 2026.
| Below are highlights from the NDW Morning Update Video for the morning of 11/2/2026. Access the video on the NDW Morning Update Video page.
|
Below are highlights from the NDW Morning Update Video for the morning of 11/2/2026. Access the video on the NDW Morning Update Video page.

With the start of November, we have also officially moved into the “seasonally strong” half of the year, which lasts from November through April. We are all familiar with the saying "sell in May and go away," which proposes that portfolio growth would do about as well if all holdings were sold as they would be if invested in the market from May through October. Typically, conjecture doesn’t mature into an adage without basis and market seasonality is just such an example as it has shown an impressive trend in terms of magnitude, consistency, and longevity. We’ve discussed seasonality many times over the years and as we switch between seasonally biased periods, we wanted to revisit the subject today.
The end of trading on Friday, October 30 brought the end of the seasonally weak period, which began with the close of the market on Thursday, April 30, 2025. Over this period, the Dow Jones Industrial Average (.DJIA) returned 4.27%, marking the third consecutive year of positive gains during the seasonally weak period
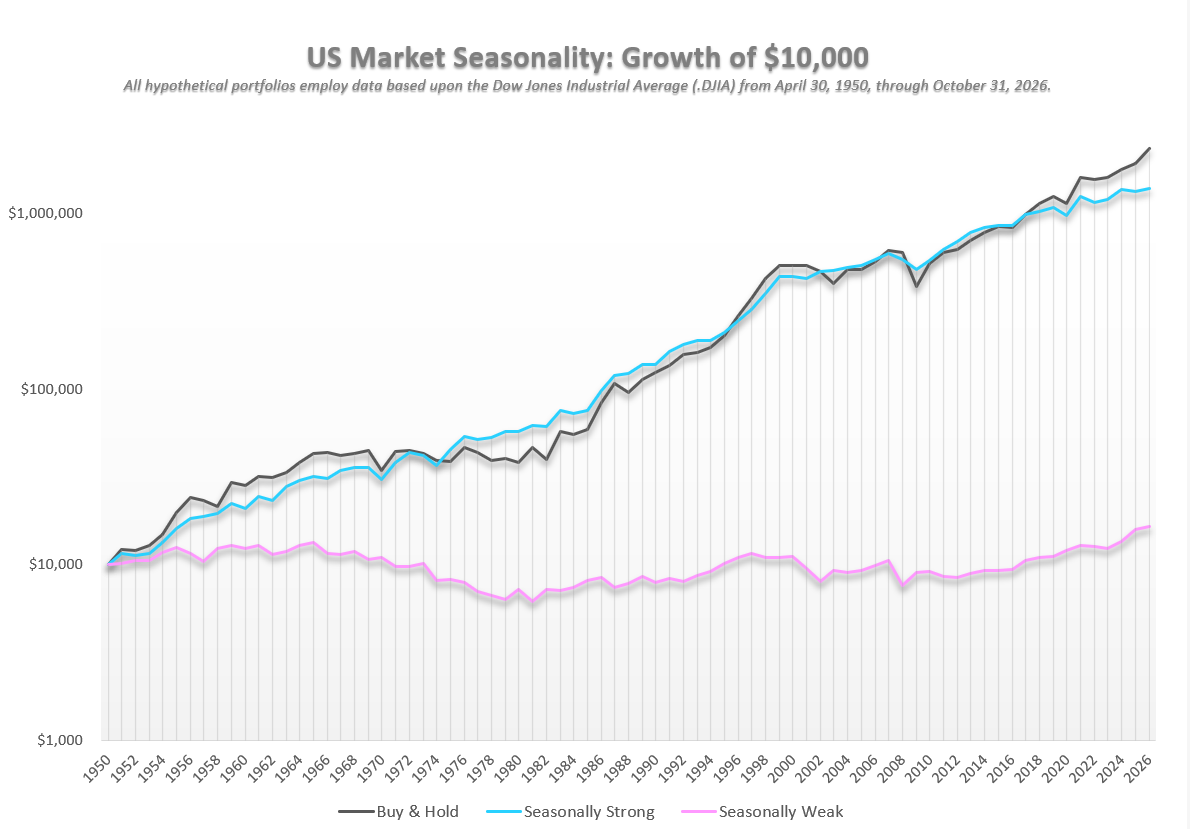
Years ago, we began using the Stock Trader's Almanac, a reference tool published by Yale Hirsch that has been a fantastic source of information on the stock market ever since. In fact, we always order several copies for the office each year (if you would like a copy, you can visit www.stocktradersalmanac.com). The premise of the "Market Seasonality" study is that historically speaking, the market performs far better during the November to May period than it does from May to November. On its own, that isn't a particularly profound statement. However, when we examine the magnitude of this effect over the years, its significance becomes clear. Consider this: if you had invested $10,000 in the Dow Jones on April 30 and sold it on October 31 each year since 1950, your cumulative return would be only about $16,598. Meanwhile, the same $10,000, invested only during the seasonally strong six months of the year, would now be worth a little under $1.4 million. Put another way, almost all the growth of the Dow since 1950 has effectively occurred during the "good" six months of the year.

In the graph below, we have reproduced the US Market Seasonality strategy that was first published in the Stock Trader's Almanac beginning in 1950 based upon the Dow Jones Industrial Average. The pink line reflects the seasonally weak period, while the blue line shows the seasonally strong six months. You will note that a theoretical $10,000 initial investment in 1950 is barely on the positive side when invested only from May through November. On the other hand, an identical $10,000 initial investment grew to $1.4 million with an average annualized return of 6.70% if invested only from November through May each year.
Market Seasonality Notes
We acknowledge that this study is not a sophisticated tool for risk management, but it is interesting and does expose biases within the market. The most recent seasonally weak period was better than what history would dictate, but markets have still consolidated over the past few months. The upcoming seasonally strong period could provide a catalyst for major indices to resume their upside, especially given their long-term strength. Domestic equities recently moved back to the top of DALI’s asset class rankings while most participation indicators are starting to rebound, highlighting a favorable outlook for the group as we look ahead to the next six months.
Average Level
-9.91
| < - -100 | -100 - -80 | -80 - -60 | -60 - -40 | -40 - -20 | -20 - 0 | 0 - 20 | 20 - 40 | 40 - 60 | 60 - 80 | 80 - 100 | 100 - > |
|---|---|---|---|---|---|---|---|---|---|---|---|
|
Sell signalagg
|
|||||||||||
|
Buy signalicf
|
|||||||||||
|
Buy signaltlt
|
|||||||||||
|
Sell signalVOOG
|
Sell signaldvy
|
||||||||||
|
Buy signalONEQ
|
Sell signalhyg
|
Buy signalrsp
|
|||||||||
|
Sell signalgld
|
Sell signalQQQ
|
Buy signalefa
|
Buy signalief
|
||||||||
|
Sell signalfxe
|
Buy signalxlg
|
Buy signalSPY
|
Buy signaldia
|
Buy signalijr
|
Buy signalGSG
|
Buy signaldx/y
|
|||||
|
Sell signalEEM
|
Buy signalGCC
|
Buy signaliwm
|
Buy signalIJH
|
Sell signallqd
|
Sell signalshy
|
Buy signalVOOV
|
Buy signalUSO
|
||||
| < - -100 | -100 - -80 | -80 - -60 | -60 - -40 | -40 - -20 | -20 - 0 | 0 - 20 | 20 - 40 | 40 - 60 | 60 - 80 | 80 - 100 | 100 - > |
| AGG | iShares US Core Bond ETF |
| USO | United States Oil Fund |
| DIA | SPDR Dow Jones Industrial Average ETF |
| DVY | iShares Dow Jones Select Dividend Index ETF |
| DX/Y | NYCE U.S.Dollar Index Spot |
| EFA | iShares MSCI EAFE ETF |
| FXE | Invesco CurrencyShares Euro Trust |
| GLD | SPDR Gold Trust |
| GSG | iShares S&P GSCI Commodity-Indexed Trust |
| HYG | iShares iBoxx $ High Yield Corporate Bond ETF |
| ICF | iShares Cohen & Steers Realty ETF |
| IEF | iShares Barclays 7-10 Yr. Tres. Bond ETF |
| LQD | iShares iBoxx $ Investment Grade Corp. Bond ETF |
| IJH | iShares S&P 400 MidCap Index Fund |
| ONEQ | Fidelity Nasdaq Composite Index Track |
| QQQ | Invesco QQQ Trust |
| RSP | Invesco S&P 500 Equal Weight ETF |
| IWM | iShares Russell 2000 Index ETF |
| SHY | iShares Barclays 1-3 Year Tres. Bond ETF |
| IJR | iShares S&P 600 SmallCap Index Fund |
| SPY | SPDR S&P 500 Index ETF Trust |
| TLT | iShares Barclays 20+ Year Treasury Bond ETF |
| GCC | WisdomTree Continuous Commodity Index Fund |
| VOOG | Vanguard S&P 500 Growth ETF |
| VOOV | Vanguard S&P 500 Value ETF |
| EEM | iShares MSCI Emerging Markets ETF |
| XLG | Invesco S&P 500 Top 50 ETF |

| Symbol | Company | Sector | Current Price | Action Price | Target | Stop | Notes |
|---|---|---|---|---|---|---|---|
| CENTA | Central Garden & Pet Company | Household Goods | $39.15 | mid-to-hi 30s | 48 | 31 | 4 for 5'er, favored HOUS sector, LT pos peer RS, spread quad top, buy on pullback, Earn. 11/25 |
| WDAY | Workday Inc. | Software | $197.82 | low 190s to hi 200s | 230 | 178 | 4 for 5'er, Top half of SOFT sector matrix, Pos. LT Mkt. RS, Pos. Trend. |
| PANW | Palo Alto Networks Inc | Software | $365.87 | 360s - 380s | 472 | 308 | 4 for 5'er, top half of favored SOFT sector matrix, LT pos peer RS, Earn. 11/19 |
| WSM | Williams-Sonoma, Inc. | Retailing | $252.72 | 240s - 250s | 344 | 212 | 5 for 5'er, top 25% of RETA sector matrix, LT pos peer & mkt RS, R-R>2.0, Earn. 11/18 |
| A | Agilent Technologies, Inc | Healthcare | $174.87 | 170s - 180s | 196 | 154 | 4 for 5'er, top quartile of Healthcare matrix, Pos. LT Peer RS, One Box from Mkt. RS Buy, Earn. 11/25 |
| CACI | CACI International Inc. | Computers | $675.62 | 630s - 660s | 776 | 568 | 4 for 5'er, top third of COMP sector matrix, LT pos market RS, spread quadruple top |
| EHC | Encompass Health Corp. | Healthcare | $135.90 | low 120s - low 130s | 151 | 108 | 4 for 5'er, Pos. LT. Mkt. and Peer RS, top half of Healthcare matrix, ATH on 10/29. |
| EAT | Brinker International Inc | Restaurants | $212.18 | hi 200s - 210s | 270 | 182 | 4 for 5'er, top third of favored REST sector matrix, spread triple top, good R-R |
| Symbol | Company | Sector | Current Price | Action Price | Target | Stop | Notes |
|---|---|---|---|---|---|---|---|
| AVGO | Broadcom Ltd | Semiconductors | $326.08 | (320s - 340s) | 264 | 384 | 1 for 5'er, unfavored SEMI sector matrix, new market RS sell signal, negative trend flip |
| Symbol | Company | Sector | Current Price | Action Price | Target | Stop | Notes |
|---|---|---|---|---|---|---|---|
| SWK | Stanley Black & Decker, Inc. | Machinery and Tools | $103.44 | hi 80s - mid 90s | 111 | 75 | Removed for earnings. Raise stop to $85. Earn. 11/4 |
| Comment | |||||||
|---|---|---|---|---|---|---|---|
|
|
|||||||
EAT Brinker International Inc R ($213.38) - Restaurants - EAT is a 4 for 5'er that ranks in the top third of the favored restaurants sector matrix. After giving four consecutive sell signals on its default chart, EAT returned to a buy signal when it completed a bearish signal reversal at $196. In last week's trading, the stock gave a second consecutive buy signal when it broke a spread triple top at $216. Long exposure may be added in the high $200s to $210s and we will set our initial stop at $182, a potential spread triple bottom break on EAT's default chart that would also violate its bullish support line. We will use the bullish price objective, $270, as our target price, giving us a reward-to-risk ratio approaching 2.0.
| 252.00 | X | X | 252.00 | ||||||||||||||||||||||||||
| 248.00 | X | O | X | X | O | 248.00 | |||||||||||||||||||||||
| 244.00 | X | O | X | O | X | O | 244.00 | ||||||||||||||||||||||
| 240.00 | X | O | X | O | X | O | 240.00 | ||||||||||||||||||||||
| 236.00 | X | O | O | X | O | 236.00 | |||||||||||||||||||||||
| 232.00 | X | O | X | O | 232.00 | ||||||||||||||||||||||||
| 228.00 | X | O | O | X | 228.00 | ||||||||||||||||||||||||
| 224.00 | X | 9 | X | O | 224.00 | ||||||||||||||||||||||||
| 220.00 | X | O | X | O | 220.00 | ||||||||||||||||||||||||
| 216.00 | 8 | O | X | X | O | 216.00 | |||||||||||||||||||||||
| 212.00 | X | O | X | O | X | X | X | O | Mid | 212.00 | |||||||||||||||||||
| 208.00 | X | O | X | O | X | O | X | O | X | 208.00 | |||||||||||||||||||
| 204.00 | X | O | O | X | O | X | O | X | 204.00 | ||||||||||||||||||||
| 200.00 | X | O | X | O | X | X | O | X | 200.00 | ||||||||||||||||||||
| 198.00 | X | O | X | O | A | O | X | O | X | 198.00 | |||||||||||||||||||
| 196.00 | X | X | O | X | O | X | O | X | O | X | 196.00 | ||||||||||||||||||
| 194.00 | X | O | X | O | O | X | O | X | X | O | X | 194.00 | |||||||||||||||||
| 192.00 | X | X | O | X | O | O | X | O | X | O | X | 192.00 | |||||||||||||||||
| 190.00 | X | O | X | O | X | O | X | O | X | O | X | 190.00 | |||||||||||||||||
| 188.00 | X | O | X | O | X | O | O | X | O | X | 188.00 | ||||||||||||||||||
| 186.00 | X | O | X | O | X | O | X | O | X | • | 186.00 | ||||||||||||||||||
| 184.00 | X | O | X | O | X | O | O | • | 184.00 | ||||||||||||||||||||
| 182.00 | X | O | X | O | • | • | 182.00 | ||||||||||||||||||||||
| 180.00 | X | X | O | X | • | 180.00 | |||||||||||||||||||||||
| 178.00 | X | O | X | O | • | 178.00 | |||||||||||||||||||||||
| 176.00 | X | X | O | X | • | 176.00 | |||||||||||||||||||||||
| 174.00 | X | O | X | O | X | • | 174.00 | ||||||||||||||||||||||
| 172.00 | X | O | X | O | X | • | 172.00 | ||||||||||||||||||||||
| 170.00 | X | O | 7 | O | • | 170.00 | |||||||||||||||||||||||
| 168.00 | X | O | X | • | 168.00 | ||||||||||||||||||||||||
| 166.00 | X | O | X | • | 166.00 | ||||||||||||||||||||||||
| 164.00 | X | O | • | 164.00 | |||||||||||||||||||||||||
| 162.00 | X | • | 162.00 | ||||||||||||||||||||||||||
| 160.00 | X | • | 160.00 | ||||||||||||||||||||||||||
| 158.00 | X | • | 158.00 | ||||||||||||||||||||||||||
| 156.00 | X | • | 156.00 | ||||||||||||||||||||||||||
| 154.00 | X | • | Bot | 154.00 |
| AXP American Express Company ($328.83) - Finance - AXP shares moved higher today to break a double top at $328 to mark its first buy signal. This 3 for 5'er is now two boxes away from moving into a positive trend and has been on an RS buy signal versus the market since February 2022. AXP shares are trading in normalized territory with a weekly overbought/oversold reading of 3%. From here, support is offered at $312. |
| CBRE CBRE Group, Inc. ($137.57) - Real Estate - CBRE shares moved higher today to break a triple top and enter a positive trend. This 3 for 5'er has been on an RS buy signal versus the market since March 2019. CBRE is actionable at current levels and moved back above its ten-week moving average with today's action. From here, support is offered at $122. |
| CHDN Churchill Downs Inc ($98.99) - Gaming - CHDN broke a double top at $95 for a third buy signal and to clear resistance that dated to June of 2026 as shares rallied to $99. Within the past week's time, CHDN has increased from a 1 to 4 technical attribute rated stock with the market RS chart seeing a reversal in Xs, the peer RS chart returning to an RS buy, and the trend chart shifting back to positive. The breakout has brought CHDN into overbought territory, so look for a pullback to the mid to lower $90s before considering. Initial support lies at $91, while additional can be found at $82 and $78, the bullish support line. |
| DAL Delta Air Lines Inc. ($83.16) - Aerospace Airline - DAL broke a double top at $83 to count as a second buy signal and complete a bullish catapult. This follows the chart shifting back into a positive trend in the latter stages of October, which increased the stock to a 4 for 5'er in attribute rating. Okay to consider here on the breakout. Note resistance at $86 and at prior highs in the mid $90s. Support lies in the upper to mid $70s. |
| HLT Hilton Worldwide Holdings Inc ($362.72) - Leisure - HLT broke a double top at $368 for a second buy siganl since the middle of October. The stock has been a 5 for 5'er since seeing the trend move back to positive upon the return to a buy signal, and HLT has worked its way back into the top half of the Leisure sector matrix. The breakout has brought the chart into overbought terrritory, so look for a pullback to the $340 to $350 range before considering. Initial support lies at $336, while the bullish support line sits at $308. |
| LITE Lumentum Holdings Inc ($684.60) - Telephone - Shares of LITE fell sharply on news of a potential acquisition by MRVL, causing it to fall more than 15%, breaking a double bottom at $736. The 3 for 5'er has lost its near-term relative strength, bringing it down to more of a hold, with it now in danger of moving back to a negative trend as well. Those holding on can keep their positions for now, but should watch closely for further weakness. The bullish support line sits nearby at $632. |
| OKE ONEOK, Inc. ($93.02) - Oil Service - OKE fell to a sell signal Monday when it broke a double bottom at $93. Monday's move adds to an already negative outlook as OKE is a 2 for 5'er that ranks in the bottom half of the oil service sector matrix. From here, the next level of support sits at $91. |
| RPM RPM, Inc. ($107.70) - Chemicals - RPM gave a second consecutive buy signal and moved to a positive trend Monday when it broke a spread triple top at $104. The outlook for the stock remains negative, however, as even with the positive trend flip, RPM is an unfavorable 2 for 5'er. From here, overhead resistance sits at $116 while support can be found at $98. |
| SMG The Scotts Company ($65.24) - Chemicals - SMG returned to a buy signal and a positive trend Monday when it broke a triple top at $64. The outlook for the stock remains negative, however, as even with the positive trend change SMG is an unfavorable 2 for 5'er. From here, the net level of overhead resistance sits at $69. Meanwhile, support can be found at $48. |
| STX Seagate Technology ($589.00) - Computers - Shares of STX broke a double bottom at $616 for its fifth consecutive sell signal. The stock has weakened significantly over the last few months, falling down to sell territory as a 2 for 5'er. The stock is now in heavily oversold territory, so investors with positions could potentially hope for some consolidation or rebound in the near-term. However, its lack of long-term strength means investors should likely cut the position loose eventually. |

The option suggestions featured here are pulled from the NDW Options Ideas tool. These are just a sample of the ideas that can be found there. The Options Idea tool contains numerous additional income and speculative plays. It also offers relative strength-based screens targeting the highest (and lowest) relative strength stocks and ETFs that have recently moved counter to their longer-term trend. To access or subscribe to the Options Ideas tool, click here.
Call
The Charles Schwab Company (SCHW) Feb 19 $87.50 Call

| Additional Data: | |
| Bid/Ask Spread | 3.97% |
| Delta | 60.14 |
| Gamma | 2.94 |
| Implied Volatility | 27.68% |
| Expiry Date | 109 |
| Earnings Date | 1/21/2027 |
Put
Agnico-Eagle Mines (AEM) Feb 19 $170 Put

| Additional Data: | |
| Bid/Ask Spread | 11.35% |
| Delta | -44.22 |
| Gamma | 1.01 |
| Implied Volatility | 43.23% |
| Expiry Date | 109 |
| Earnings Date | 2/11/2027 |
Income
Delta Air Lines (DAL) Dec 4 $77 Put

| Additional Data: | |
| Ann. Static Return | 26.81% |
| Bid/Ask Spread | 60.29% |
| Delta | 25.33 |
| Gamma | -2.94 |
| Implied Volatility | 42.36% |
| Expiry Date | 32 |
| Earnings Date | 1/13/2027 |
Daily Equity & Market Analysis
Loading, Please Wait...

