Most Requested Symbols

The S&P 500 had one of its best rolling two-month performances in history ending on 5/29/2026. SPX gained 19.49% over that two-month span.
Today we update our report on the "failed breakout" pattern, where a stock fails to sustain price action above a critical level of old resistance after breaking into a positive trend. We also uncover several stocks that might be at risk of breakdowns despite recent upward movement.
Weekly Rundown Video – June 3, 2026
Weekly rundown with NDW analyst team covering all major asset classes.
Weekly rundown with NDW analyst team covering all major asset classes.
There has been a lot of, “this hasn’t happened since…” talk in the market recently. Technology and semiconductors continue to carry the market higher despite some concerning price action in other important areas of the market. Nonetheless, the S&P 500 had one of its best rolling two-month performances in history ending on 5/29/2026. SPX gained 19.49% over that two-month span. Since the S&P 500’s inception in 1957, there have been only nine other times performance has been better than 19.49% over a rolling two-month period (excluding clusters within 30 days). The forward returns are staggeringly strong with the average 1-month forward return north of 5%. Longer-dated timeframes are even better with the average 1-year and 2-year forward returns over 25%.
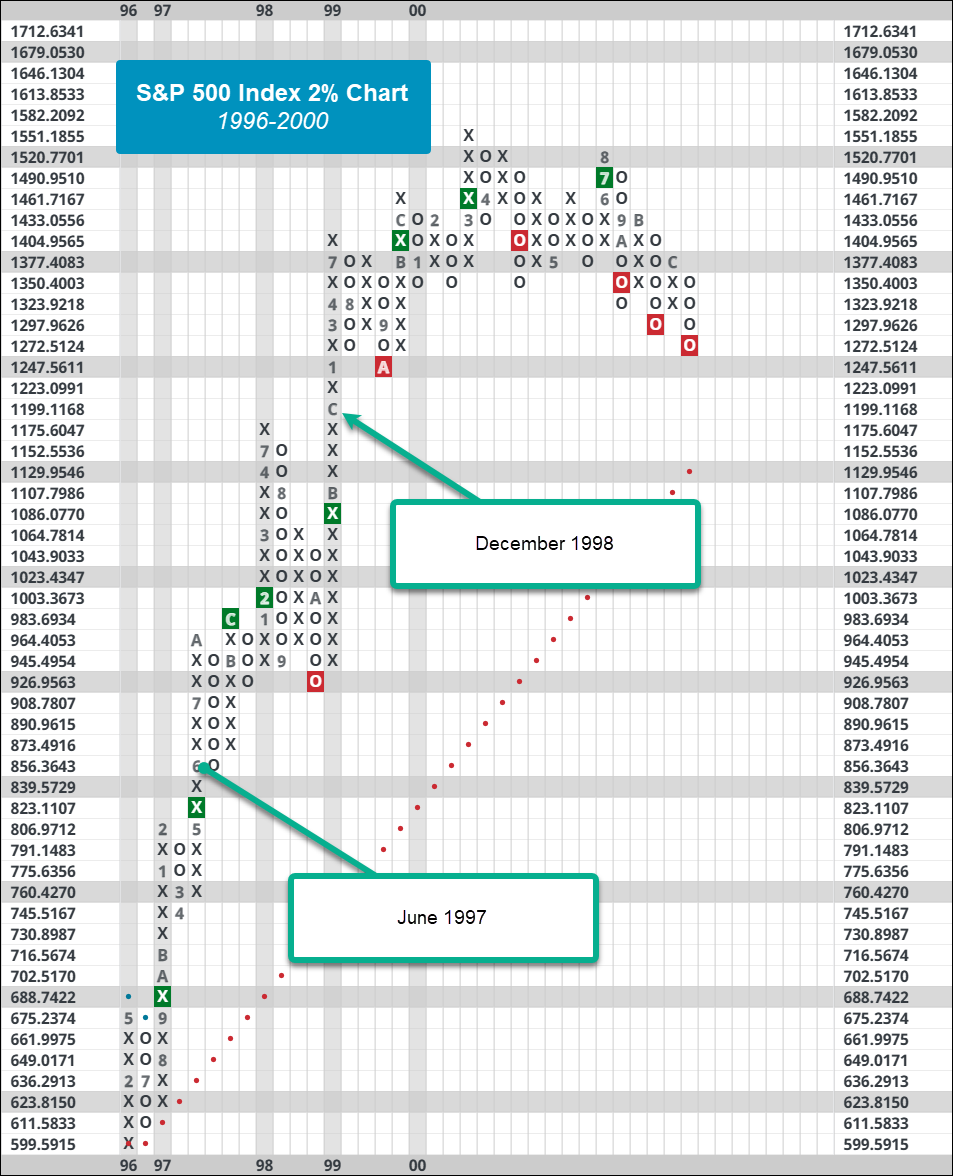
The market is usually only able to put together these sorts of runs in the short term near a major bottom event. While the recent rally started with the S&P 500 down just over 9% from its all-time high, that is the mildest drawdown from all-time highs on the day the two-month rally started. The only comparable period would be June 1997. A similar rally would take place late the next year, but the SPX was down almost 20% from all-time highs when that rally started, highlighting that the late 90s bull market had wild swings to the upside and downside. Some of the occurrences around major bottoms include early 1975, October 1982, May 2009, and May 2020. Interestingly, this is similar to the rally following the tariff tantrum last year, and that ended up boding well for the market as the S&P 500 is up over 25% over the last year.

Focusing on the trailing 1yr return column, usually the market had not been doing well over the prior year leading into such a strong two-month rally. This is slightly different than the percent from all-time high metric and can be used to add context to the market type at the time. This recent rally was only the second time that the trailing one-year return was positive with the only other time being 1997. That isn’t necessarily bearish either, the market still had another almost three years to run. Although, that is just one other occurrence, so it’s hard to look too much into it. Nonetheless, these face ripping rallies over the short-term tend to be pretty good for both short-term and long-term returns. While there are plenty of legitimate reasons to be worried right now, until we see price action weaken there is not much else to do except to party on.

To open the year, our team did a deeper dive into this idea of “consistency” on any asset’s individual PnF chart. In this case, we studied the idea of avoiding “failed breakouts”, defined by a stock moving back into a positive trend but ultimately falling back lower. More often than not, these failed breakouts came on the back of the stock showing a distinct inability to sustain price action at or above a distinguished previous high, tipping off the astute analyst that the trend break might not be all that convincing. The full article is linked here, for those of you who want a more detailed definition of a “failed breakout” (or maybe just want to check out the “mystery” failed breakout at the end). Today’s feature will discuss some follow-up of our previously flagged failed breakouts, as well as provide a handful of assets that currently exhibit similar technical pictures as we move into June.
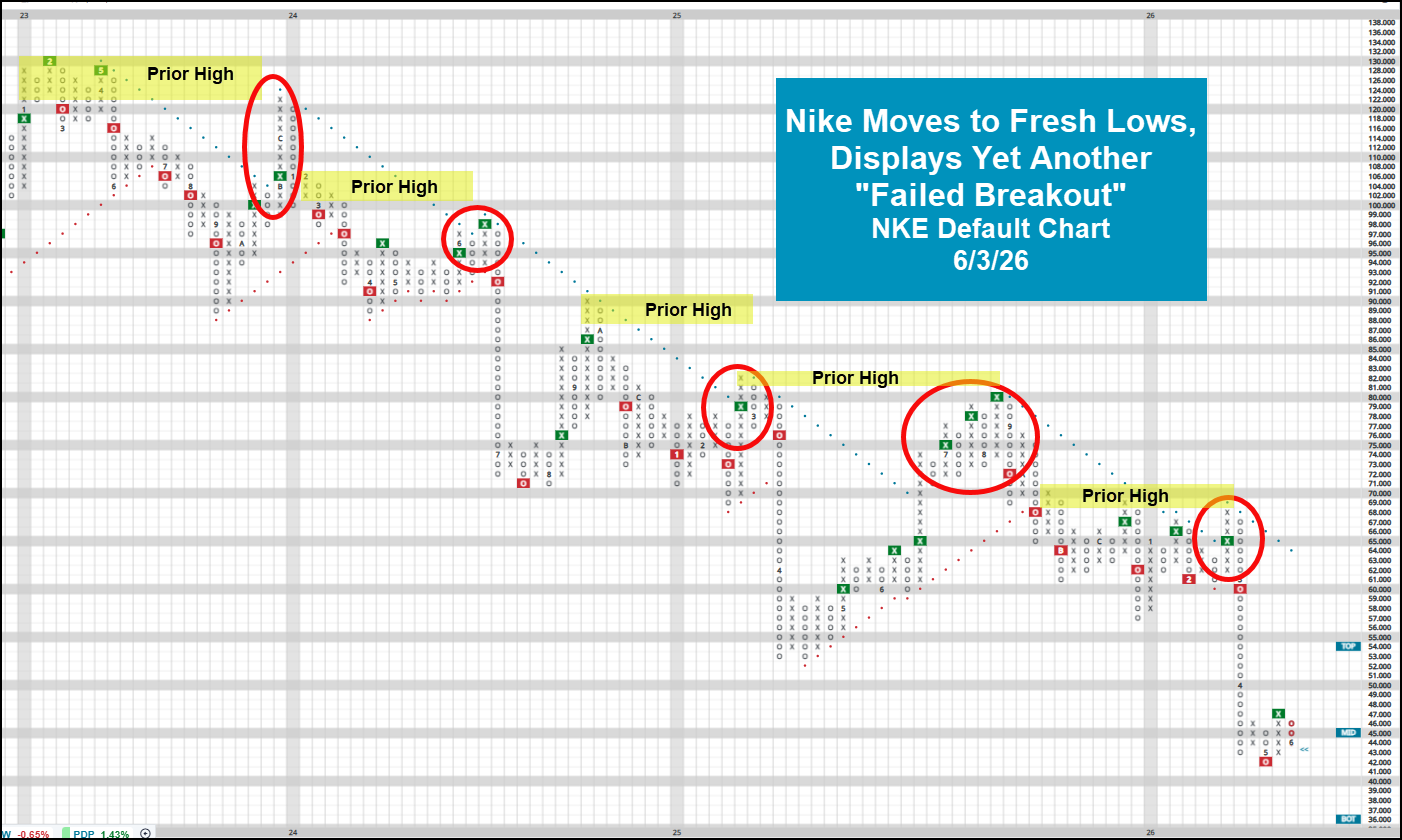
The genesis for this entire study in January arose when Nike (the poster child of “failed breakouts”) neared a test of its negative trend line back in January. Around the office, the analyst team then discussed/observed how infrequently the last few trend breaks led to further upside for NKE as it often failed to advance pasted a point of old resistance, commenting that even a positive trend break wouldn’t be enough to “convince” most of us that the stock had turned a new leaf. From there, we started looking at other charts that showed similar pictures over time to see if any patterns emerged. Chipotle Mexican Grill (CMG) (2025), Exxon Mobil (XOM) (2016-2019), Caterpillar (CAT) (2018-2020), UnitedHealth Group (UNH) (2025), and Meta Platforms (META) (2021-2022) all had markings consistent with a “failed breakout” at the time. Even larger indices aren’t immune, seeing the likes of SPX, RUT, etc. display their fair share of examples over the years. Fast forward to 6/3, it turns out that NKE did in fact manage to return back to a positive trend back in February…. Only to quickly turn around move to new lows like clockwork. The chart of NKE below helps provide a visual representation of these failed breakouts over time, for those of you still trying to grasp what exactly these charts look like in practice.
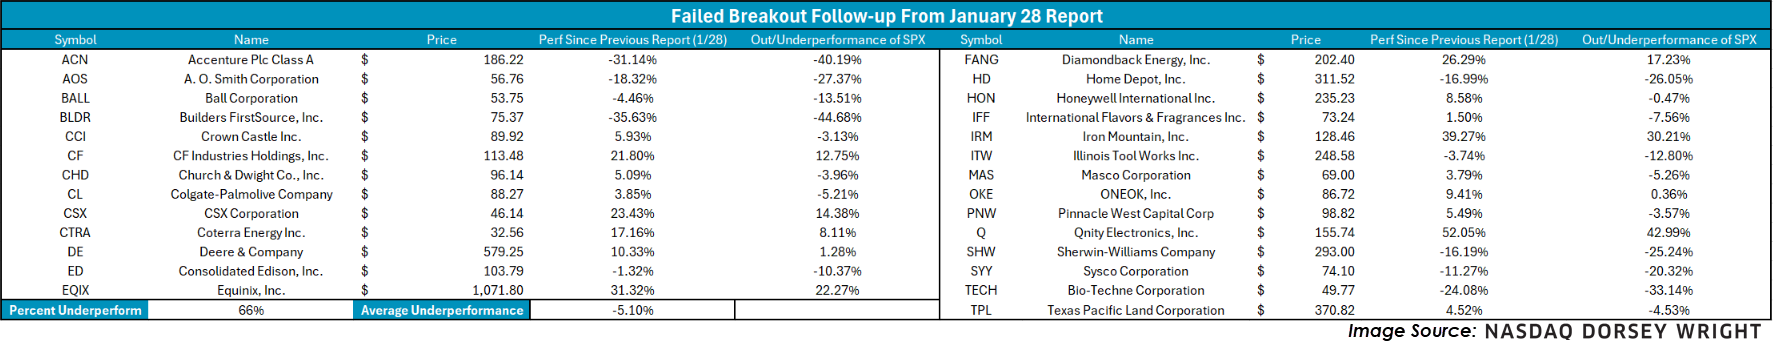
This certainly wont be the case every time…. There are undoubtedly a whole host of trend breaks that are in fact the start of a more defined uptrend, but an asset being able to break past previous highs (in addition to the trend break) seems to be important for setting the “tone” of the new break. The table below breaks down performance since 1/28 for the 27 previous members of our “possible failed breakout” screen described in our prior report. 66% of the names detailed in the report have underperformed the broader S&P 500 over the last few months, by an average of 5.10%. There are, of course, trends that did end up working out (see IRM, which has turned into a perfect 5/5’er) but the wide majority of names continue to exhibit technical weakness.
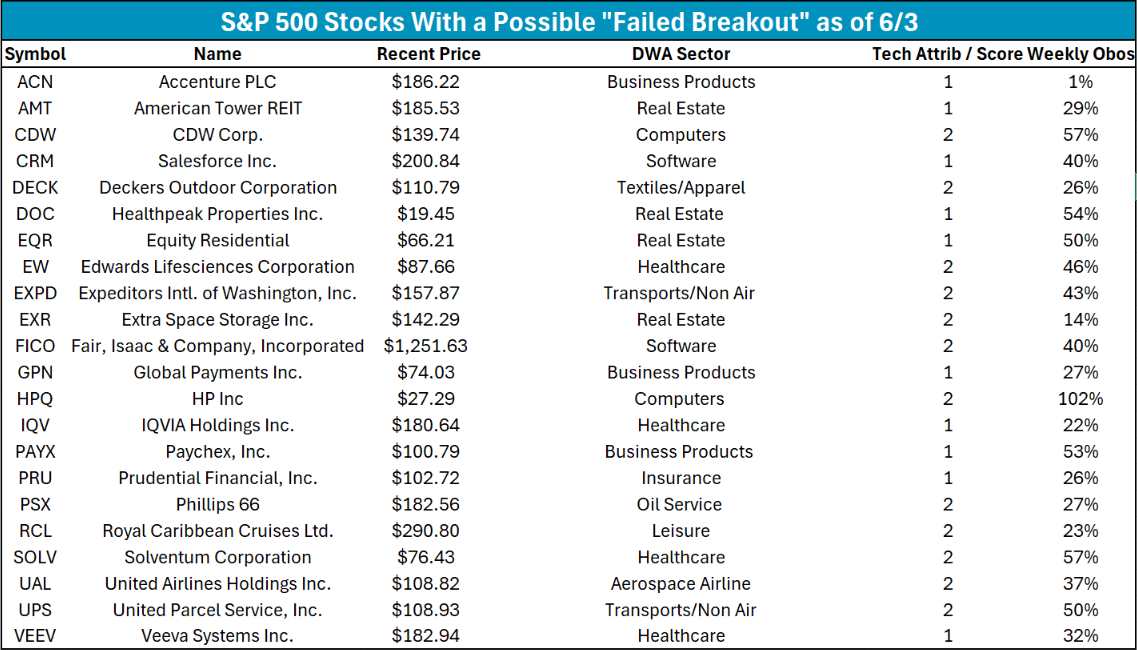
Of course, most of you don’t particularly care about the failed breakouts from 6 months ago… but more so what S&P 500 names are worth watching for possible false breakouts as we wrap up Q2. Anecdotally, these names could be hit quite hard if broader markets decide to roll over into the back half of the year, so knowing which options might be on thin ice could be important as you “pull the weeds” in your portfolio. Utilizing a similar screen to that from our 1/28 report, we can identify 22 S&P 500 stocks that have similar technical pictures to those that might flag as a “failed breakout” at the time of this writing. Consider fishing from this pond if you’re looking for some short ideas on breakdowns… or maybe take this as a “buyer beware” if you currently have exposure to these names.
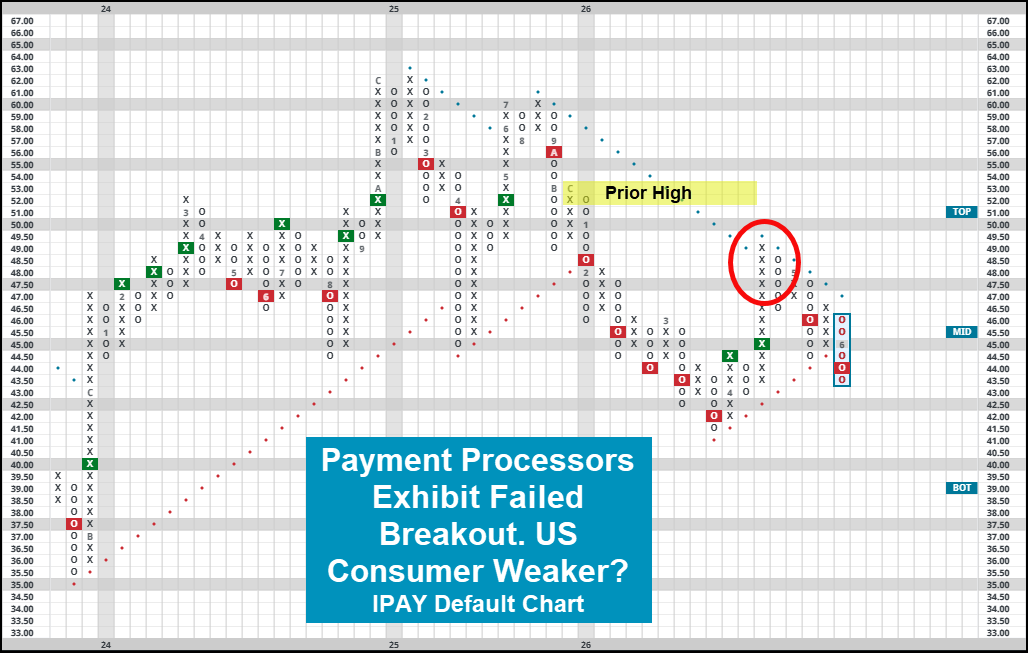
We will wrap up today’s commentary with a final word on two other areas that recently exhibited failed breakouts. Bitcoin representative IBIT has moved swiftly back towards 2026 lows after failing to sustain price action around recent highs from the back half of 2025, recently returning back to a negative trend over the last few days. The outlook for bitcoin (or the broader crypto space for that matter) remains bleak as we wrap up Q2. Payment processors, evidenced by ETF IPAY (below) have also moved lower recently, falling back into a negative trend with action on 6/3. The fund has put in a series of lower tops since its 2025 highs, and the failure to sustain action in the upper $40 range confirms the idea that the space has weakened materially. There are certainly comments (outside the scope of this update) on what a weaker payment processor means for the health of the US consumer, but we won’t touch on that here. Remember, when used in tandem with other tools on the platform, like the technical attribute/fund scoring system, noticing important points of support can help you identify which stocks might actually be breaking out…. And which are just a wolf in sheep’s clothing.
Each week the analysts at NDW review and comment on all major asset classes in the global markets. Shown below is the summary or snapshot of the primary technical indicators we follow for multiple areas. Should there be changes mid-week we will certainly bring these to your attention via the report.
| Universe | BP Col & Level (actual) | BP Rev Level | PT Col & Level (actual) | PT Rev Level | HiLo Col & Level (actual) | HiLo Rev Level | 10 Week Col & Level (actual) | 10 Week Rev Level | 30 Week Col & Level (actual) | 30 Week Rev Level |
|---|---|---|---|---|---|---|---|---|---|---|
| ALL |
|
46% |
|
42% |
|
62% |
|
48% |
|
42% |
| NYSE |
|
46% |
|
48% |
|
60% |
|
50% |
|
48% |
| OTC |
|
36% |
|
32% |
|
62% |
|
46% |
|
40% |
| World |
|
44% |
|
40% |
|
|
|
48% |
|
48% |

Remember, these are technical comments only. Just as you must be aware of fundamental data for the stocks we recommend based on technical criteria in the report, so too must you be aware of important data regarding delivery, market moving government releases, and other factors that may influence commodity pricing. We try to limit our technical comments to the most actively traded contracts in advance of delivery, but some contracts trade actively right up to delivery while others taper off well in advance. Be sure you check your dates before trading these contracts. For questions regarding this section or additional coverage of commodities email james.west@nasdaq.com.
Data represented in the table below is through 6/2/26:
| Symbol | Name | Price | PnF Trend | RS Signal | RS Col. | 200 Day MA | Weekly Mom |
|---|---|---|---|---|---|---|---|
| CL/ | Crude Oil Continuous | 93.76 | Negative | Sell | X | 72.20 | - 9W |
| DBLCIX | Deutsche Bank Liquid Commodities Index | 468.52 | Positive | Sell | O | 460.74 | - 47W |
| DWACOMMOD | NDW Continuous Commodity Index | 1198.99 | Positive | Buy | X | 1084.01 | - 2W |
| GC/ | Gold Continuous | 4489.10 | Positive | Buy | O | 4383.41 | - 4W |
| HG/ | Copper Continuous | 6.65 | Positive | Sell | X | 5.46 | + 8W |
| ZG/ | Corn (Electronic Day Session) Continuous | 440.50 | Negative | Sell | O | 436.31 | - 2W |

Average Level
35.85
| < - -100 | -100 - -80 | -80 - -60 | -60 - -40 | -40 - -20 | -20 - 0 | 0 - 20 | 20 - 40 | 40 - 60 | 60 - 80 | 80 - 100 | 100 - > |
|---|---|---|---|---|---|---|---|---|---|---|---|
|
Buy signalhyg
|
|||||||||||
|
Buy signalfxe
|
Sell signallqd
|
Buy signalVOOV
|
Buy signalVOOG
|
||||||||
|
Sell signalagg
|
Sell signaluso
|
Buy signaldvy
|
Buy signaliwm
|
Buy signalONEQ
|
|||||||
|
Sell signalgld
|
Sell signaltlt
|
Sell signaldx/y
|
Buy signalGCC
|
Buy signalijr
|
Buy signalrsp
|
Buy signalXLG
|
Buy signalEEM
|
||||
|
Sell signalshy
|
Sell signalief
|
Buy signalGSG
|
Buy signalicf
|
Buy signalefa
|
Buy signalIJH
|
Buy signaldia
|
Buy signalSPY
|
Buy signalQQQ
|
|||
| < - -100 | -100 - -80 | -80 - -60 | -60 - -40 | -40 - -20 | -20 - 0 | 0 - 20 | 20 - 40 | 40 - 60 | 60 - 80 | 80 - 100 | 100 - > |
| AGG | iShares US Core Bond ETF |
| USO | United States Oil Fund |
| DIA | SPDR Dow Jones Industrial Average ETF |
| DVY | iShares Dow Jones Select Dividend Index ETF |
| DX/Y | NYCE U.S.Dollar Index Spot |
| EFA | iShares MSCI EAFE ETF |
| FXE | Invesco CurrencyShares Euro Trust |
| GLD | SPDR Gold Trust |
| GSG | iShares S&P GSCI Commodity-Indexed Trust |
| HYG | iShares iBoxx $ High Yield Corporate Bond ETF |
| ICF | iShares Cohen & Steers Realty ETF |
| IEF | iShares Barclays 7-10 Yr. Tres. Bond ETF |
| LQD | iShares iBoxx $ Investment Grade Corp. Bond ETF |
| IJH | iShares S&P 400 MidCap Index Fund |
| ONEQ | Fidelity Nasdaq Composite Index Track |
| QQQ | Invesco QQQ Trust |
| RSP | Invesco S&P 500 Equal Weight ETF |
| IWM | iShares Russell 2000 Index ETF |
| SHY | iShares Barclays 1-3 Year Tres. Bond ETF |
| IJR | iShares S&P 600 SmallCap Index Fund |
| SPY | SPDR S&P 500 Index ETF Trust |
| TLT | iShares Barclays 20+ Year Treasury Bond ETF |
| GCC | WisdomTree Continuous Commodity Index Fund |
| VOOG | Vanguard S&P 500 Growth ETF |
| VOOV | Vanguard S&P 500 Value ETF |
| EEM | iShares MSCI Emerging Markets ETF |
| XLG | Invesco S&P 500 Top 50 ETF |

| Symbol | Company | Sector | Current Price | Action Price | Target | Stop | Notes |
|---|---|---|---|---|---|---|---|
| BPOP | Popular, Inc. | Banks | $151.10 | hi 130s - low 150s | 200 | 120 | 5 for 5'er, 18 of 174 in favored BANK sector matrix, LT pos peer & mkt RS, triple top, good R-R, 2% yield |
| GRMN | Garmin Ltd. | Leisure | $241.03 | mid 230s - mid 260s | 364 | 196 | 5 TA rating, LT pos trend and mkt RS buy, top 33% of LEIS sector matrix, buy-on-pullback |
| OSW | OneSpaWorld Holdings Ltd. | Leisure | $23.84 | 22 - 24 | 30.50 | 19 | 5 for 5'er, top half of LEIS sector matrix, LT pos peer & mkt RS, spread quintuple top |
| SKT | Tanger Inc. | Real Estate | $35.96 | mid-to-hi 30s | 48 | 31 | 5 for 5'er, top 25% of REAL sector matrix, LT pos peer & mkt RS, R-R~2.0, 3.2% yield |
| IBOC | International Bancshares Corporation | Banks | $71.99 | low-to-mid 70s | 93 | 63 | 4 for 5'er, favored BANK sector, LT pos peer & mkt RS, bearish signal reversal, R-R~2.0, 1.95% yield |
| MSGE | Madison Square Garden Entertainment Corp. | Leisure | $72.08 | 63 to 69 | 98 | 53 | 5 for 5'er since Nov. 2025; Top Decile of Leisure Matrix; Pos. Trend since May 2025; ATH 5/7. |
| LYV | Live Nation Entertainment Inc. | Leisure | $167.64 | low 160s to mid 170s | 202 | 142 | 4 for 5'er; Pos. Trend; Top Half of Leisure Matrix; Within one box of ATH. |
| MO | Altria Group Inc. | Food Beverages/Soap | $69.24 | low-to-mid 70s | 91 | 62 | 4 for 5'er, top quartile of FOOD sector matrix, one box from RS buy, bullish triangle, 5.9% yield |
| MPC | Marathon Petroleum Corp. | Oil Service | $263.06 | 240 - 260 | 360 | 208 | 4 for 5'er, pos. trend, top third of Oil Services matrix, pos. L-T Mkt and Peer RS. |
| VLO | Valero Energy Corp | Oil Service | $258.26 | mid 230s - hi 250s | 328 | 212 | 4 TA rating, top 50% of OILS sector matrix, LT pos trend, buy-on-pullback |
| C | Citigroup, Inc. | Banks | $131.26 | low 120s - low 130s | 188 | 102 | 5 for 5'er since July '25; top decile of Banks matrix; pos. trend since May '25. |
| CTRE | CareTrust REIT Inc | Real Estate | $38.73 | $38 - $43 | 62.50 | 34 | 5/5'er since Apr. '25, top quintile of Real Estate Matrix, pos. trend and buy signal since Jul. '23. |
| TT | Trane Technologies PLC | Building | $458.92 | 420s - 470s | 652 | 380 | 5 TA rating, LT pos trend and mkt RS buy, top 50% of Building sector matrix, buy-on-pullback |
| BTI | British American Tobacco Sp-Adr (United Kingdom) ADR | Food Beverages/Soap | $60.46 | hi 50s - low 60s | 92 | 51 | 4 for 5'er, top 25% of FOOD sector matrix, one box from mkt RS buy, buy on pullback, R-R~3.0, 5.3% yield |
| LAMR | Lamar Advertising Company | Media | $150.42 | mid 140 to mid 150 | 228 | 122 | 5 for 5'er, top third of Media Matrix, pos. trend, Reward-Risk > 11, current yield > 4%. |
| CM | Canadian Imperial Bank of Commerce | Banks | $108.58 | 100s | 165 | 90 | 5 for 5'er, top 10% of favored BANK sector matrix, LT pos peer RS, bearish signal reversal, R-R>3.0, 2.9% yield |
| Symbol | Company | Sector | Current Price | Action Price | Target | Stop | Notes |
|---|
| Symbol | Company | Sector | Current Price | Action Price | Target | Stop | Notes |
|---|---|---|---|---|---|---|---|
| AMAT | Applied Materials, Inc. | Semiconductors | $490.05 | 420s - low 450s | 576 | 376 | AMAT has moved into heavily overbought territory. OK to hold here. Raise stop top $396. |
| Comment | |||||||
|---|---|---|---|---|---|---|---|
|
|
|||||||
CM Canadian Imperial Bank of Commerce R ($107.47) - Banks - CM is a 5 for 5'er that ranks sixth out of 174 names in the favored banks sector matrix and has been on a peer RS buy signal since 2023. After giving two consecutive sell signals, CM returned to a buy signal in April when it completed a bearish signal reversal at $99. The stock continued higher, notching a new all-time high at $116 before pulling back to the middle of its trading band, offering an entry point for long exposure. Positions may be added in the $100s and we will set our initial stop at $90. We will use the bullish price objective, $165, as our target price, giving us a reward-to-risk ratio north of 3.0. CM also carries a 2.9% yield.
| 25 | 26 | ||||||||||||||||||||||||||||
| 116.00 | X | 116.00 | |||||||||||||||||||||||||||
| 114.00 | X | O | 114.00 | ||||||||||||||||||||||||||
| 112.00 | 5 | O | 112.00 | ||||||||||||||||||||||||||
| 110.00 | X | O | 110.00 | ||||||||||||||||||||||||||
| 108.00 | X | O | 108.00 | ||||||||||||||||||||||||||
| 106.00 | X | 6 | Mid | 106.00 | |||||||||||||||||||||||||
| 104.00 | X | X | 104.00 | ||||||||||||||||||||||||||
| 102.00 | X | O | X | 102.00 | |||||||||||||||||||||||||
| 100.00 | X | O | X | X | 100.00 | ||||||||||||||||||||||||
| 99.00 | X | 3 | X | O | X | 99.00 | |||||||||||||||||||||||
| 98.00 | X | X | O | X | O | X | X | 98.00 | |||||||||||||||||||||
| 97.00 | X | O | X | O | O | X | O | X | 97.00 | ||||||||||||||||||||
| 96.00 | X | O | X | O | X | O | X | 96.00 | |||||||||||||||||||||
| 95.00 | X | 2 | O | O | X | O | 4 | 95.00 | |||||||||||||||||||||
| 94.00 | X | 1 | O | X | O | O | X | 94.00 | |||||||||||||||||||||
| 93.00 | X | O | X | O | X | O | X | 93.00 | |||||||||||||||||||||
| 92.00 | X | O | X | O | O | Bot | 92.00 | ||||||||||||||||||||||
| 91.00 | X | O | 91.00 | ||||||||||||||||||||||||||
| 90.00 | X | 90.00 | |||||||||||||||||||||||||||
| 89.00 | X | 89.00 | |||||||||||||||||||||||||||
| 88.00 | X | 88.00 | |||||||||||||||||||||||||||
| 87.00 | X | C | 87.00 | ||||||||||||||||||||||||||
| 86.00 | X | O | X | 86.00 | |||||||||||||||||||||||||
| 85.00 | B | O | X | 85.00 | |||||||||||||||||||||||||
| 84.00 | X | O | X | 84.00 | |||||||||||||||||||||||||
| 83.00 | X | O | 83.00 | ||||||||||||||||||||||||||
| 82.00 | X | A | 82.00 | ||||||||||||||||||||||||||
| 81.00 | X | O | X | 81.00 | |||||||||||||||||||||||||
| 80.00 | X | O | X | 80.00 | |||||||||||||||||||||||||
| 79.00 | X | O | 79.00 | ||||||||||||||||||||||||||
| 78.00 | 9 | 78.00 | |||||||||||||||||||||||||||
| 77.00 | X | 77.00 | |||||||||||||||||||||||||||
| 76.00 | X | 76.00 | |||||||||||||||||||||||||||
| 75.00 | X | 75.00 | |||||||||||||||||||||||||||
| 74.00 | X | X | 74.00 | ||||||||||||||||||||||||||
| 73.00 | X | O | X | 73.00 | |||||||||||||||||||||||||
| 72.00 | X | O | X | 72.00 | |||||||||||||||||||||||||
| 71.00 | 7 | 8 | 71.00 | ||||||||||||||||||||||||||
| 70.00 | 6 | 70.00 | |||||||||||||||||||||||||||
| 69.00 | X | 69.00 | |||||||||||||||||||||||||||
| 68.00 | X | • | 68.00 | ||||||||||||||||||||||||||
| 67.00 | X | X | • | 67.00 | |||||||||||||||||||||||||
| 66.00 | C | O | X | • | 66.00 | ||||||||||||||||||||||||
| 65.00 | X | O | X | • | 65.00 | ||||||||||||||||||||||||
| 64.00 | B | O | 5 | • | 64.00 | ||||||||||||||||||||||||
| 63.00 | A | O | X | • | 63.00 | ||||||||||||||||||||||||
| 62.00 | X | 1 | X | X | • | 62.00 | |||||||||||||||||||||||
| 61.00 | X | 2 | X | O | X | • | 61.00 | ||||||||||||||||||||||
| 60.00 | 9 | O | X | O | X | • | 60.00 | ||||||||||||||||||||||
| 59.00 | X | O | X | 3 | 4 | X | • | 59.00 | |||||||||||||||||||||
| 58.00 | X | O | O | X | O | X | • | 58.00 | |||||||||||||||||||||
| 57.00 | X | O | X | O | X | • | 57.00 | ||||||||||||||||||||||
| 56.00 | X | O | X | O | X | • | 56.00 | ||||||||||||||||||||||
| 55.00 | X | O | O | X | • | 55.00 | |||||||||||||||||||||||
| 54.00 | X | O | • | 54.00 | |||||||||||||||||||||||||
| 53.00 | X | • | 53.00 | ||||||||||||||||||||||||||
| 52.00 | X | • | 52.00 | ||||||||||||||||||||||||||
| 51.00 | X | • | 51.00 | ||||||||||||||||||||||||||
| 50.00 | X | • | 50.00 | ||||||||||||||||||||||||||
| 49.00 | X | • | 49.00 | ||||||||||||||||||||||||||
| 25 | 26 |
| ALGT Allegiant Travel Company ($84.09) - Aerospace Airline - ALGT reversed into Os and broke a double bottom at $85 for a second sell signal as shares fell to $84. The stock rose to a 3 for 5'er at the end of May after seeing a positive trend reversal and market RS chart shift to Xs, but the stock has quickly taken a step back from recent rally highs. From here, support lies at $75, the bullish support line, while the May chart low sits at $70. |
| ALNY Alnylam Pharmaceuticals Inc. ($292.09) - Biomedics/Genetics - ALNY moved lower to complete a spread triple bottom break at $284, marking its third consecutive sell signal. The 2 for 5'er moved down from a 3 in April after reversing into a negative trend. Additionally, the stock ranks in the bottom half of the biomedics/genetics sector matrix. A sell can be considered here. Initial strong resistance is seen between $304-$308, with additional strong resistance between $340-$344. |
| APP AppLovin Corp. Class A ($568.23) - Software - Shares of APP moved lower Wednesday, breaking a double bottom at $584. However, the stock was previously on a steady rebound, and a reversal back up into Xs would signify the start of a shakeout pattern. Additionally, the stock regained market relative strength at the end of last month, bringing it up to buy territory as a 4 for 5'er. Overall, the name has improved notably, but is in a slightly precarious situation without support until the upper $400s. That said, previous resistance from $520 to $400 could also serve as future support. |
| BX The Blackstone Group Inc ($108.91) - Wall Street - BX shares fell today to break a double bottom at $112 to mark its second consecutive sell signal. This 1 for 5'er has been in a negative trend since October 2025 and on an RS sell signal since February. BX shares are trading below their 50-day moving average. From here, support is offered at $106. |
| KKR KKR & Co. L.P ($90.04) - Finance - KKR shares fell today to break a double bottom at $92 to mark its first sell signal. This 1 for 5'er has been in a negative trend since May and on an RS sell signal versus the market since February. KKR shares are trading below the middle of their ten-week trading band with a weekly overbought/oversold reading of -16%. From here, support is offered at $87. |
| KMB Kimberly-Clark Corporation ($95.17) - Household Goods - KMB moved lower to complete a double bottom break at $95. The 1 for 5'er ranks in the bottom half of the household goods sector matrix. A sell can be considered here. Initial strong resistance can be seen at $100, with additional strong resistance at $110. |
| SDRL Seadrill Limited ($46.26) - Oil Service - SDRL fell to a sell and a negative trend Wednesday when it broke a double bottom at $46. The outlook for the stock remains modestly positive, however, as even with the negative trend change SDRL is an acceptable 3 for 5'er. From here, the next level of support on SDRL's chart sits at $45. |
The option suggestions featured here are pulled from the NDW Options Ideas tool. These are just a sample of the ideas that can be found there. The Options Idea tool contains numerous additional income and speculative plays. It also offers relative strength-based screens targeting the highest (and lowest) relative strength stocks and ETFs that have recently moved counter to their longer-term trend. To access or subscribe to the Options Ideas tool click here.
Call
Philip Morris International Inc. (PM) Aug 21 $175 Call

| Additional Data: | |
| Bid/Ask Spread | 8.55% |
| Delta | 58.33 |
| Gamma | 1.49 |
| Implied Volatility | 33.40% |
| Expiry Days | 79 |
| Earnings Date | 7/22/2026 |
Put
Adobe Systems Incorporated (ADBE) Aug 21 $260 Put

| Additional Data: | |
| Bid/Ask Spread | 5.68% |
| Delta | -48.48 |
| Gamma | 0.71 |
| Implied Volatility | 49.75% |
| Expiry Days | 79 |
| Earnings Date | 6/11/2026 |
Income (Short Put)
American Express Company (AXP) July 2 $285 Put

| Additional Data: | |
| Ann. Static Return | 16.82% |
| Bid/Ask Spread | 18.75% |
| Delta | 23.12 |
| Gamma | -1.22 |
| Implied Volatility | 28.13% |
| Expiry Days | 29 |
| Earnings Date | 7/24/2026 |
Daily Equity & Market Analysis
Loading, Please Wait...
