Most Requested Symbols

Semiconductors giveth, semiconductors taketh. After leading the broader market to new highs, semiconductors have taken a notable step back in the past couple of trading days and now reside among those sectors leading the way to the downside.
Reviewing model outperformance with the RS Spread Index near all-time highs
Call: Shell PLC (SHEL); Put: Shopify Inc (SHOP); Covered Write: Cisco Systems (CSCO).
Weekly Rundown Video – May 13, 2026
Weekly rundown with NDW analyst team covering all major asset classes.
Weekly rundown with NDW analyst team covering all major asset classes.
Semiconductors giveth, semiconductors taketh. After leading the broader market to new highs, semiconductors have taken a notable step back in the past couple of trading days and now reside among those sectors leading the way to the downside. Monday’s down 4% day for the NDW Semiconductors Index (DWASEMIS]) follows Friday’s 3% down day and affected the near-term technical health for the sector.
As semis have pulled back, the bullish percent for the sector ^BPSEMI, which measures the percentage of stocks maintaining a buy signal on their default point and figure chart, has fallen from the 80% down to just above 50% as of Monday’s close. While still suggesting more than half of the stocks within the sector maintain a buy signal, the past two trading days (Friday and Monday) have seen the indicator decrease by over 20%, ranking among the top 20 (out of 7000+ two-day periods) largest two-day drops in history going back to the beginning of 1998. Individually, Friday and Monday – along with last Tuesday (5/12) – rank among the top 100 in terms of one day drops. While that may seem alarming at first, context is key and remembering that the rallying within semis during April was historic, so it was not too surprising to see a quick consolidation after abrupt improvement.

For further context, below are two stocks that have both returned to sell signals, but their technical pictures in response to recent downside have been different.
Micron Technology (MU) returned to a sell signal during Monday’s (5/18) trading as shares fell to $664. This comes after the stocks moved to new highs above $800 and extended into highly overbought territory. Even with the sell signal and pullback, MU continues to maintain 5 technical attribute rating and rank among the top quintile of the stocks within the semiconductors sector matrix. Additionally, the stock continues to maintain an overbought position with a Weekly OBOS reading north of 80%, so those seeking exposure to MU will look for a further pullback and then return to a buy signal or continued consolidation within the current price range before considering.

On the other hand, while maybe not as well known as MU, Credo Technology Group (CRDO) is a prime example of a stock that has seen additional technical deterioration along with a return to a sell signal. CRDO broke a triple bottom at $182 on 5/14 before seeing shares continue lower, falling to $150. Although still maintaining a positive trend, CRDO has seen both the market and peer RS charts reverse into Os during Friday and Monday’s trading, indicating near-term underperformance and dropping the stock down to an unacceptable 2 for 5’er. With prior resistance in the $130 to $140 range appearing as the closest levels of potential support and the recent technical deterioration, CRDO is likely one investor are looking to step away from if not already done.


It’s a stock picker’s market. That phrase always seemed like filler to me as another line used by the financial media to grab attention. Plugging “stock picker’s market” into Google leaves you with the following definition, according to their AI-overview; “a stock picker's market is an investment environment where individual stocks perform differently from the broader market or their sector, allowing skilled investors to outperform general indices by hand-selecting specific equities.” That sounds innocent enough, but isn’t that always going to be the case? The nature of an index as a basket of stocks means that some stocks inside the index are going to outperform and others are going to underperform, leading to the aggregated index performance. Technically all markets are “stock picker’s markets,” as long as you pick the right stocks.
There are many different ways to pick stocks. Our approach at NDW focuses on maintaining exposure to momentum in the market. In other words, we buy the stocks that have done well and avoid the stocks that have lagged their peers. Just like any factor, momentum goes through periods of outperformance and periods of underperformance. We are currently in sharp period of outperformance for the factor, as shown through our RS Spread Index RSSPREAD. This index simply takes a basket of the top 1000 names by market cap and organizes them into quintiles based on trailing returns. We then take the top performing bucket minus the bottom performing bucket to get the spread between the leaders and laggards, generating the reading you see charted. The RSSPREAD tells us how well the momentum stocks picked by most of our strategies are working. If the reading is going higher, it’s a good time to be in momentum. If it is falling, that could point toward a simple momentum pause, or a period of rotation when leaders and laggards might be switching. Currently, the RSSPREAD is at fresh highs after marching higher since the first day of April.

Seeing the RS Spread Index at lofty levels might lead you to believe that you have missed the run. However, that line of thinking flies in the face of a momentum-based approach. We are in the business of buying winners and holding those winners as long as possible. The same can be said for the strategy itself. Could the momentum market turn around tomorrow? Certainly, a pullback would not be shocking given the extended outperformance. We saw some sharp downside action in many of the high momentum names Monday. If those high momentum names continue to weaken, they lose their high momentum status. Models following these trends do not try to predict what will happen next. They follow the trends until they change, then move into the new areas of strength. Also, trends that persist for prolonged periods of time typically lead to more favorable results. My colleague Miles Clark phrased this thought well in part 2 of the “Momentum Pitfalls” series; “evidence suggests that constant rotation of “buying high” is not necessarily a liability for momentum strategies, but rather the defining feature that drives long‑term results.” Most of our relative strength strategies tend to see a small number of trades make most of the excess returns, as he showed by examining the trade history for the Large Cap Core Model. This reinforces the importance of sticking with the process over time rather than constantly adjusting your process to fit your perceived understanding of the current market action.
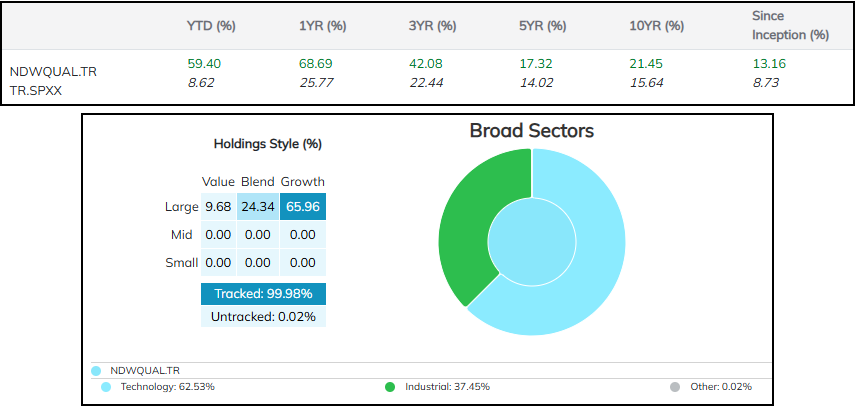
There are a multitude of stock models available on the NDW platform that have shown strength in the positive momentum environment. These range from sub-sector focused models to strategies centered around broad indices. One of the better performing models so far this year is the NDW Quality Factor Model, which has gained more than 59% (through 5/18) outpacing the total return of the S&P 500 Index (TR.SPXX), which has gained 8.6% over the same period.
The NDW Quality Factor Model looks at an inventory of roughly the top 1000 US stocks by market capitalization, filters that list once a year using quality rankings (debt-to-equity, ROE, and earnings variance), then focuses exposure on the top ten names. The Quality Model does not use any sector caps, allowing the exposure within the portfolio to flow wherever the relative strength dictates. This approach has led the model to focus exclusively on technology and industrials since the end of March, leading to major outperformance. Those looking to follow this strategy can set alerts directly through our Models page.
Average Level
22.51
| < - -100 | -100 - -80 | -80 - -60 | -60 - -40 | -40 - -20 | -20 - 0 | 0 - 20 | 20 - 40 | 40 - 60 | 60 - 80 | 80 - 100 | 100 - > |
|---|---|---|---|---|---|---|---|---|---|---|---|
|
Buy signalefa
|
|||||||||||
|
Buy signalIJH
|
|||||||||||
|
Buy signalicf
|
Buy signalSPY
|
||||||||||
|
Buy signalrsp
|
Buy signalVOOG
|
||||||||||
|
Buy signalijr
|
Buy signaliwm
|
Buy signalONEQ
|
|||||||||
|
Sell signaltlt
|
Sell signalagg
|
Sell signallqd
|
Buy signalhyg
|
Sell signaldx/y
|
Buy signalGSG
|
Sell signaldia
|
Buy signalVOOV
|
Buy signalXLG
|
|||
|
Sell signalief
|
Buy signalshy
|
Sell signalgld
|
Buy signalfxe
|
Buy signaldvy
|
Buy signalUSO
|
Buy signalEEM
|
Buy signalGCC
|
Buy signalQQQ
|
|||
| < - -100 | -100 - -80 | -80 - -60 | -60 - -40 | -40 - -20 | -20 - 0 | 0 - 20 | 20 - 40 | 40 - 60 | 60 - 80 | 80 - 100 | 100 - > |
| AGG | iShares US Core Bond ETF |
| USO | United States Oil Fund |
| DIA | SPDR Dow Jones Industrial Average ETF |
| DVY | iShares Dow Jones Select Dividend Index ETF |
| DX/Y | NYCE U.S.Dollar Index Spot |
| EFA | iShares MSCI EAFE ETF |
| FXE | Invesco CurrencyShares Euro Trust |
| GLD | SPDR Gold Trust |
| GSG | iShares S&P GSCI Commodity-Indexed Trust |
| HYG | iShares iBoxx $ High Yield Corporate Bond ETF |
| ICF | iShares Cohen & Steers Realty ETF |
| IEF | iShares Barclays 7-10 Yr. Tres. Bond ETF |
| LQD | iShares iBoxx $ Investment Grade Corp. Bond ETF |
| IJH | iShares S&P 400 MidCap Index Fund |
| ONEQ | Fidelity Nasdaq Composite Index Track |
| QQQ | Invesco QQQ Trust |
| RSP | Invesco S&P 500 Equal Weight ETF |
| IWM | iShares Russell 2000 Index ETF |
| SHY | iShares Barclays 1-3 Year Tres. Bond ETF |
| IJR | iShares S&P 600 SmallCap Index Fund |
| SPY | SPDR S&P 500 Index ETF Trust |
| TLT | iShares Barclays 20+ Year Treasury Bond ETF |
| GCC | WisdomTree Continuous Commodity Index Fund |
| VOOG | Vanguard S&P 500 Growth ETF |
| VOOV | Vanguard S&P 500 Value ETF |
| EEM | iShares MSCI Emerging Markets ETF |
| XLG | Invesco S&P 500 Top 50 ETF |

| Symbol | Company | Sector | Current Price | Action Price | Target | Stop | Notes |
|---|---|---|---|---|---|---|---|
| BPOP | Popular, Inc. | Banks | $146.43 | hi 130s - low 150s | 200 | 120 | 5 for 5'er, 18 of 174 in favored BANK sector matrix, LT pos peer & mkt RS, triple top, good R-R, 2% yield |
| GRMN | Garmin Ltd. | Leisure | $226.89 | mid 230s - mid 260s | 364 | 196 | 5 TA rating, LT pos trend and mkt RS buy, top 33% of LEIS sector matrix, buy-on-pullback |
| SBUX | Starbucks Corporation | Restaurants | $106.60 | hi 90s - mid 100s | 129 | 85 | 4 for 5'er, top 20% of REST sector matrix, mkt RS reversal to Xs, triple top, 2.35% yield |
| OSW | OneSpaWorld Holdings Ltd. | Leisure | $23.89 | 22 - 24 | 30.50 | 19 | 5 for 5'er, top half of LEIS sector matrix, LT pos peer & mkt RS, spread quintuple top |
| IMO | Imperial Oil Limited | Oil | $138.33 | mid 120s to mid 130s | 164 | 112 | 5 for 5'er; top quartile of Oil matrix; long term mkt and peer RS; Pos. Trend since May '25. |
| SKT | Tanger Inc. | Real Estate | $35.65 | mid-to-hi 30s | 48 | 31 | 5 for 5'er, top 25% of REAL sector matrix, LT pos peer & mkt RS, R-R~2.0, 3.2% yield |
| IBOC | International Bancshares Corporation | Banks | $72.20 | low-to-mid 70s | 93 | 63 | 4 for 5'er, favored BANK sector, LT pos peer & mkt RS, bearish signal reversal, R-R~2.0, 1.95% yield |
| MSGE | Madison Square Garden Entertainment Corp. | Leisure | $69.04 | 63 to 69 | 98 | 53 | 5 for 5'er since Nov. 2025; Top Decile of Leisure Matrix; Pos. Trend since May 2025; ATH 5/7. |
| TDS | Telephone & Data Systems Inc | Telephone | $41.42 | low 40s | 70 | 35 | 4 for 5'er, favored TELE sector, LT pos peer & mkt RS, buy on pullback, R-R~4.0 |
| LYV | Live Nation Entertainment Inc. | Leisure | $167.49 | low 160s to mid 170s | 202 | 142 | 4 for 5'er; Pos. Trend; Top Half of Leisure Matrix; Within one box of ATH. |
| MO | Altria Group Inc. | Food Beverages/Soap | $73.72 | low-to-mid 70s | 91 | 62 | 4 for 5'er, top quartile of FOOD sector matrix, one box from RS buy, bullish triangle, 5.9% yield |
| CVSA | Covista Inc. | Business Products | $127.85 | 110s - mid 120s | 186 | 104 | 4 for 5'er, top 25% of BUSI sector matrix, shakeout to triple top, buy on pullback, R-R>3.0 |
| MPC | Marathon Petroleum Corp. | Oil Service | $259.53 | 240 - 260 | 360 | 208 | 4 for 5'er, pos. trend, top third of Oil Services matrix, pos. L-T Mkt and Peer RS. |
| Symbol | Company | Sector | Current Price | Action Price | Target | Stop | Notes |
|---|
| Symbol | Company | Sector | Current Price | Action Price | Target | Stop | Notes |
|---|---|---|---|---|---|---|---|
| HAS | Hasbro, Inc. | Leisure | $93.72 | lo-hi 90s | 122 | 79 | Sell signal 5/19; testing bullish support line; maintain $79 stop. |
| ADBE | Adobe Systems Incorporated | Software | $255.64 | 240s - 250s | 168 | 288 | Buy Signal on 5/19; maintain $288 buy stop. |
| Comment | |||||||
|---|---|---|---|---|---|---|---|
|
|
|||||||
MPC Marathon Petroleum Corp. R ($259.74) - Oil Service - MPC has been a 4 for 5’er since March 2026 and currently ranks within the top third of the Oil Services sector matrix. From a long-term relative strength perspective, MPC has shown superior RS since early 2021 against the market and late 2014 against its peer group. On the trend chart, MPC returned to a buy signal in early May as shares rallied to an all-time chart high at $260. After a brief pullback to the middle of the 10-week trading band, MPC reversed into Xs during last week’s trading and rallied to match highs on 5/18. Exposure may be added here at $260 or on a pullback to $240. We will utilize the bullish price objective of $360 as our price target, giving MPC a reward to risk ratio north of 3. The initial stop will be set at $208.
| 26 | |||||||||||||||||||||||||||||
| 260.00 | X | X | 260.00 | ||||||||||||||||||||||||||
| 256.00 | X | O | X | 256.00 | |||||||||||||||||||||||||
| 252.00 | X | 5 | O | X | 252.00 | ||||||||||||||||||||||||
| 248.00 | X | O | X | O | X | 248.00 | |||||||||||||||||||||||
| 244.00 | X | O | X | O | X | 244.00 | |||||||||||||||||||||||
| 240.00 | X | X | O | X | O | X | 240.00 | ||||||||||||||||||||||
| 236.00 | X | O | X | 4 | X | O | Mid | 236.00 | |||||||||||||||||||||
| 232.00 | X | O | X | O | X | 232.00 | |||||||||||||||||||||||
| 228.00 | X | X | O | O | X | 228.00 | |||||||||||||||||||||||
| 224.00 | X | O | X | O | X | 224.00 | |||||||||||||||||||||||
| 220.00 | X | O | X | O | X | 220.00 | |||||||||||||||||||||||
| 216.00 | X | O | O | X | 216.00 | ||||||||||||||||||||||||
| 212.00 | X | O | 212.00 | ||||||||||||||||||||||||||
| 208.00 | X | X | 208.00 | ||||||||||||||||||||||||||
| 204.00 | X | O | X | X | 204.00 | ||||||||||||||||||||||||
| 200.00 | • | • | X | O | X | O | X | X | • | 200.00 | |||||||||||||||||||
| 198.00 | O | C | • | X | O | X | O | X | O | 3 | • | 198.00 | |||||||||||||||||
| 196.00 | O | X | O | • | X | O | O | X | O | X | • | 196.00 | |||||||||||||||||
| 194.00 | O | X | O | • | X | O | X | O | X | • | 194.00 | ||||||||||||||||||
| 192.00 | O | X | O | • | X | O | O | • | 192.00 | ||||||||||||||||||||
| 190.00 | O | X | O | • | X | • | 190.00 | ||||||||||||||||||||||
| 188.00 | O | O | • | X | • | 188.00 | |||||||||||||||||||||||
| 186.00 | O | • | X | • | 186.00 | ||||||||||||||||||||||||
| 184.00 | O | • | X | • | 184.00 | ||||||||||||||||||||||||
| 182.00 | O | X | X | • | X | • | Bot | 182.00 | |||||||||||||||||||||
| 180.00 | O | X | O | X | O | X | X | • | 180.00 | ||||||||||||||||||||
| 178.00 | O | X | O | X | O | X | O | 2 | • | 178.00 | |||||||||||||||||||
| 176.00 | O | X | X | O | O | X | O | X | • | 176.00 | |||||||||||||||||||
| 174.00 | O | X | O | X | O | X | O | X | • | 174.00 | |||||||||||||||||||
| 172.00 | O | X | O | X | O | • | O | • | 172.00 | ||||||||||||||||||||
| 170.00 | O | X | O | • | • | • | 170.00 | ||||||||||||||||||||||
| 168.00 | O | 1 | • | 168.00 | |||||||||||||||||||||||||
| 166.00 | • | O | X | • | 166.00 | ||||||||||||||||||||||||
| 164.00 | • | O | X | • | 164.00 | ||||||||||||||||||||||||
| 162.00 | O | • | 162.00 | ||||||||||||||||||||||||||
| 26 |
| HCA HCA Healthcare Inc. ($405.89) - Healthcare - HCA moved lower and completed a double bottom break at $416, marking its third consecutive sell signal. The 2 for 5'er moved down from a 3 with its latest move, after reversing back into a negative trend. Additionally, the stock ranks in the bottom half of the healthcare sector matrix. The weekly OBOS indicates that the stock is in oversold territory, so wait for the stock to normalize before selling your position. Initial resistance is at $448, with additional resistance at $512 |
| KR The Kroger Co. ($70.96) - Retailing - After a series of sell signals, KR completed a bearish signal reversal at $70. The 4 for 5'er moved up from a 3 with its latest move after reversing back into a positive trend. Additionally, the stock offers a yield of 2.12%. Long exposure can be made here. Initial support and the bullish support line can be seen at $65. |
| NEM Newmont Corp ($104.54) - Precious Metals - NEM fell to a sell signal Tuesday when it broke a triple bottom at $106. Tuesday's move adds evidence to negative overall technical picture as NEM is a 2 for 5'er. From here, the next level of support is NEM's trend line at $102. |
| PSX Phillips 66 ($183.11) - Oil Service - CSX gave a second consecutive buy signal and returned to a positive trend Tuesday when it broke a spread triple top at $182. The outlook for the stock remains negative, however, as even with the positive trend change PSX is an unfavorable 2 for 5'er. From here, support can be found at $166. |

The option suggestions featured here are pulled from the NDW Options Ideas tool. These are just a sample of the ideas that can be found there. The Options Idea tool contains numerous additional income and speculative plays. It also offers relative strength-based screens targeting the highest (and lowest) relative strength stocks and ETFs that have recently moved counter to their longer-term trend. To access or subscribe to the Options Ideas tool click here.
Call
Shell PLC (SHEL) Sept 18 $87.50 Call

Additional Data:
| Bid/Ask Spread | 3.7% |
| Delta | 59.48 |
| Gamma | 3.44 |
| Implied Volatility | 26.04% |
| Expiry Days | 122 |
| Earnings Date | 7/30/2026 |
Put
Shopify Inc (SHOP) August 21 $105 Put

Additional Data:
| Bid/Ask Spread | 11.48% |
| Delta | -47.2 |
| Gamma | 1.25 |
| Implied Volatility | 63.86% |
| Expiry Days | 94 |
| Earnings Date | 8/5/2026 |
Income (Covered Call)
Cisco Systems (SCO) August 21 $135 Covered Call

Additional Data:
| Ann. Static Return | 12.98% |
| Bid/Ask Spread | 5.71% |
| Delta | 72.39 |
| Gamma | -1.43 |
| Implied Volatility | 39.53% |
| Expiry Days | 94 |
| Earnings Date | 8/12/2026 |
Daily Equity & Market Analysis
Loading, Please Wait...
