Most Requested Symbols

One of the largest developments in the ETF space over the last few years has been the buffered or defined outcome ETF (we will use these terms interchangeably). There are so many different varieties nowadays, but the general idea is protection against some level of decline at the expense of reduced or capped upside potential.
The curve has an average reading of 10.05%.
Today's featured stock is Pure Storage (PSTG).
ADSK, BRBR, CARG, CR, EXPE, GDDY, LYV, RCL, SCCO, SHOP, TDW
Call: Darden Restaurants (DRI); Put: Moderna Inc (MRNA); Covered Write: CF Industries Holdings (CF).
WEEKLY RUNDOWN - January 22, 2025
Weekly discussion with the NDW analyst team covering all major asset classes.
Weekly discussion with the NDW analyst team covering all major asset classes.
Monday’s sell-off brought mixed results for US equity indices as the tech-associated Nasdaq Composite NASD and Nasdaq-100 NDX were both down roughly 3%, while the Dow Jones Industrial Average .DJIA and S&P 500 Equal Weight Index SPXEWI were up 65 basis points and basically flat. Including Friday’s action, the only US Equity index that is positive during the past two trading days is the Dow at up 33 basis points.
Intriguingly enough, though most equity indices have been negative the past two trading days, the NYSE High Low Index ^NYSEHILO has increased 14.5% from 57.1 to 71.6 on the indicator’s chart. For those not familiar with the indicator, the High Low Index measures the percent of stocks making 52-week highs relative to those making 52-week highs and lows. In short, when the indicator is increasing, more stocks are making 52-week highs versus stocks making 52-week lows.
Considering most US equity indices have been negative the past two trading days, the two-day increase within the NYSEHILO indicator ranks within the 99th percentile of two-day increases going back early 1980. Individually, Friday’s increase ranks within the 99th percentile of one-day increases, while Monday’s fell just outside the 99th percentile. While initially counterintuitive to think about an indicator measuring 52-week highs increase amid most indices moving lower, digging deeper reveals a silver lining. Much of the past two day’s negative action has been focused on mega and the larger, large cap stocks, and the increase in stock’s making 52-week highs is a near-term sign of improving breadth. This is somewhat confirmed by the S&P 500 Equal Weight Index SPXEWI outperforming the S&P 500 SPX by more than 1.5%; though it is worth bearing in mind that index performance hasn’t been stellar, while some individual stocks have been capable of rally to new highs.

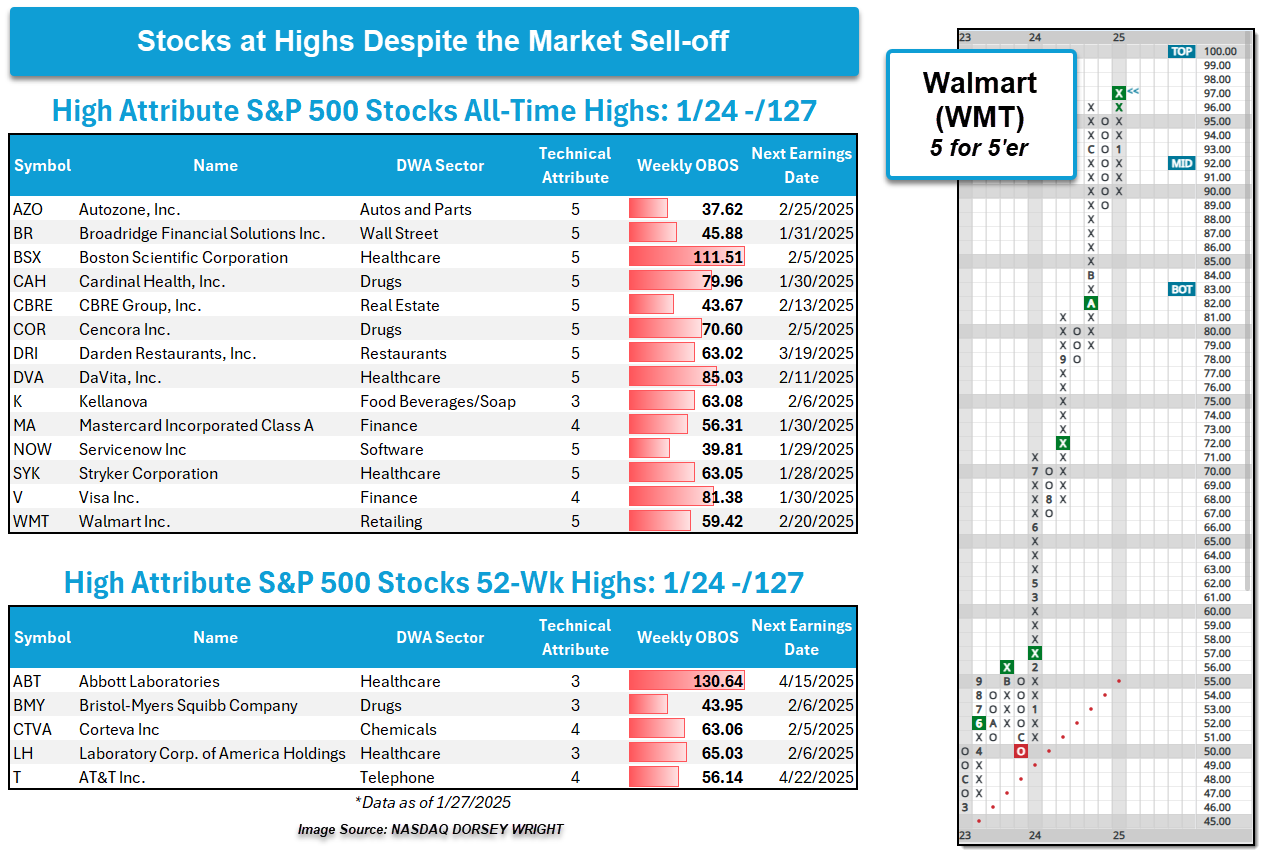
Considering there are names that made new highs (either 52-week or all-time), the 52-week Highs/Lows report within the Database Reports in the Security Screener (Securities > Security Screener > Database Reports) was utilized to create a Watchlist of those stocks just making 52-week (or all-time) highs. After creating the Watchlist, the Stock’s Screener was used to filter this Watchlist for high technical attribute S&P 500 stocks, of which there were 19. The list of stocks is shown below. Bear in mind, most of these stocks have yet to report earnings, so be cognizant of upcoming report dates before considering exposure.
Among the notable highlights is Walmart WMT, which broke a double top at $97 to mark an all-time chart high and count as a fourth consecutive buy signal since early 2024. WMT is a 5 for 5’er that ranks within the top quartile of the Retailing sector matrix and top quintile of the Top 500 Large Cap (Total Return) matrix. Earnings are expected for Walmart later within the reporting cycle, so it is among those that can be considered here on the breakout or on a pullback toward the middle of the 10-week trading band at $92.
With most of the stocks within the list trading at highs, advisors should be aware of the positioning on the 10-week trading band and whether the stock may be overbought enough that exposure is better added on a pullback. Generally, a stock with a weekly overbought reading north of 70% and trading above support would fit this criterion; Boston Scientific BSX would be an example of such. As noted, be cognizant of upcoming earnings dates within names that may appear actionable here. Investors are often best served to wait until post earnings before adding exposure, and one such example is Broadridge Financial Solutions BR, which has earnings on 1/31.

One of the largest developments in the ETF space over the last few years has been the buffered or defined outcome ETF (we will use these terms interchangeably). There are so many different varieties nowadays, but the general idea is protection against some level of decline at the expense of reduced or capped upside potential. Most of these buffered ETFs are built around US equity indices but they have branched out to commodities like gold. The space is growing rapidly with over $45 billion in assets linked to buffered ETFs (ETF.com). They're a good story, as you can participate in the equity market while ensuring that the investment is protected against some level of downside while lowering upside participation. For clients with capital preservation at or near the top of their list of priorities, these buffered ETFs seem like a viable option so they can still participate in equities. However, as the saying goes, “There’s no such thing as a free lunch.”

Long-term capping of the upside for downside protection is a good way to underperform the market by a substantial margin, and that’s not including the average 78 bps fee for a buffered ETF. In a simple study, returns were compared for holding the S&P 500 Index (SPX), holding Money Market (MNYMKT), holding a 50/50 split between SPX and MNYMKT, and a hypothetical SPX buffered ETF with downside limited to -10% and upside capped at 10%. For the hypothetical buffered ETF portfolio, there was assumed to be no fee and the ability to buy this collar at no cost at the end of each year. As mentioned earlier, buffered ETFs come in a wide variety of upside caps, downside caps, or buffer zones, however, this hypothetical collar strategy would be nearly an ideal scenario in comparison.
With a backtest starting in 1990, the hypothetical buffered strategy had a cumulative return of 340% versus the S&P 500’s return of 1,564%. It’s no surprise that the S&P 500 put together better performance, however, its worst annual performance was -38.49% while the hypothetical buffered portfolio’s worst year was -10%. So, maybe there is some benefit to a buffered ETF for conservative clients. On the other hand, the S&P 500 has only had five calendar years with a return worse than -10% while 19 calendar years of greater than 10% return. So, the downside buffer only had an impact five times while the upside buffer reduced yearly returns 19 times in 34 years, or over half of the time. Sitting in money market for the entire period has a cumulative return of 149%, which underperforms the hypothetical buffer strategy but offers no years of negative return. The final strategy, a 50/50 split between the S&P 500 and MNYMKT returned a total of 641%, which bests the buffered strategy by a notable margin. At the same time, the 50/50 portfolio only had two years when the return was worse than -10% (one of which was a -10.89% return) while returning more than 10% annually 14 times. While its worst year was -18.58%, the 50/50 portfolio would have been a better way of giving conservative clients exposure to equities while reducing their risk exposure.

Many buffered ETFs come with monthly versions so investors can get the expected cap whenever they can put money to work, which would change the exact returns outlined above. In our hypothetical portfolio, it is assumed that the cap and downside protection are reset at the beginning of each year, however, this should not change the takeaway that buffered ETFs severely limit performance the longer they are used. One of the big selling points for buffered ETFs is that they are built around the average yearly return for the market, so investors can still participate in average market returns. While the S&P 500 has had an average annual return of 9.84% going back to 1990, the S&P 500 only had seven years in which the annual return was between 4.84% and 14.84%. Said plainly, the average annual return for the S&P 500 rarely happens in a calendar year. For clients that want to be conservative and limit downside while investing in equities, using traditional short-duration or money market instruments while holding a position in uncapped equities would be preferable to using most buffered products even if they offered zero fees, highlighted by the 50/50 strategy compared to the hypothetical buffer strategy. While some buffered ETFs could be useful for clients, make sure to know the risk and reward of doing so. As the saying goes, “There is no free lunch.”
Average Level
10.05
| < - -100 | -100 - -80 | -80 - -60 | -60 - -40 | -40 - -20 | -20 - 0 | 0 - 20 | 20 - 40 | 40 - 60 | 60 - 80 | 80 - 100 | 100 - > |
|---|---|---|---|---|---|---|---|---|---|---|---|
|
Buy signaliwm
|
|||||||||||
|
Buy signalONEQ
|
Buy signalIJH
|
||||||||||
|
Sell signalijr
|
Buy signalXLG
|
||||||||||
|
Sell signaldx/y
|
Sell signalagg
|
||||||||||
|
Sell signalicf
|
Buy signaldvy
|
||||||||||
|
Buy signalQQQ
|
Buy signalSPY
|
Buy signalUSO
|
Buy signaldia
|
||||||||
|
Buy signalief
|
Sell signalVOOV
|
Buy signalgcc
|
Buy signalshy
|
||||||||
|
Sell signaleem
|
Buy signalVOOG
|
Buy signalrsp
|
Buy signalhyg
|
Buy signalGLD
|
|||||||
|
Buy signaltlt
|
Sell signallqd
|
Sell signalfxe
|
Sell signalefa
|
Buy signalgsg
|
|||||||
| < - -100 | -100 - -80 | -80 - -60 | -60 - -40 | -40 - -20 | -20 - 0 | 0 - 20 | 20 - 40 | 40 - 60 | 60 - 80 | 80 - 100 | 100 - > |
| AGG | iShares US Core Bond ETF |
| USO | United States Oil Fund |
| DIA | SPDR Dow Jones Industrial Average ETF |
| DVY | iShares Dow Jones Select Dividend Index ETF |
| DX/Y | NYCE U.S.Dollar Index Spot |
| EFA | iShares MSCI EAFE ETF |
| FXE | Invesco CurrencyShares Euro Trust |
| GLD | SPDR Gold Trust |
| GSG | iShares S&P GSCI Commodity-Indexed Trust |
| HYG | iShares iBoxx $ High Yield Corporate Bond ETF |
| ICF | iShares Cohen & Steers Realty ETF |
| IEF | iShares Barclays 7-10 Yr. Tres. Bond ETF |
| LQD | iShares iBoxx $ Investment Grade Corp. Bond ETF |
| IJH | iShares S&P 400 MidCap Index Fund |
| ONEQ | Fidelity Nasdaq Composite Index Track |
| QQQ | Invesco QQQ Trust |
| RSP | Invesco S&P 500 Equal Weight ETF |
| IWM | iShares Russell 2000 Index ETF |
| SHY | iShares Barclays 1-3 Year Tres. Bond ETF |
| IJR | iShares S&P 600 SmallCap Index Fund |
| SPY | SPDR S&P 500 Index ETF Trust |
| TLT | iShares Barclays 20+ Year Treasury Bond ETF |
| GCC | WisdomTree Continuous Commodity Index Fund |
| VOOG | Vanguard S&P 500 Growth ETF |
| VOOV | Vanguard S&P 500 Value ETF |
| EEM | iShares MSCI Emerging Markets ETF |
| XLG | Invesco S&P 500 Top 50 ETF |

| Symbol | Company | Sector | Current Price | Action Price | Target | Stop | Notes |
|---|---|---|---|---|---|---|---|
| CWST | Casella Waste Systems, Inc. | Waste Management | $106.95 | 100 - 110 | 135 | 91 | 5 for 5'er, LT pos mkt RS, spread triple top, Earn. 2/12 |
| COST | Costco Wholesale Corporation | Retailing | $965.25 | 940s - 1010 | 1288 | 792 | 5 TA rating, LT pos trend, LT RS buy, top 50% of RETA sector matrix, price consolidation |
| LPX | Louisiana-Pacific Corporation | Forest Prods/Paper | $114.96 | 97-110 | 173 | 87 | 5 TA rating, top half of FORE sector matrix, LT RS buy, R-R > 4, buy-on-pullback, Earn. 2/19 |
| REVG | REV Group Inc | Autos and Parts | $33.77 | hi 20s - lo 30s | 54 | 25 | 5 TA rating, top quintile of AUTO sector matrix, LT RS buy, LT pos trend, buy-on-pullback, R-R > 3 |
| USFD | US Foods Holding Corp. | Food Beverages/Soap | $70.75 | 65-lo 70s | 85 | 58 | 5 TA rating, top 20% of FOOD sector RS matrix, LT pos trend, LT RS buy, R-R > 2, Earn. 2/13 |
| GKOS | Glaukos Corp. | Healthcare | $157.03 | mid 140s - hi 150s | 206 | 126 | 5 TA rating, top 20% of HEAL sector matrix, LT RS buy, LT pos trend, R-R > 2, Earn. 2/20 |
| GFL | GFL Environmental Inc | Waste Management | $43.11 | low-to-mid 40s | 59 | 35 | 5 for 5'er, top 10% of WAST sector matrix, LT pos mkt RS, bullish catapult, buy on pullback, Earn. 2/24 |
| GIII | G-III Apparel Group | Textiles/Apparel | $32.18 | 29-lo 30s | 55 | 25 | 5 TA rating, top 50% of TEXT sector matrix, LT RS buy, LT pos trend, buy-on-pullback, R-R > 4-1 |
| PLNT | Planet Fitness Inc | Leisure | $103.51 | lo 100s - lo 110s | 139 | 86 | 5 TA rating, top decile of LEIS sector matrix, LT pos trend, consec. buy signals, Earn. 2/25 |
| CBRE | CBRE Group, Inc. | Real Estate | $143.12 | hi 120s - low 140s | 178 | 104 | 5 for 5'er, top 10% of REAL sector matrix, LT pos peer & mkt RS, bearish signal reversal, Earn. 2/13 |
| DAL | Delta Air Lines Inc. | Aerospace Airline | $67.77 | mid 60s - low 70s | 91 | 56 | 5 TA rating, top 20% of AERO sector matrix, LT RS buy, consec. buy signals, pos. wkly mom. |
| CTAS | Cintas Corporation | Textiles/Apparel | $202.56 | 190s - low 200s | 228 | 162 | 4 for 5'er, favored TEXT sector matrix, LT pos mkt RS, consec buy signals |
| PSTG | Pure Storage | Computers | $65.29 | 64-lo 70s | 98 | 56 | 5 TA rating, top 20% of COMP sector matrix, LT RS buy, buy-on-pullback, R-R > 2, Earn. 2/26 |
| Symbol | Company | Sector | Current Price | Action Price | Target | Stop | Notes |
|---|---|---|---|---|---|---|---|
| FL | Foot Locker, Inc. | Retailing | $20.13 | 22 - 25 | 16 | 27 | 0 for 5'er, bottom 10% of RETA sector matrix, multiple sell signals |
| AMD | Advanced Micro Devices, Inc. | Semiconductors | $115.01 | 120 - 130 | 100 | 146 | 0 for 5'er, bottom 20% of SEMI sector matrix, series of lower rally highs, sell on rally, Earn. 2/4 |
| Comment | |||||||
|---|---|---|---|---|---|---|---|
|
|
|||||||
PSTG Pure Storage ($67.49) R - Computers - PSTG has a 5 for 5 TA rating and sits in the top quintile of the computers sector RS matrix. The stock pushed to a new all-time high this month before pulling back alongside the broad-based technology decline on Monday. Even with the near-term consolidation, the long-term picture remains decidedly positive, as PSTG has been on a buy signal against the market since June 2023. Tuesday's market action saw the stock reverse higher, putting in a higher low and leaving the stock at a more actionable trading level. Exposure may be considered from $64 to the low $70s. Our initial stop will be positioned at $56, which would violate multiple support levels and move the stock to a negative trend. The bullish price objective of $98 will serve as our price target, offering a reward-to-risk north of 2-to-1. Note that earnings are expected on 2/26.
| 25 | |||||||||||||||||||||||||||||
| 73.00 | X | 73.00 | |||||||||||||||||||||||||||
| 72.00 | X | O | 72.00 | ||||||||||||||||||||||||||
| 71.00 | X | O | 71.00 | ||||||||||||||||||||||||||
| 70.00 | X | O | 70.00 | ||||||||||||||||||||||||||
| 69.00 | X | O | 69.00 | ||||||||||||||||||||||||||
| 68.00 | X | X | O | 68.00 | |||||||||||||||||||||||||
| 67.00 | X | O | X | X | O | 67.00 | |||||||||||||||||||||||
| 66.00 | X | O | X | O | X | X | O | 66.00 | |||||||||||||||||||||
| 65.00 | X | O | X | O | X | O | X | 1 | X | O | 65.00 | ||||||||||||||||||
| 64.00 | X | O | • | X | O | X | O | X | O | X | O | X | O | 64.00 | |||||||||||||||
| 63.00 | X | O | X | • | X | O | X | O | X | O | X | O | X | 63.00 | |||||||||||||||
| 62.00 | X | O | X | X | O | • | X | O | X | O | O | O | X | Mid | 62.00 | ||||||||||||||
| 61.00 | O | X | O | X | O | • | X | O | O | 61.00 | |||||||||||||||||||
| 60.00 | O | X | O | X | X | O | • | X | 60.00 | ||||||||||||||||||||
| 59.00 | O | O | X | X | O | X | O | • | X | 59.00 | |||||||||||||||||||
| 58.00 | O | X | O | X | O | X | O | • | X | 58.00 | |||||||||||||||||||
| 57.00 | O | X | O | X | 8 | X | O | X | • | X | 57.00 | ||||||||||||||||||
| 56.00 | O | O | O | X | O | X | O | X | 56.00 | ||||||||||||||||||||
| 55.00 | O | X | O | X | O | X | C | • | 55.00 | ||||||||||||||||||||
| 54.00 | O | X | O | X | O | X | O | X | X | • | 54.00 | ||||||||||||||||||
| 53.00 | O | X | O | X | O | X | O | B | O | X | • | 53.00 | |||||||||||||||||
| 52.00 | O | X | O | A | O | O | X | O | X | • | 52.00 | ||||||||||||||||||
| 51.00 | O | X | O | X | O | X | O | X | • | 51.00 | |||||||||||||||||||
| 50.00 | O | • | 9 | X | O | O | X | • | 50.00 | ||||||||||||||||||||
| 49.00 | • | • | O | X | O | X | • | 49.00 | |||||||||||||||||||||
| 48.00 | • | O | X | O | X | • | Bot | 48.00 | |||||||||||||||||||||
| 47.00 | • | O | X | O | X | • | 47.00 | ||||||||||||||||||||||
| 46.00 | • | O | X | O | • | 46.00 | |||||||||||||||||||||||
| 45.00 | • | O | • | 45.00 | |||||||||||||||||||||||||
| 25 |
| ADSK Autodesk, Inc. ($310.73) - Software - ADSK returned to a buy signal Tuesday with a double top break a $312. This 5 for 5'er moved to a positive trend in July and sits in the top half of the favored software sector RS matrix. The weight of the technical evidence is favorable and improving once again. Initial support can be seen at $280, with further overhead resistance seen at $324. Note that earnings are expected on 2/26. |
| BRBR BellRing Brands Inc. ($78.30) - Food Beverages/Soap - Shares of BRBR broke a double top during Tuesday’s trading for its third consecutive buy signal, in addition to setting new all-time highs. The 5 for 5’er has been in a positive trend and on a market RS buy signal since 2022, and it continues to look strong from an absolute and relative strength perspective. From here, support lies at $70 and $65, with additional support further below at $49. |
| CARG CarGurus, Inc. Class A ($40.31) - Retailing - CARG broke a double top at $40 for a fourth consecutive buy signal since November 2023 and to mark a 52-week high. The stock is a 5 for 5'er that ranks within the top quintile of the Retailing sector matrix. Okay to consider here on the breakout or on a pullback to $37 on the chart. Initial support lies at $35, while prior resistance $26 may be seen as an additional level of support. |
| CR Crane Company ($176.30) - Electronics - CR pushed higher Tuesday after their earnings release to break a double top at $166 before rising to $176 intraday. This 3 for 5'er moved to a positive trend in October 2023 and has now given two consecutive buy signals. The weight of the technical evidence is favorable and continues to improve. Initial support can be seen at $156 with further support offered at $150, the current location of the bullish support line. |
| EXPE Expedia Group Inc. ($171.80) - Leisure - EXPE broke a double bottom at $168 to complete a bearish catapult. This action follows shares rallying to new highs in the lower $190s in December. The stock remains a 4 for 5'er and continues to rank within the top third of the Leisure sector matrix. From here, support for EXPE lies at $154 and in the $142 to $144 range. |
| GDDY GoDaddy Inc. ($212.96) - Internet - GDDY pushed higher Tuesday to break a double top at $212, notching a 13th buy signal and a new all-time high. This 5 for 5'er moved to a positive trend in September and sits in the top half of the favored internet sector RS matrix. The weight of the technical picture is robust and continues to improve. Initial support can be seen at $190. Note that earnings are expected on 2/13. |
| LYV Live Nation Entertainment Inc. ($143.02) - Leisure - LYV broke a double top at $142 for a second buy signal and to mark a new all-time chart high. The stock is a 4 for 5'er that ranks within the top quartile of the Leisure sector matrix and weekly momentum has flipped back positive, suggesting the potential for price appreciation in the near-term. Okay to consider here on the breakout or on a pullback toward the middle of the 10-week trading band at $134. Initial support lies at $128, while prior resistance around the $100 level may be seen as additional support. |
| RCL Royal Caribbean Cruises Ltd. ($264.06) - Leisure - RCL reversed into Xs and broke a double top at $252 for a second buy signal as shares rallied to new highs at $268. The stock is a 5 for 5'er that ranks 5th (out of 59) in the Leisure sector matrix. Okay to consider on a pullback in the $240 to $260 range. Initial support lies in the $224 to $228 range. |
| SCCO Southern Copper Corporation ($90.52) - Metals Non Ferrous - SCCO fell to a sell signal on Tuesday when it broke a triple bottom after unsuccessfully testing its bearish resistance line. The stock now sits against long-term support at $91, a level from which it has rallied on two prior occasions since August of last year. The technical outlook for SCCO is unfavorable - the stock is a 2 for 5'er after falling to a market RS signal violating its trend line last month. Earnings are expected on 1/31. |
| SHOP Shopify Inc ($116.87) - Retailing - SHOP broke a double top at $116 to return to a buy signal. The stock is a 5 fro 5'er that ranks within the top quintile of the Retailing sector matrix. Okay to consider here on the breakout or on a pullback to the middle of the 10-week trading band. Intiail support lies at $100, while prior resistance in the low $80s may been seen as additional support. |
| TDW Tidewater Inc ($53.26) - Oil Service - TDW fell to a sell signal Tuesday when it broke a double bottom at $53, where it now sits against support. The move adds to an already negative technical picture as TDW is a 2 for 5'er that ranks 66th of 67 names in the oil service sector matrix. From here, overhead resistance sits at $57. TDW is expected to report earnings on 2/26. |

| Name | Option Symbol | Action | Stop Loss |
|---|---|---|---|
| Darden Restaurants, Inc. - $192.40 | O: 25F190.00D20 | Buy the June 190.00 calls at 14.70 | 178.00 |
| Name | Option | Action |
|---|---|---|
| Bank of New York Mellon Corporation ( BK) | Mar. 80.00 Calls | Raise the option stop loss to 5.30 (CP: 7.30) |
| Amazon.com Inc. ( AMZN) | May. 220.00 Calls | Raise the option stop loss to 27.85 (CP: 29.85) |
| Leidos Holdings Inc. ( LDOS) | Mar. 160.00 Calls | Stopped at 140.00 (CP: 141.34) |
| Apple Inc. ( AAPL) | Jun. 220.00 Calls | Raise the option stop loss to 26.38 (CP: 28.35) |
| Walmart Inc. ( WMT) | Jun. 92.50 Calls | Raise the option stop loss to 7.10 (CP: 9.10) |
| Name | Option Symbol | Action | Stop Loss |
|---|---|---|---|
| Moderna, Inc. - $44.75 | O: 25R45.00D20 | Buy the June 45.00 puts at 8.15 | 49.00 |
| Name | Option | Action |
|---|---|---|
| Devon Energy Corporation ( DVN) | May. 37.50 Puts | Raise the option stop loss to 1.85 (CP: 3.85) |
| Alibaba Group Holding Ltd (China) ADR ( BABA) | Mar. 85.00 Puts | Stopped at 94.00 (CP: 94.76) |
| Name | Option Sym. | Call to Sell | Call Price | Investment for 500 Shares | Annual Called Rtn. | Annual Static Rtn. | Downside Protection |
|---|---|---|---|---|---|---|---|
| CF Industries Holdings, Inc. $ 88.77 | O: 25E92.50D16 | May. 92.50 | 90.25 | $ 43,150.75 | 20.74% | 15.46% | 4.38% |
| Name | Action |
|---|---|
| Fortinet Inc. ( FTNT) - 96.77 | Sell the March 97.50 Calls. |
| Norwegian Cruise Line Holdings Ltd. ( NCLH) - 26.39 | Sell the March 27.00 Calls. |
| NVIDIA Corporation ( NVDA) - 118.42 | Sell the May 140.00 Calls. |
| United Airlines Holdings Inc. ( UAL) - 106.74 | Sell the May 110.00 Calls. |
| Live Nation Entertainment Inc. ( LYV) - 140.13 | Sell the June 145.00 Calls. |
| Name | Covered Write |
|---|---|
| Hewlett Packard Enterprise Company ( HPE - 22.95 ) | March 24.00 covered write. |
| Carnival Corporation ( CCL - 25.68 ) | June 27.00 covered write. |
Daily Equity & Market Analysis
LISTEN TO PODCAST
Apr 02, 2026
Loading, Please Wait...
